
Overtime
Monday recap + more charts on the market crash


Good morning,
As promised, today’s Overtime is just an open-ended recap of the action we saw yesterday, plus charts and stats investors need to be aware of.
We’ll cover:
Where major indexes stand now
Noteworthy equity ETF charts
Important individual stocks
Fixed income markets
Key stats and forward return studies
and more
Let’s get into it!
Yesterday
Wild volatility but S&P 500 respects key levels
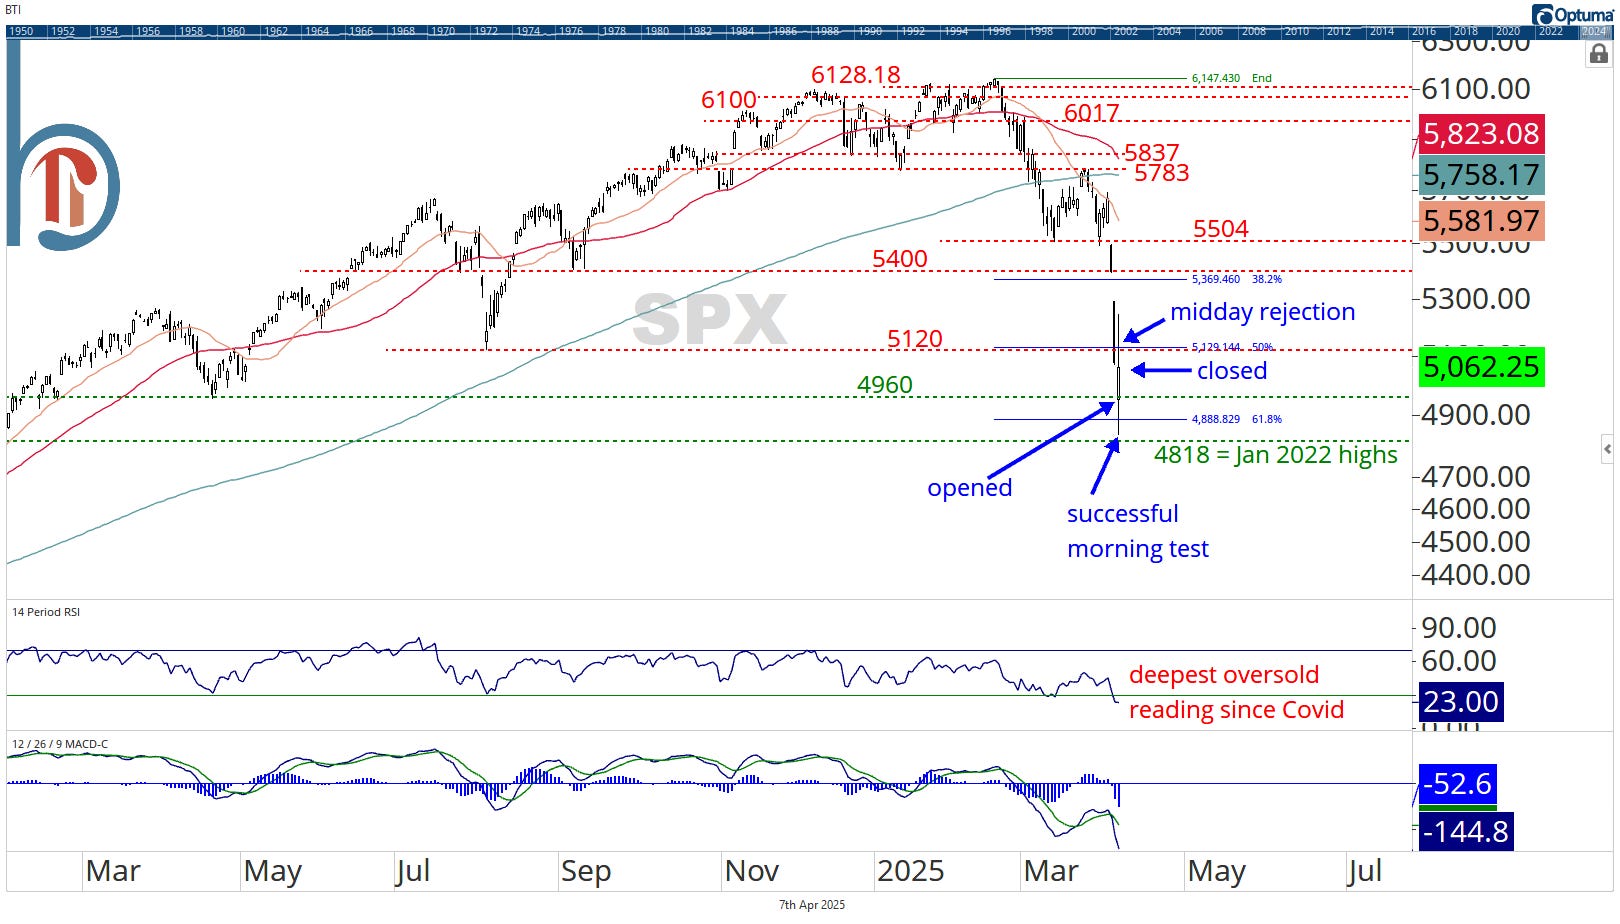
The S&P 500 fell again yesterday, but the 0.2% drop paled in comparison to the prior two days’ declines. The 8% daily range was the widest that we’ve seen since Covid but it wasn’t totally haphazard.
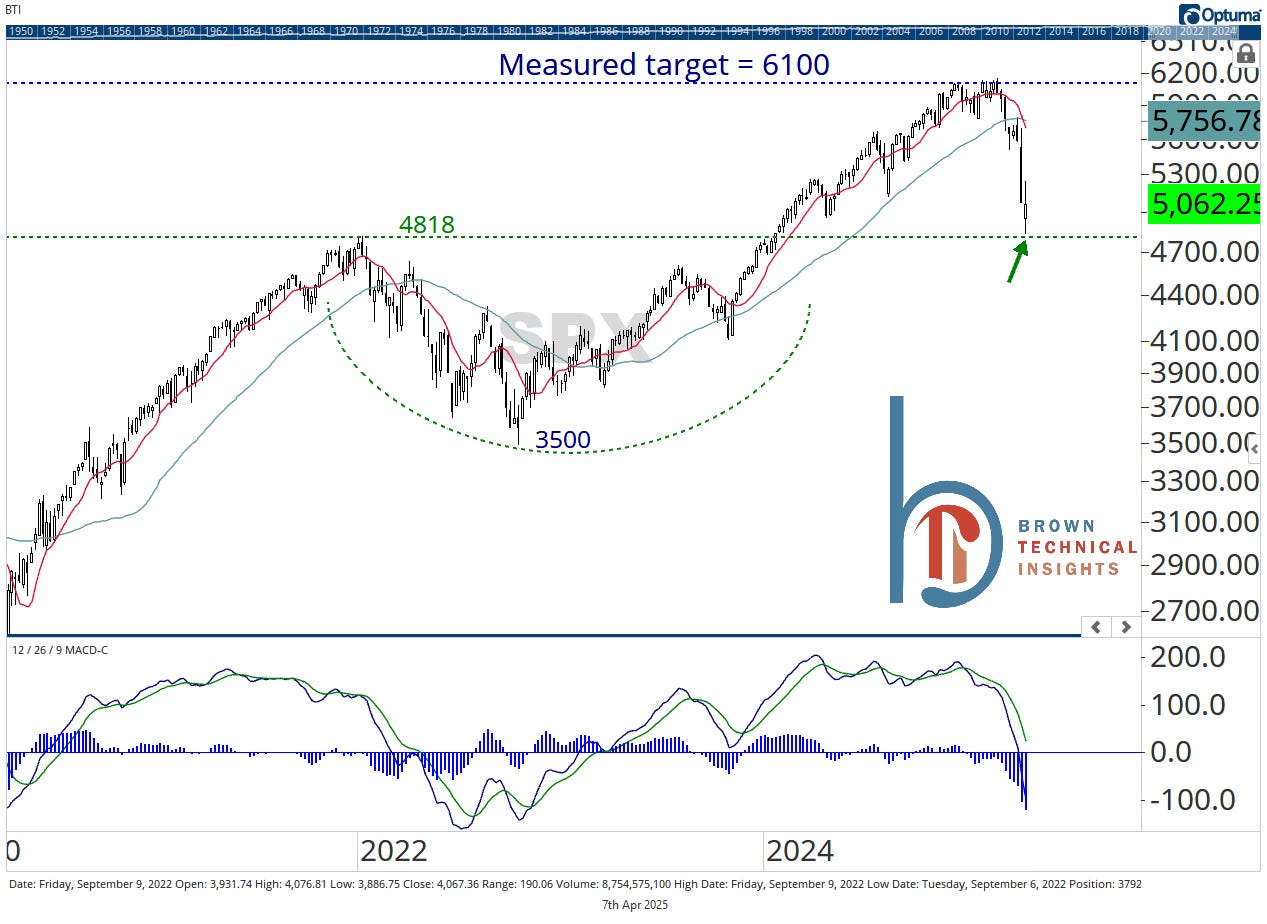
We opened on the 4960 support level, quickly dropped to the January 2022 highs, rallied on a false report, and then fell back to close just below first resistance at 5120. Resistance levels are more likely to be respected than support right now, but yesterday’s low (4835) to 4818 is a critical support range. Below is the long-term weekly look at why 👇
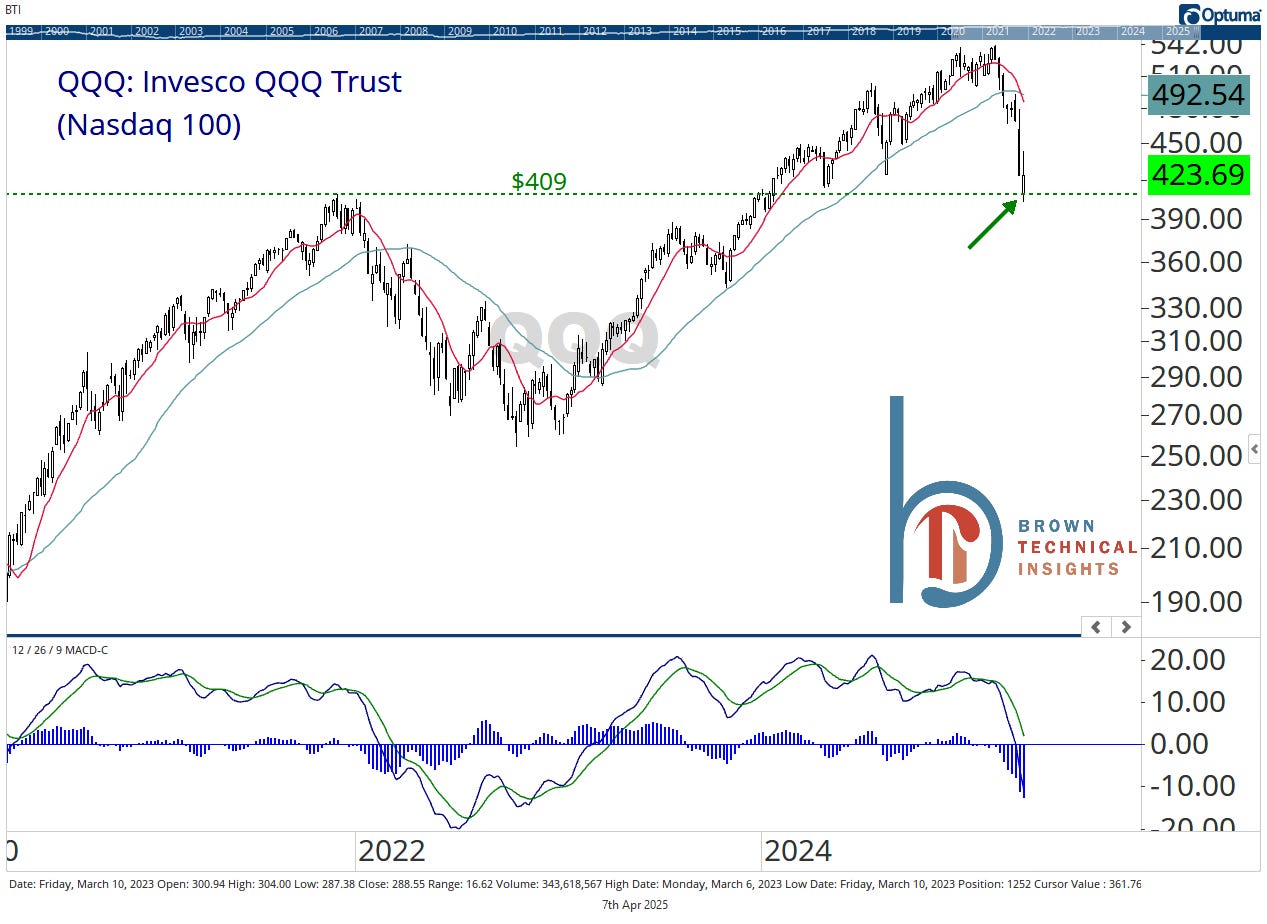
The Nasdaq 100 is also at a similar spot
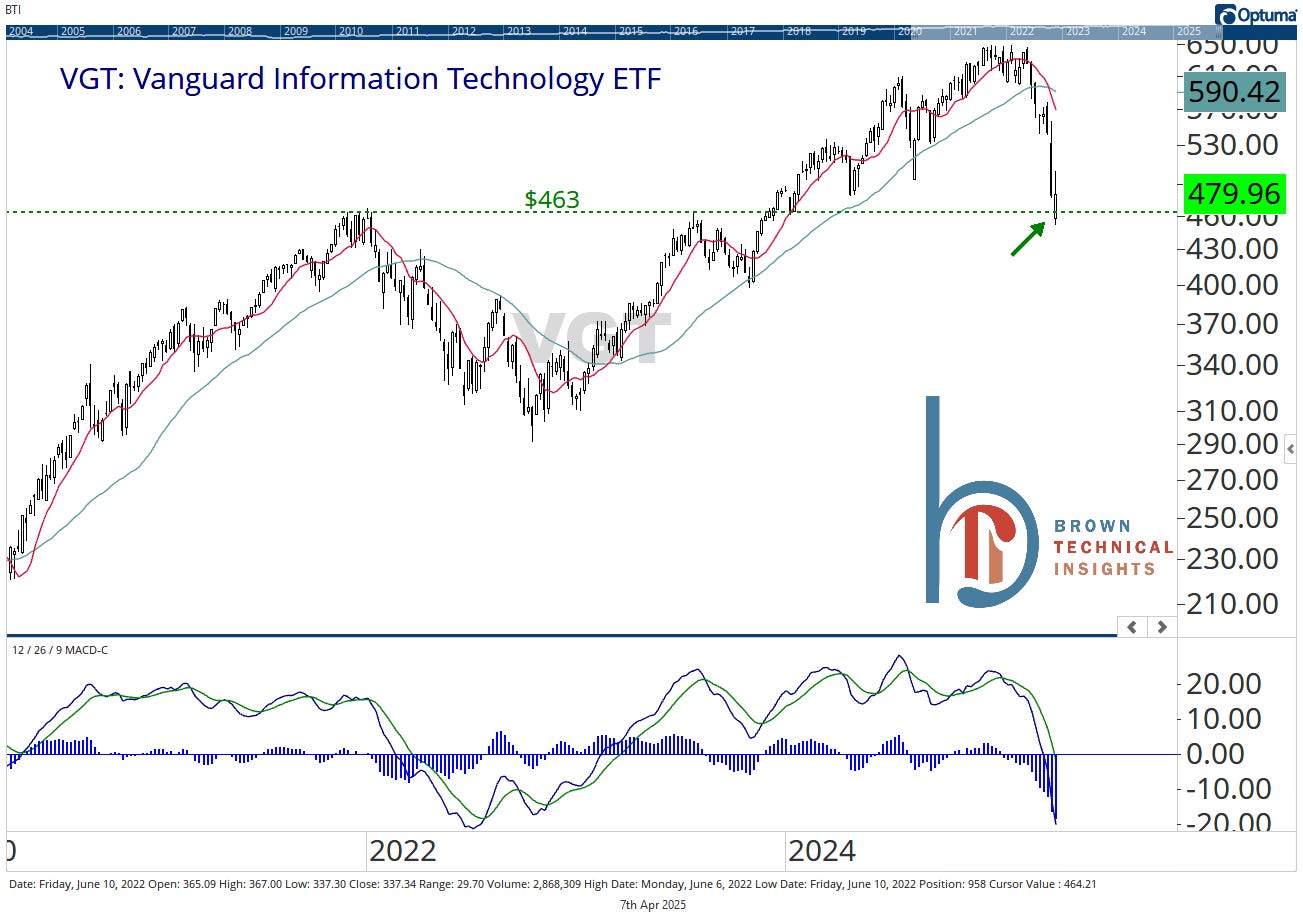
As is the tech sector
I don’t think it is a given that these support levels hold. But I also don’t think it’s a coincidence that we saw the selling take a pause here.
