
Overtime
US equity style box review


Good morning,
Sometimes, the reports just write themselves.
When I decided to take yesterday’s MMP in a decidedly different direction, with a thematic/leadership focus, I knew I wanted Overtime to provide a technical update in a broader way.
But all that was decided before yesterday’s explosive move higher, as bullish trade talk developments and comments from President Trump and Treasury Secretary Scott Bessent sent equities soaring at the open.
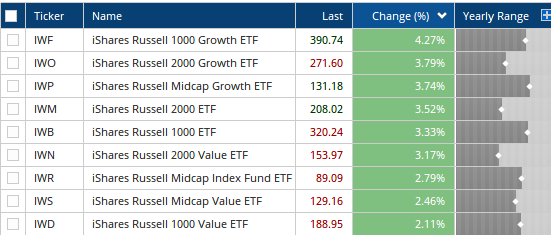
It’s not always about the levels, but yesterday definitely saw some big ones taken out. Today, we’ll review the 9 corners of the US equity style box, using iShares ETFs for consistency.
If you use mutual funds or like to divvy up portfolio sleeves by small vs. large, growth vs. value, this is the report for you.
Let’s get into it!
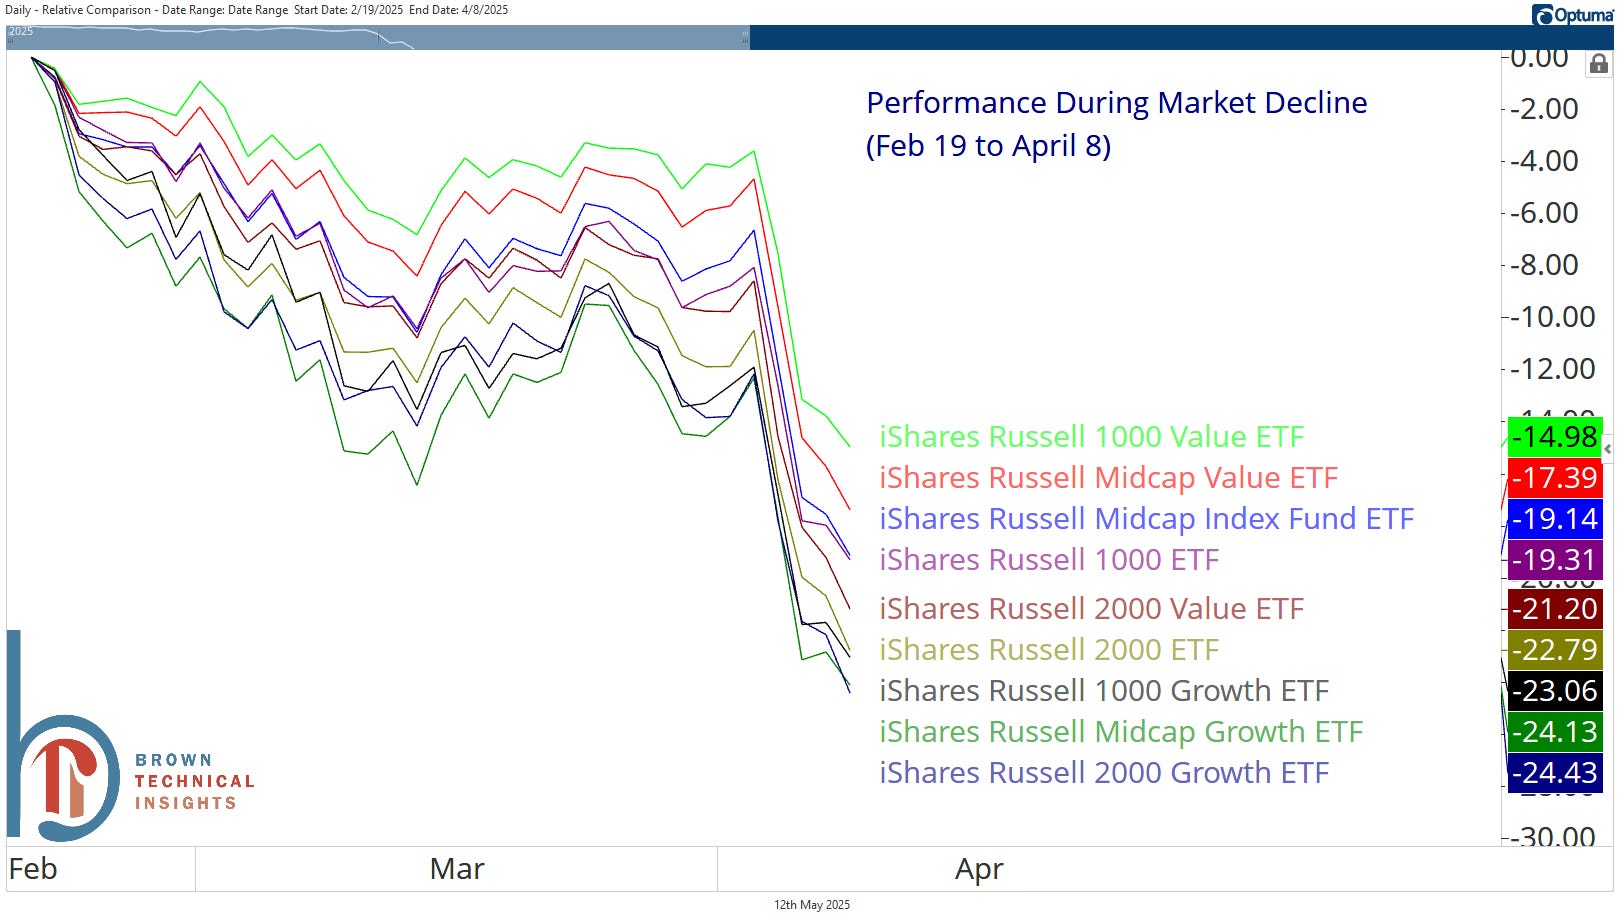
Performance Review
Large growth led yesterday’s rally
Small and growth hit the worst during the decline
Midcap growth has been tops since the market’s closing low
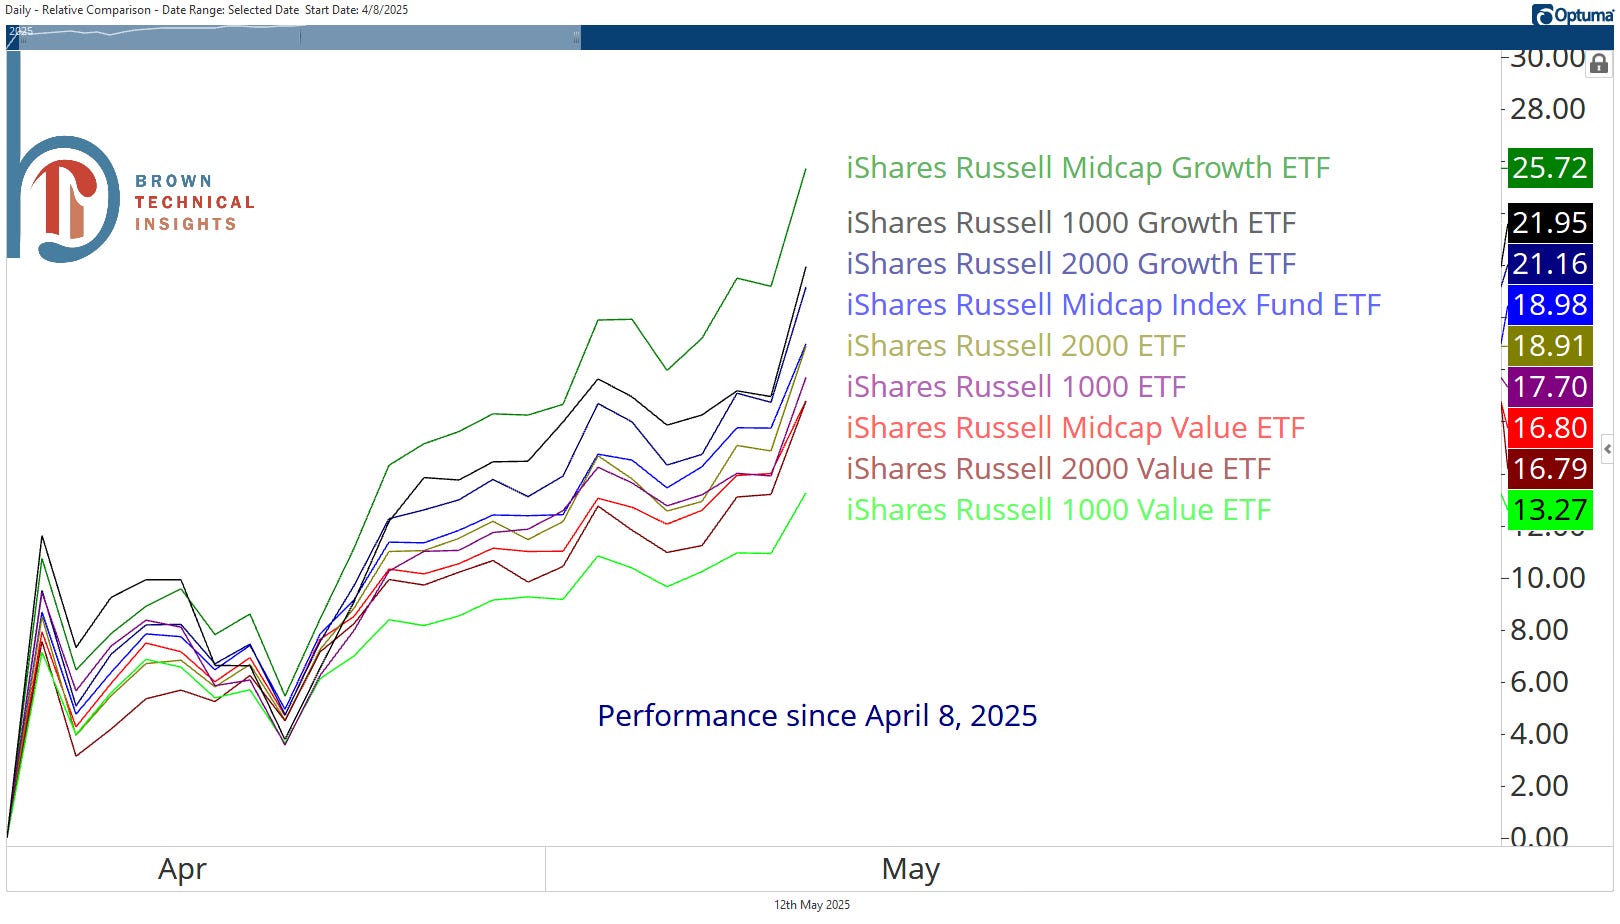
But it’s growth across the board at the top, and all value at the bottom.
Just 3 of 9 boxes are positive year to date
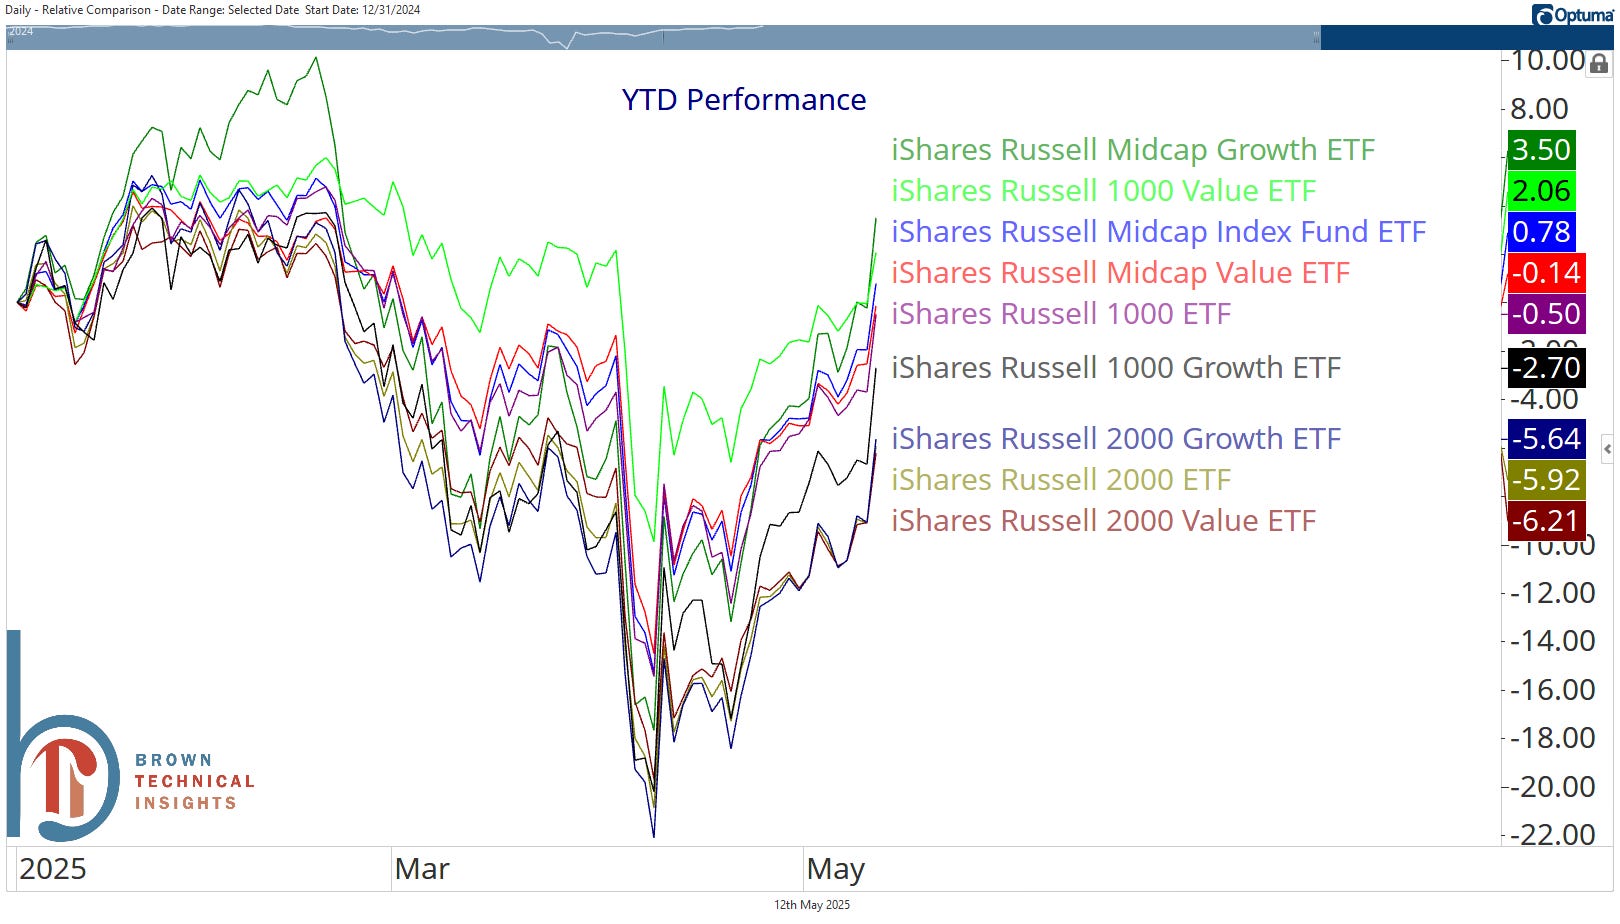
All styles of small caps lagging is a clear theme here.
IWF: Large Cap Growth
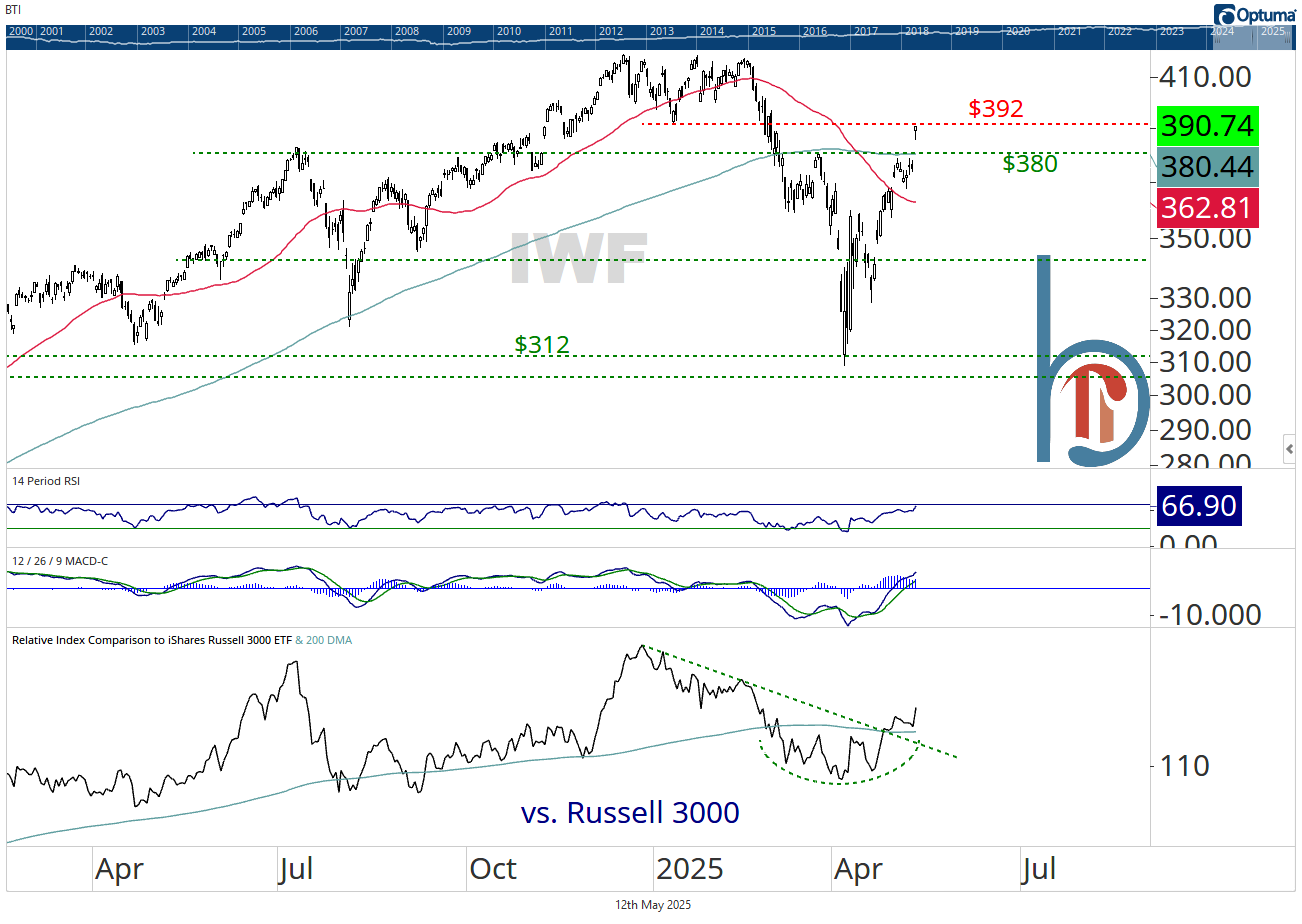
Large growth stocks led yesterday’s rally, with IWF gapping above $380 resistance and its 200-DMA. $392 (the January low) is the only resistance level separating IWF from all-time highs but the real story is the bottom panel, where relative to the Russell 3000, large growth looks to have bottomed and is on the verge of a 3-month high.
IWB: Large Cap Blend
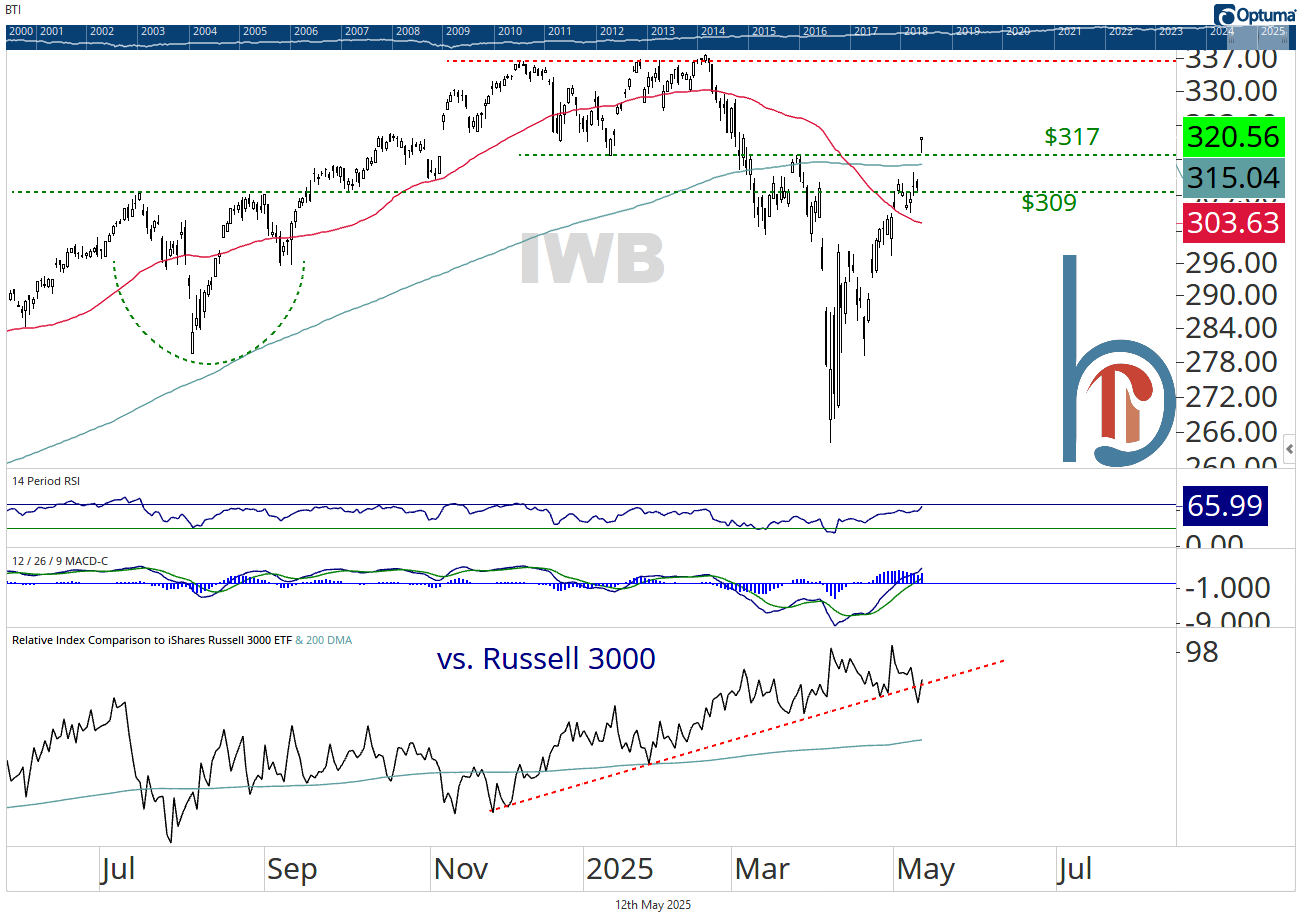
The most like the S&P 500, IWB’s gap up yesterday cleared not only the March highs and 200-DMA but put it back above its January lows. Holding $317 would be the most bullish thing this ETF can do as it consolidates increasingly overbought market conditions.
🚨 Quick market note! 🚨
Yesterday, 57% of the S&P 500 traded to a 1-month high. That’s above the 55% threshold for the deGraaf Breadth Thrust. In 19 signals since 1999, the S&P 500 has never been lower 12 months later. I called out the most recent one in December 2023, and the S&P 500 proceeded to gain 28.5% over the next 12 months.
