
Overtime
The Bear Case


Happy Halloween!
Today, we’re getting spooky and looking at the bear case for equities.
After yesterday’s Playbook laid out how this correction could potentially be nearing its end, I wanted to take the other side and objectively show some of the very real problems and potential problems that this market has.
Specifically, we’ll cover:
What broken divergences look like
Faltering cyclical groups
Downside targets for major indexes
Troublesome trends in rates and the dollar
and more
Poor near-term technicals
Short-term downtrend, broken support for the S&P 500
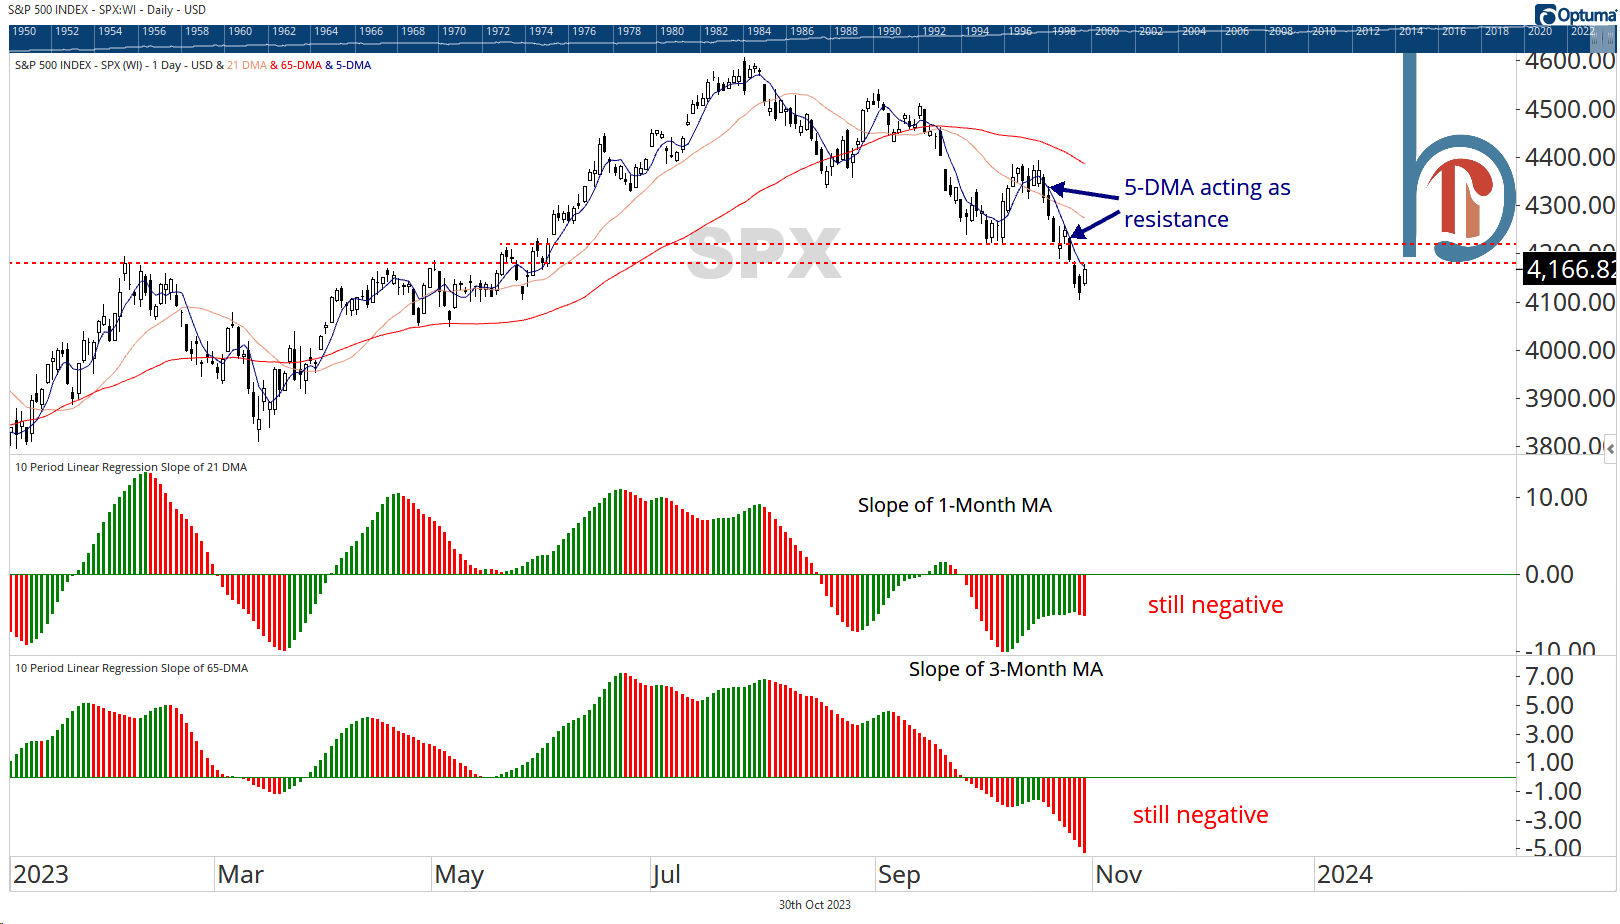
On a short-term basis, the S&P 500 is falling and before we can talk about stocks going up, they have to stop going down. Both the 1 and 3-month moving average slopes are negative, and the S&P 500 has yet to overcome its 5-day moving average, which acted as resistance again yesterday. Longer-term, the index has broken key support at 4172-4180 and needs to get back on the right side of it.
Long-term breadth remains awful
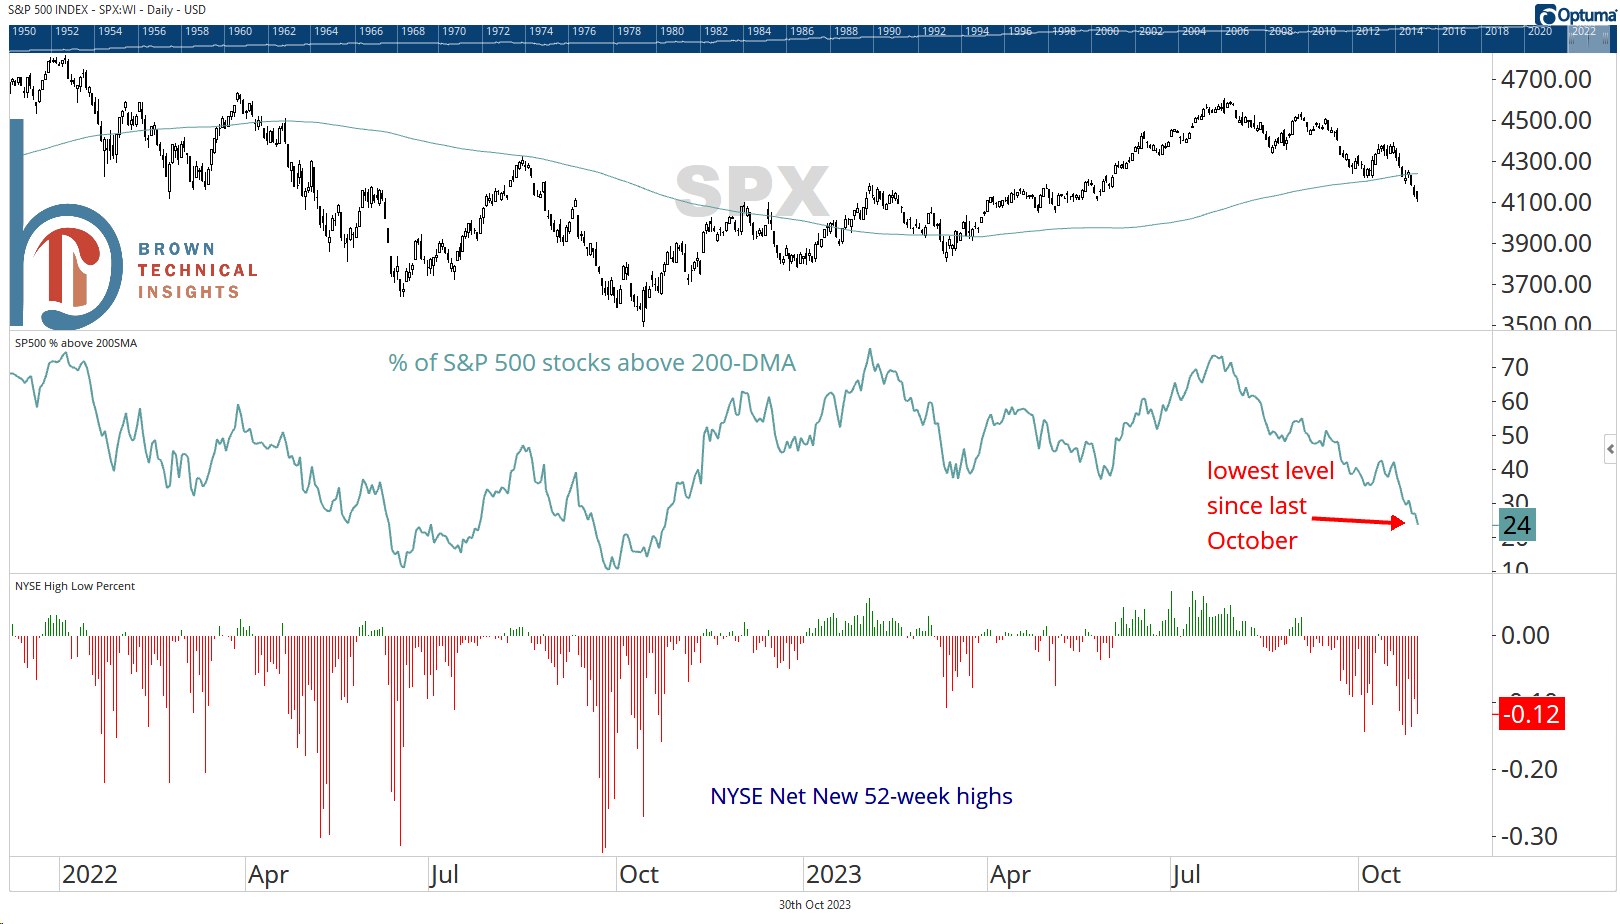
Yesterday, I showed some bullish divergences in terms of the percentage of stocks above shorter-term moving averages. But long-term trends are getting worse, not better. The percent of stocks in the S&P 500 above their 200-DMA has fallen to just 24%, its lowest level since October of last year, while NYSE net new high data shows 12% more stocks at 52-week lows than 52-week highs.
