Overtime
Factors
Please note, Brown Technical Insights will be off next week for Thanksgiving.
Good morning,
This week we’re looking at the technicals for the most common equity factors. Yesterday’s Playbook looked at some divergences that favor low vol, and the size factor’s perennial underperformance remains one of the most talked about stories of 2023.
This week, we’ll review year-to-date performance and cover other factors including:
High beta
Value
Quality
Momentum
Please note, the charts we’re using today feature momentum for the factor relative to the S&P 500 because we’re most interested in what is working vs. the absolute technicals.
Performance
Quality is the only factor outperforming YTD
Of the 6 major factors we’re looking at today, only quality has outperformed the S&P 500 year to date. The rest are not just lagging, but 3 are outright negative.
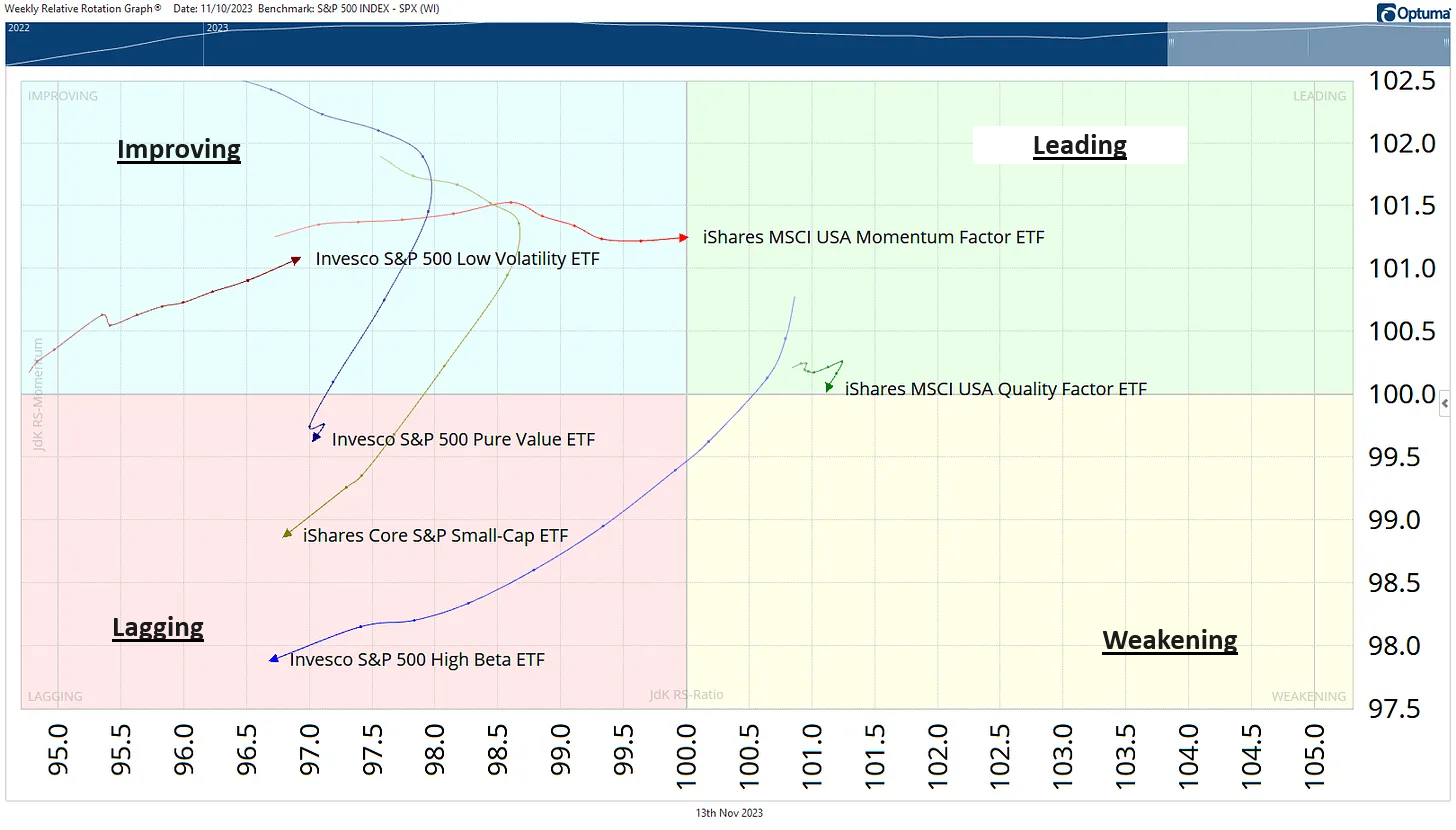
Relative Rotation Graph
The relative rotation graph is another way to view performance and confirms most of what I’m going to call out in the traditional technical charts below.
Quality is leadership, but flirting with moving towards weakening
Momentum is doing well
Low vol is showing signs of improvement
Value and small-caps are terrible
High beta has gone from leading to firmly lagging, a yellow flag amid the market’s recent rally
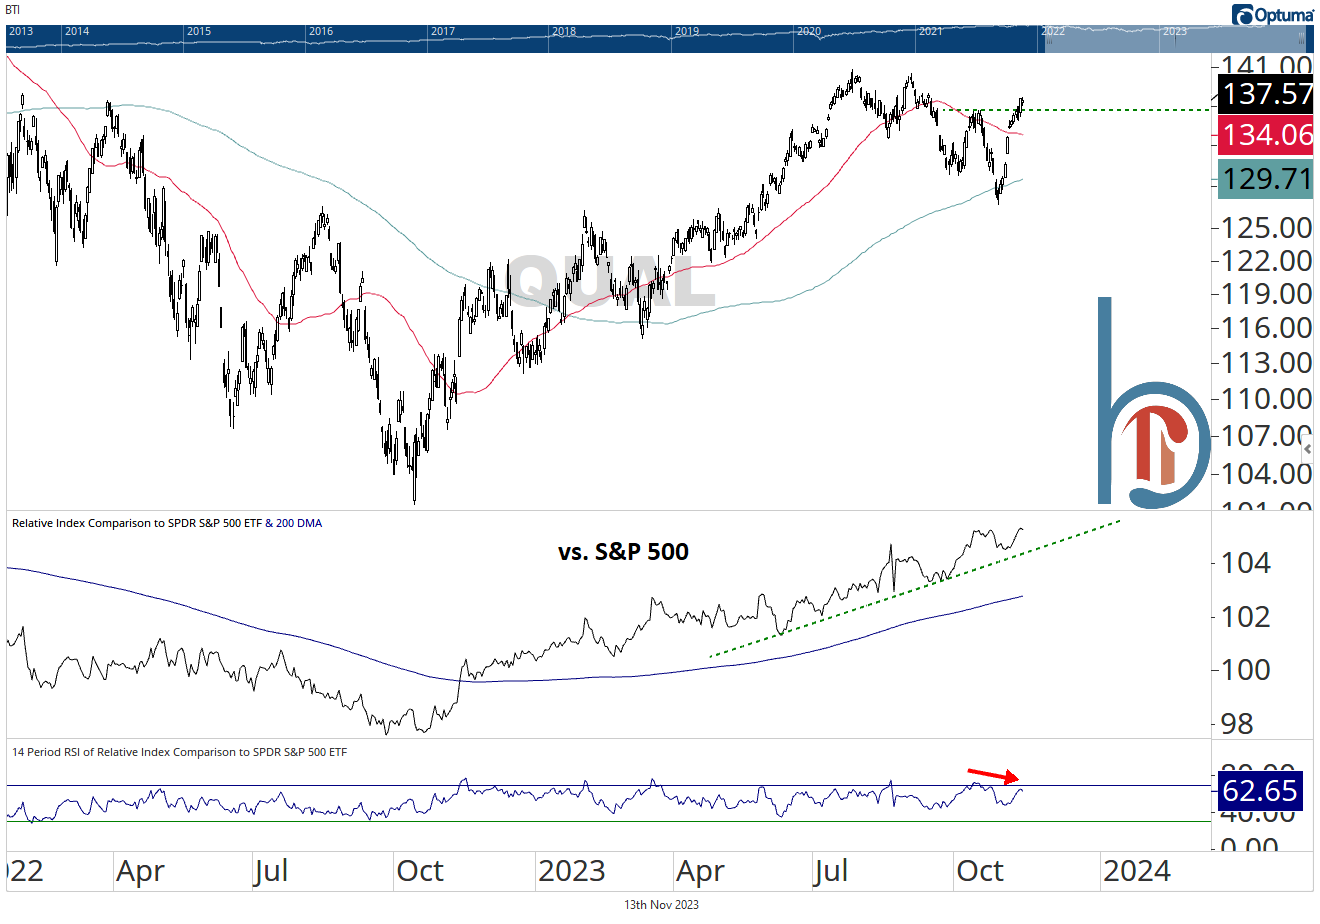
Quality
Quality has been worth paying up for
The quality factor isn’t all tech by any means, but its chart pattern certainly bears a strong resemblance to XLK. We’ve all heard the fundamental reason that people have flocked to the Magnificent 7 is those strong balance sheets and frankly, this supports that. The relative trend is incredibly strong but is showing a bearish divergence on its most recent new highs.


