
Overtime
Mailtime


Good morning,
Very light mailbag today, so I’ll quickly use this space to let you know about a few other ways you can catch me over the next week.
First, I’m guest authoring the CMT Association’s Market Mosaic Daily this week. This morning email is authored by a different member of the CMT Association each week, and has been bringing some unique insights to my mailbox recently. It’s completely free, and you can subscribe at the link below (scroll down to the Research section if not prompted).
https://content.cmtassociation.org/hub
Next, I’ll be back on StockMarketTV with JC Parets and crew next Monday at 9:00 am ET.
There isn’t a direct link to the livestream yet, but you can find it when available on their YouTube page.
With that, let’s get to our questions and chart requests.
Questions
Can you discuss the Dispersion Index trade, and what contribution it may be having to recent mega cap outperformance?
At its core, the dispersion index trade is a bet on single stock volatility relative to index volatility. Because investors tend to hedge macro risk with index level hedges, that volatility tends to trade at a premium.
In the dispersion trade, hedge funds and sophisticated traders sell index volatility and buy single-stock volatility, often via options on individual names.
In recent years, some of the underlying mechanics have been blamed for the dominance of mega-cap growth stocks in cap-weighted indexes. When hedge funds purchase these options from dealers, the dealers turn around and buy the underlying shares to hedge their exposure. That persistent “non-fundamental” bid in the stocks of the largest index weights has been called a self-reinforcing loop.
I won’t pretend to be an expert on the internal plumbing of the market or even options, but I’ll note two issues with the conclusion that it has driven the rise of mega-cap stocks.
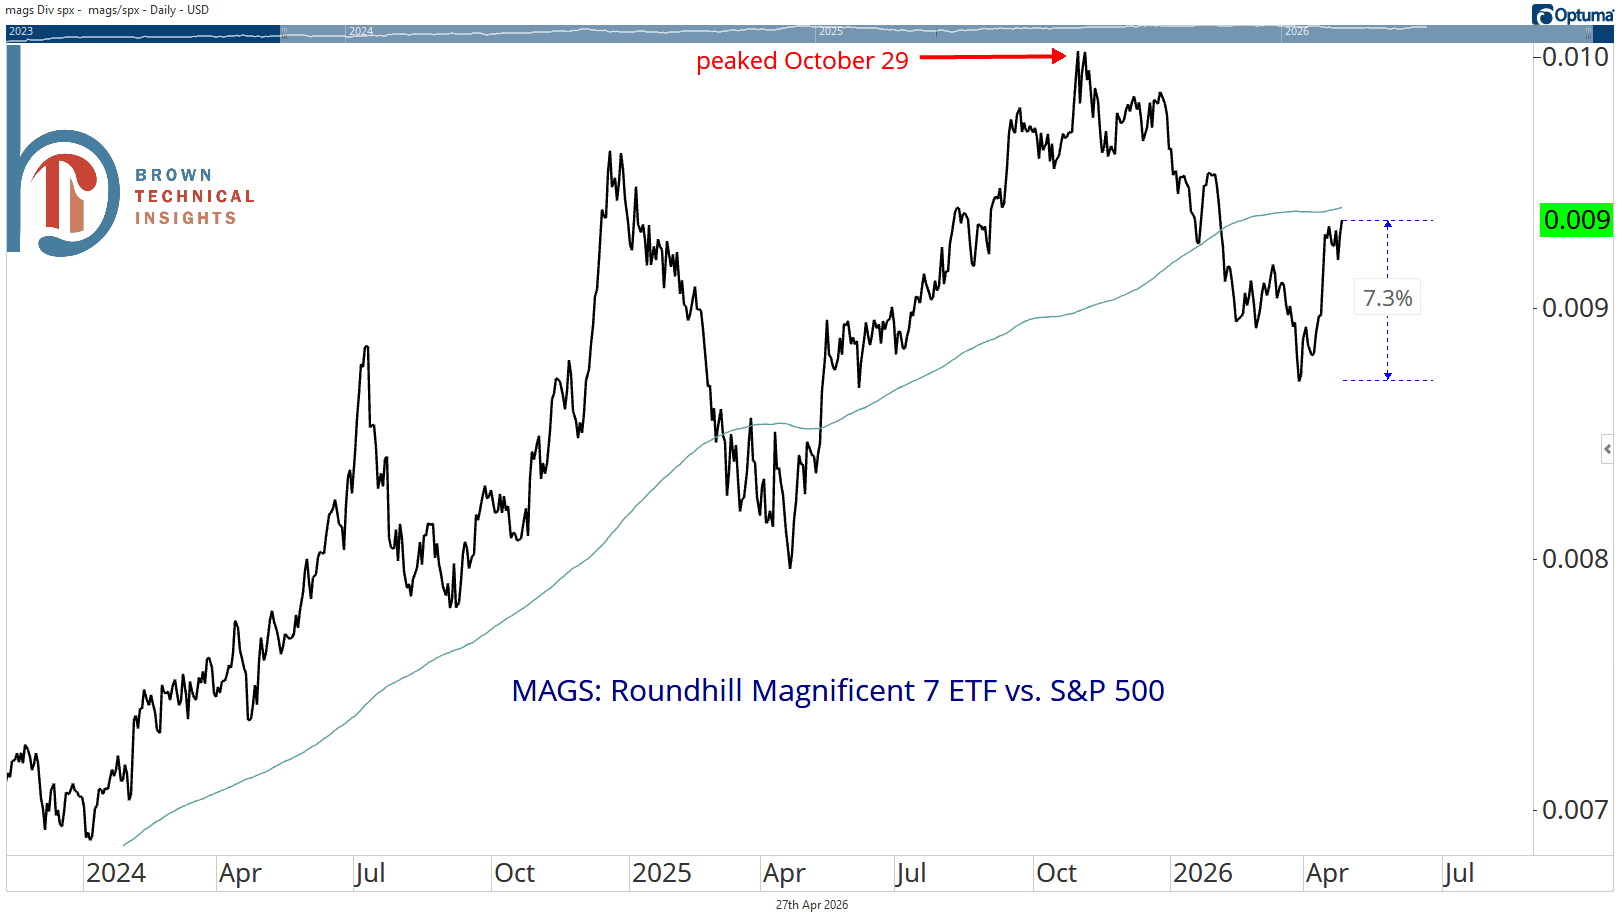
First, the Magnificent 7 haven’t been doing that well vs. the S&P 500. The Roundhill Magnificent 7 ETF (MAGS) peaked relative to the S&P 500 back on October 29. While we’ve seen some outperformance since the recent market bottom, that 7.3% of alpha hasn’t even gotten the ratio back to its 200-DMA.
The second is (gasp) a fundamental reason. The chart below comes from Matt Cerminaro (I told y’all to follow this kid) and shows net income vs. market cap by sector.
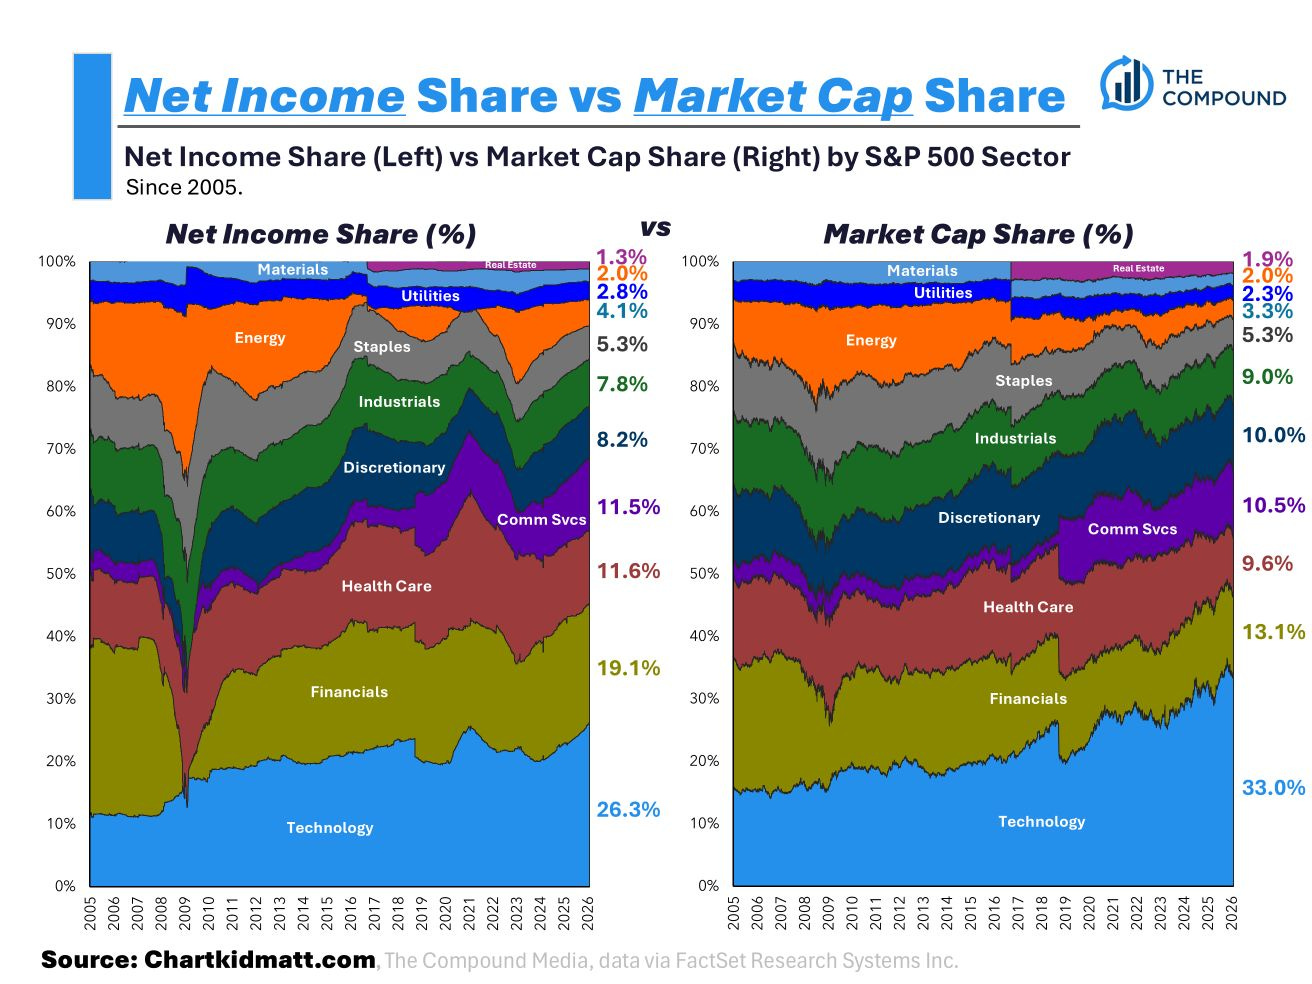
As you can see, the market cap share closely tracks the net income share, suggesting that the continued increase in tech stocks’ weighting is due to earnings, and not out of step or due to some detached-from-reality option dealer bid for the stocks.
