Overtime
The Dollar
Good morning,
In yesterday’s Playbook, I highlighted an inverse head and shoulders pattern in the dollar. This is important because there has been a strong inverse correlation with stocks and the dollar, meaning dollar strength could be a bearish signal for equities. Well today’s planned report became especially timely, because DXY broke out and completed that pattern in a big way yesterday.
Today we’ll break down the correlation to equities as well as:
Short and long-term technicals of the dollar
The composition of the DXY
Key currency pairs
and more!
Why it matters
The correlation with equities is clear
Over the trailing 3 months, the S&P 500 and US Dollar Index have a -0.39 correlation, something that has been relatively stable over the past 4 years. Dollar down, stocks up. Dollar up, stocks down.
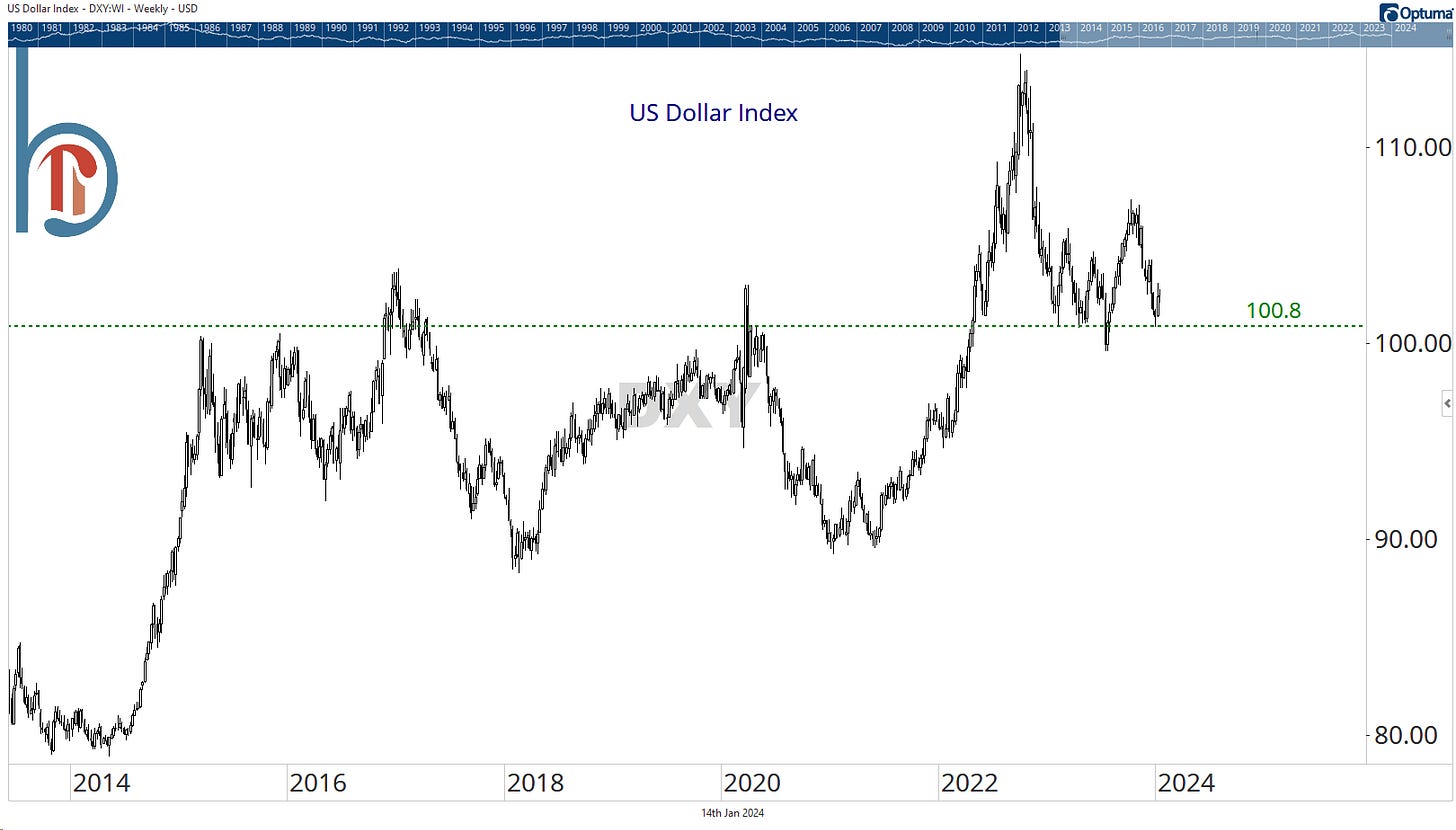
Big picture: Important support near 100
The US Dollar Index may be down more than 10% from its 2022 highs, but a structural breakout and uptrend are arguably intact as long as DXY remains above 100. That’s exactly where we’ve bounced the past few weeks and the place where 3 different rallies started in 2023.
Head and shoulders pattern completed on Monday
Here is an updated chart of what appeared in yesterday’s Playbook. DXY gained 0.8% on Tuesday, a powerful completion of the inverse head and shoulders pattern. The measured target is 105, and that additional upside is another tactical reason to be cautious on equities over the coming days/weeks.


