
Overtime
ETF flows


Good morning,
People are worried.
Despite the S&P 500 sitting near record highs and the Dow Jones Industrial Average and equal-weight S&P 500 recently breaking out of 8-month bases, the AAII sentiment survey has shown five straight weeks of more bulls than bears.
But what people say they’re doing with their money doesn’t always match up with what they’re actually doing. And for that, we turn to our flow data.
A reminder that we look at flows as a sentiment indicator, and like all sentiment indicators, we want to view them with a contrarian lens.
Just like our previous reports, I’ll highlight ETFs that fall into one of 3 categories:
Overly aggressive. These ETFs have seen extreme inflows. For an uptrend, I don’t believe that alone is a reason to sell but it’s a yellow flag and could indicate more downside vulnerability in a correction.
Contrarian positive. These ETFs have seen significant outflows recently and extreme readings could indicate selling is unlikely to continue to the same degree. Potential tailwind if a downtrend can stabilize and a bullish indicator for uptrends or ETFs breaking out.
Apathetic. Flows here aren’t extreme in either direction but that means there could be room to run for the underlying trend.
Let’s get into it!
Overly aggressive
Nuclear/uranium stocks
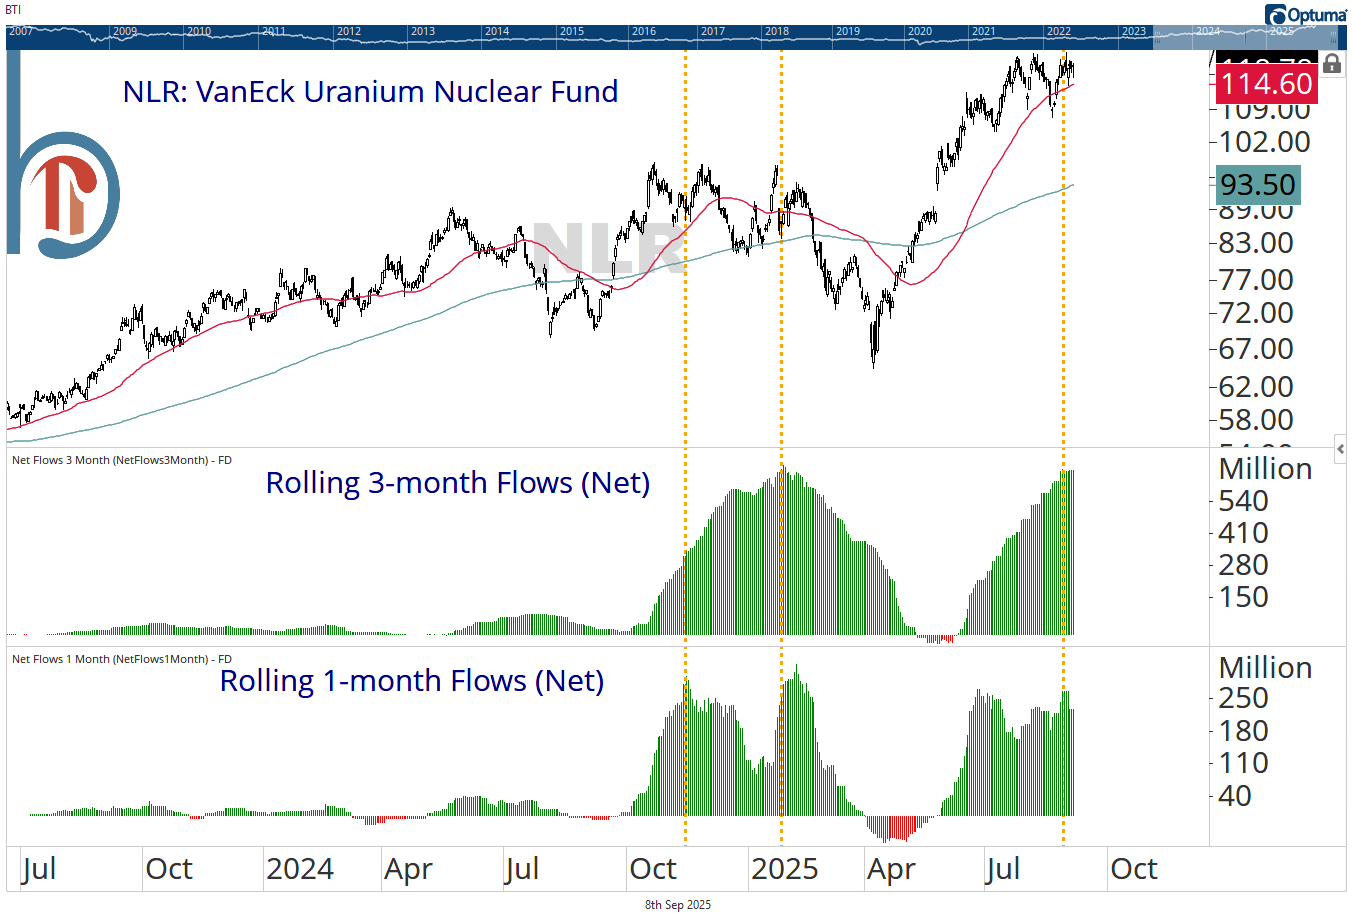
This is niche ETF, but NLR has taken in over $660 million in the past three months, and the last time we saw that was right before a 30% drawdown.
Homebuilders
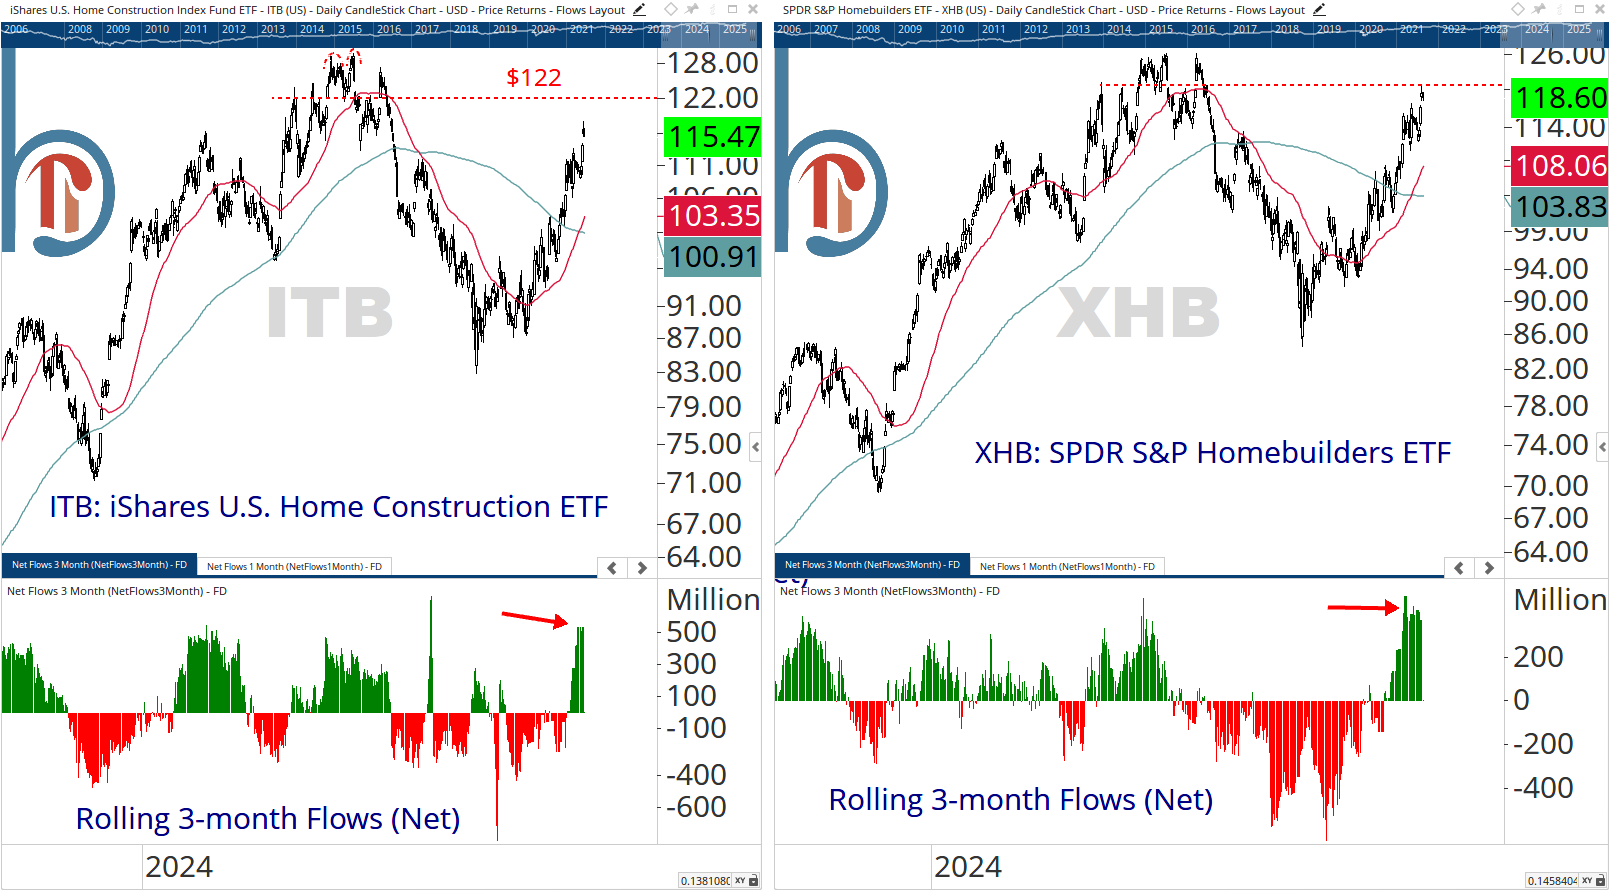
Homebuilders have gone straight up since the April lows, but this is no longer a contrarian trade. Both ITB and XHB have seen three-month inflows that rival their highest readings since the summer of 2020. It’s also noteworthy that both of these ETFs are approaching potential resistance levels, increasing the chances of a cool-off.
