Good morning,
The last Tuesday of the month is your chance to be heard, and we got some great questions and chart requests. One of the questions got a little philosophical, so no time to waste on an intro.
Let’s get into it!
Questions
Which energy play has the best technical setup among ETFs?
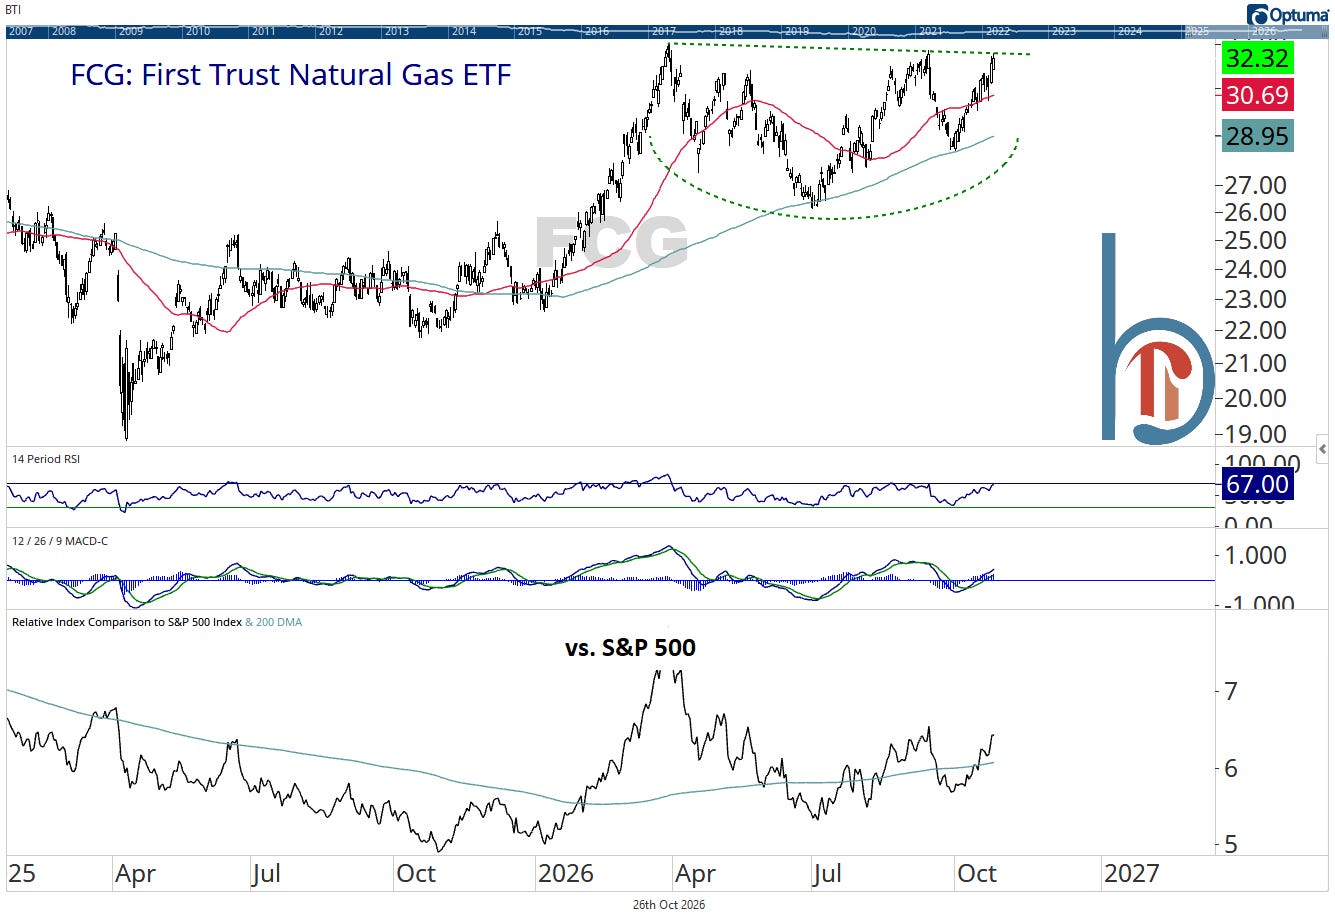
Honestly, it just depends on the day and your time horizon, as almost all areas still act great. FCG (shown above) was a featured “Tactical opportunity” in yesterday’s Playbook, while OIH (oil services) was featured last week. I still like both, and you can’t go wrong with XLE either.
It’s among the most volatile, but the position we own in our ETF models, in addition to XLE, is XOP, the exploration and production ETF.
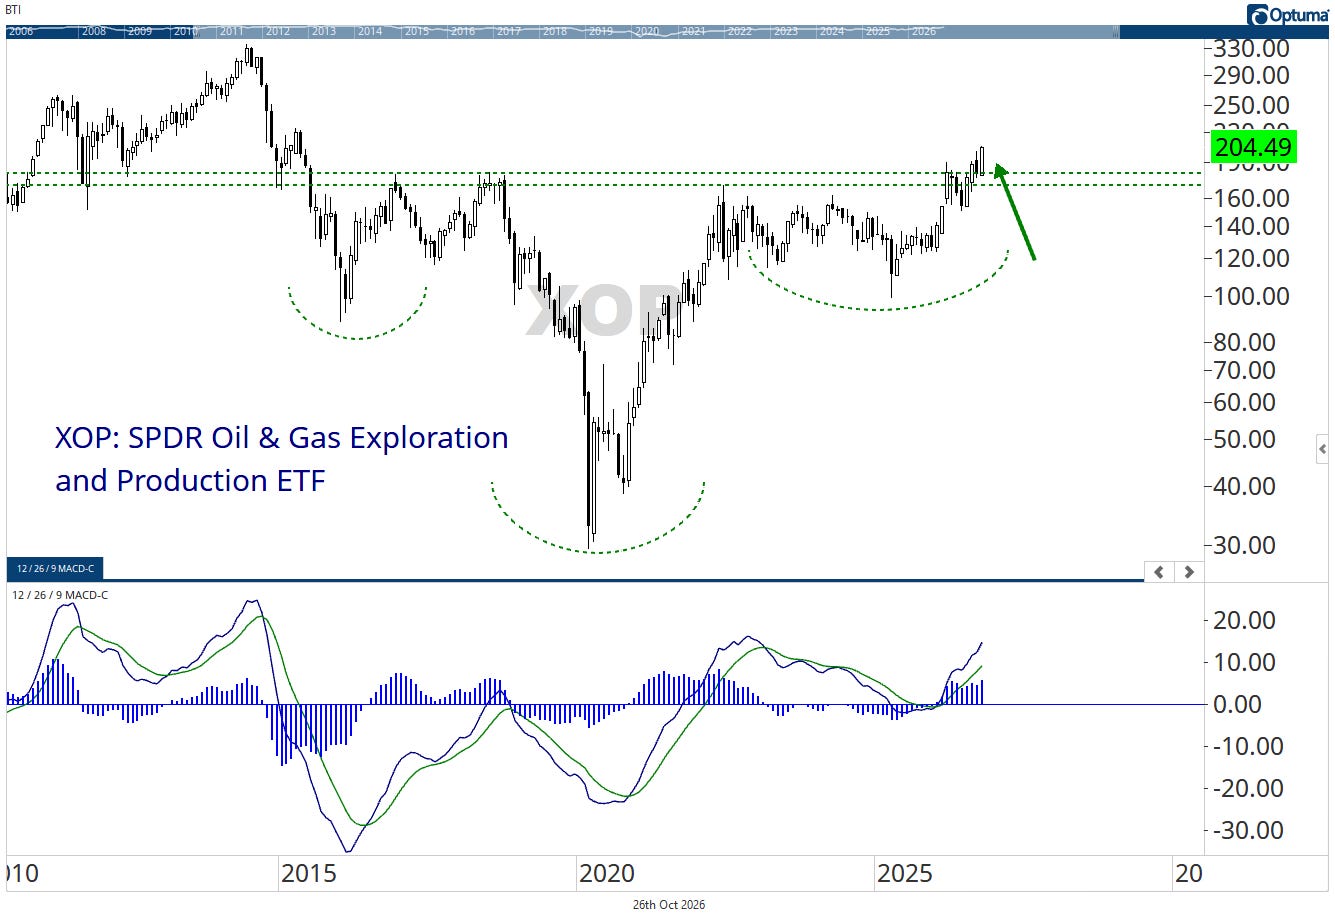
It’s hard to beat this long-term chart, and the ETF closed at a fresh decade-high yesterday.
How has your thinking and craft evolved since you’ve been practicing? Are there any indicators or concepts that have been a game changer for how you trade or think about markets?
I hope I’m always evolving and getting better, but how I pick stocks is what comes to mind first and foremost.
While there’s some truth to the idea that a chart is a chart, picking stocks is a different animal than being a top-down strategist. While I always followed single stocks, those of you who have been with me since my days at LPL Financial know the team doesn’t cover individual equities. And frankly, I had to get better at it.
Without being too long-winded, the biggest improvement I’ve made is focusing MORE on the short-term chart. It’s easy to say the big picture is all that matters, but in the first year of the Blue Chip Hot List, I would often buy a stock that had broken out, but was pulling back toward the breakout point. And yes, that breakout point “should” act as support. But at the end of the day, I was adding a stock to the list that was falling, even in the very short term.
We closed out 28 trades in the first calendar year of the Hot List, and though the average return was positive (+4.8%), the average pick underperformed the index by 0.44%.
However, by focusing more on the short-term setup and finding stocks that are working on both the short and long term, I think I’ve greatly improved how we do things. It may seem too noisy for a list with an average holding period of three months, but I now only add stocks to the list that are above their 5-day moving average.
Despite plenty of small losses recently, our average stock pick that has been closed out in 2026 has outperformed the S&P 500 by 2.4%, and with a holding period a full month shorter than that first year.
Chart Requests
BAI: iShares AI Innovation and Tech Active ETF
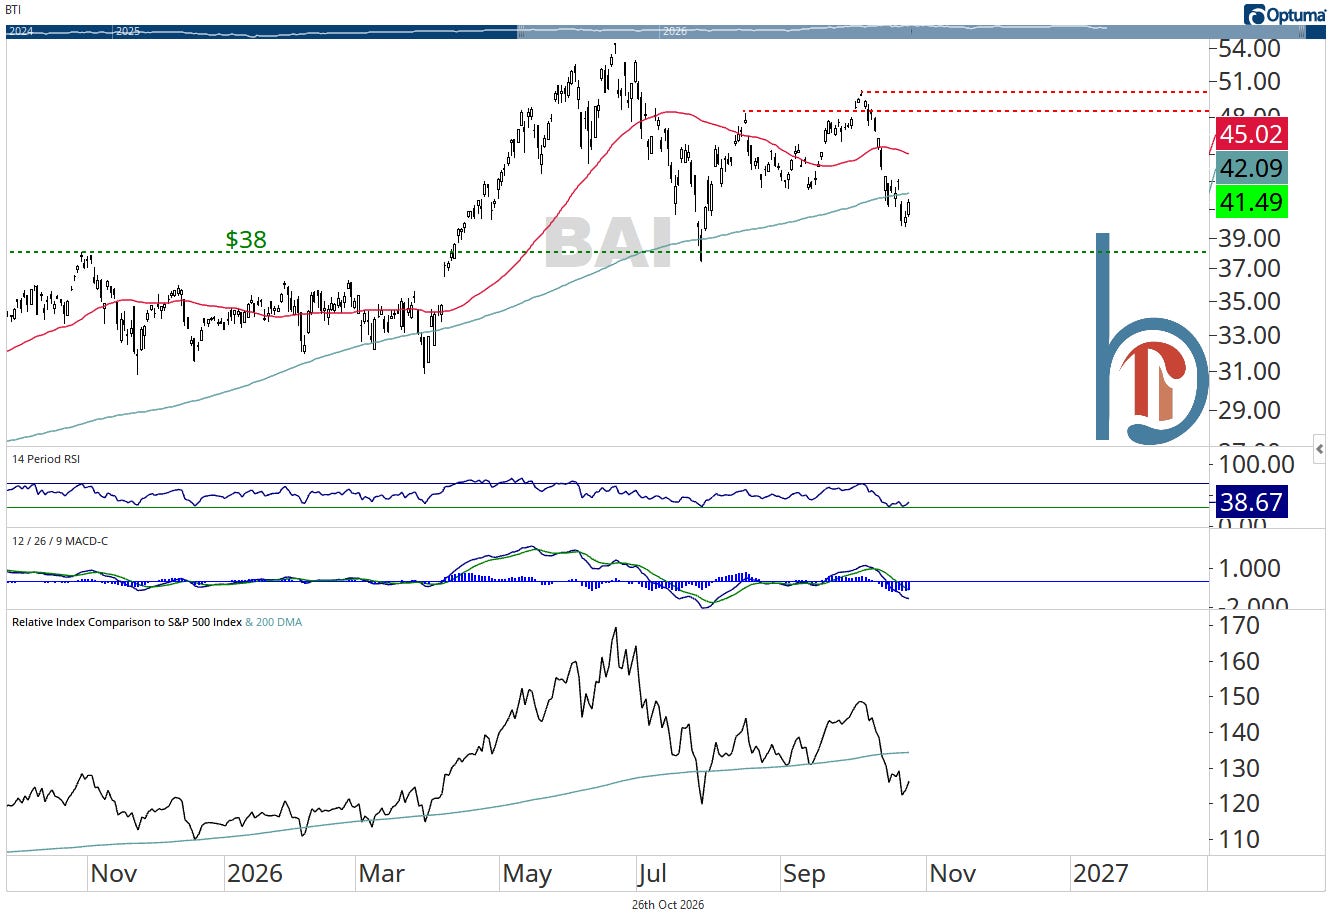
The 200-day has been rough support for BAI since its inception but investors should be wary with price still below it. This week’s earnings will be big for the AI trade, but as it stands today, I wouldn’t be a buyer. $42 is resistance; $38 is next support.
CASY: Casey’s General Stores