Overtime
Energy
Good morning,
The subject of this week’s Overtime is energy. It’s too early to call the sector leadership, in fact, it is one of only three sectors still negative YTD. However, it is showing some real signs of life lately along with energy commodities. After exploring some of those topics along with their relationship to interest rates in yesterday’s Monday Morning Playbook, it seemed right to take the sector into Overtime and explore how real that strength is and how to play it.
Today’s report will review
Absolute and relative technicals for the broad sector
Energy commodities turning higher
What sub-industries are outperforming and which are lagging
Leading and lagging stocks
and more!
Top-down technicals
XLE testing April highs
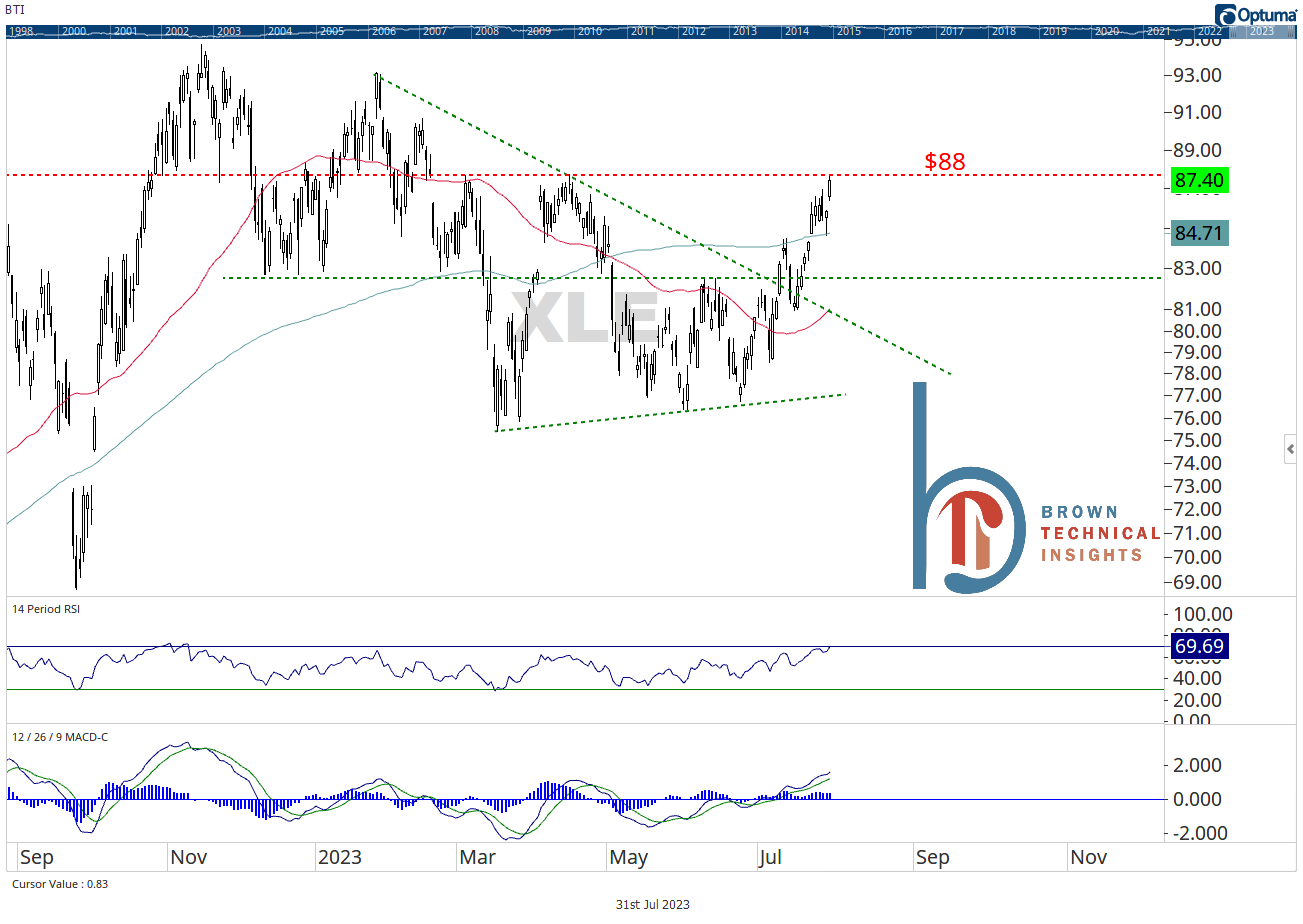
Energy has spent the past week pausing on the right side of its 200-DMA and yesterday’s 2% gain was tops among large-cap sectors. XLE is now testing its April highs at $88 and a breakout above would leave little to call resistance before the November highs. I believe it gets there, supported by the first overbought reading we’ve seen since November.
Supportive technicals on a weekly basis vs. SPY
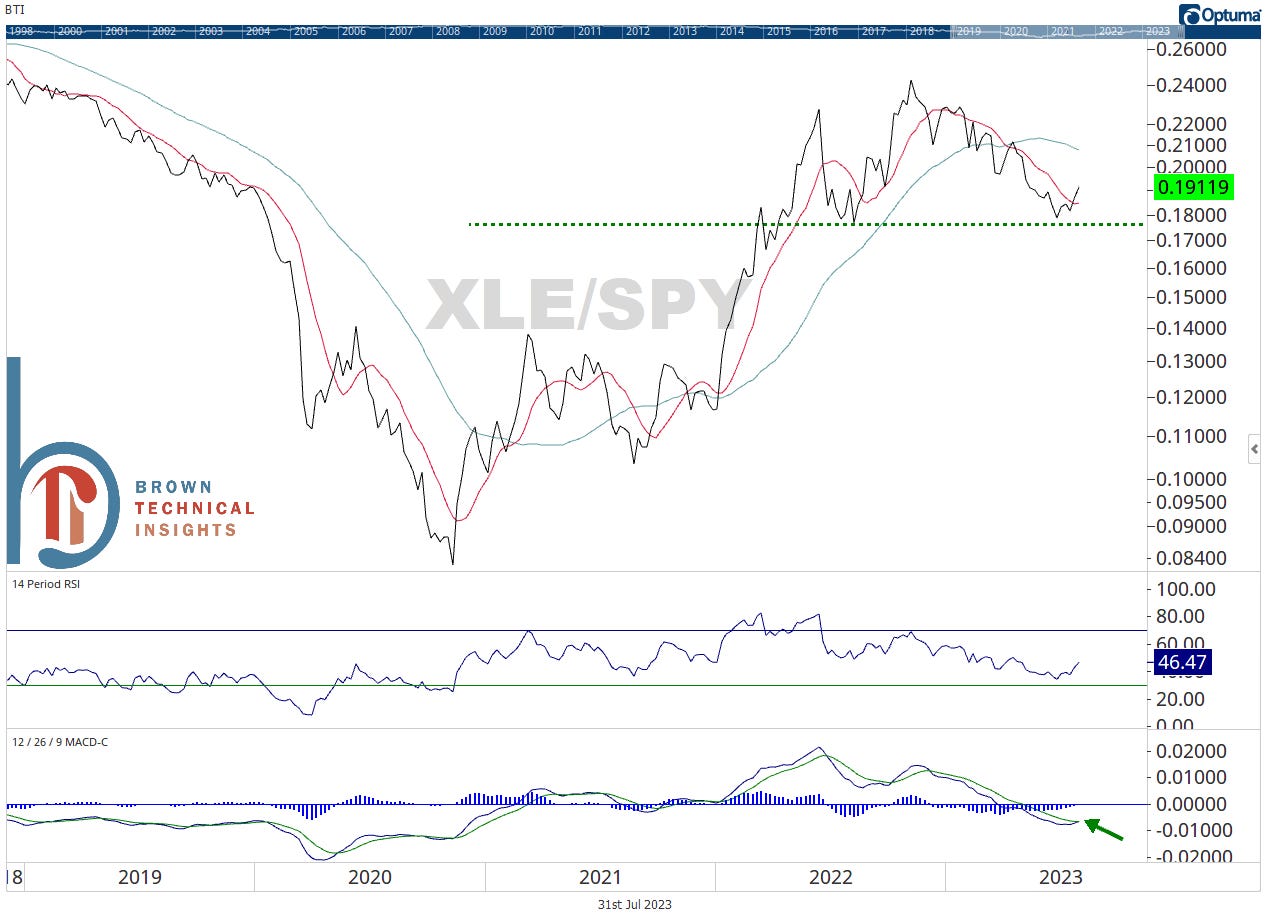
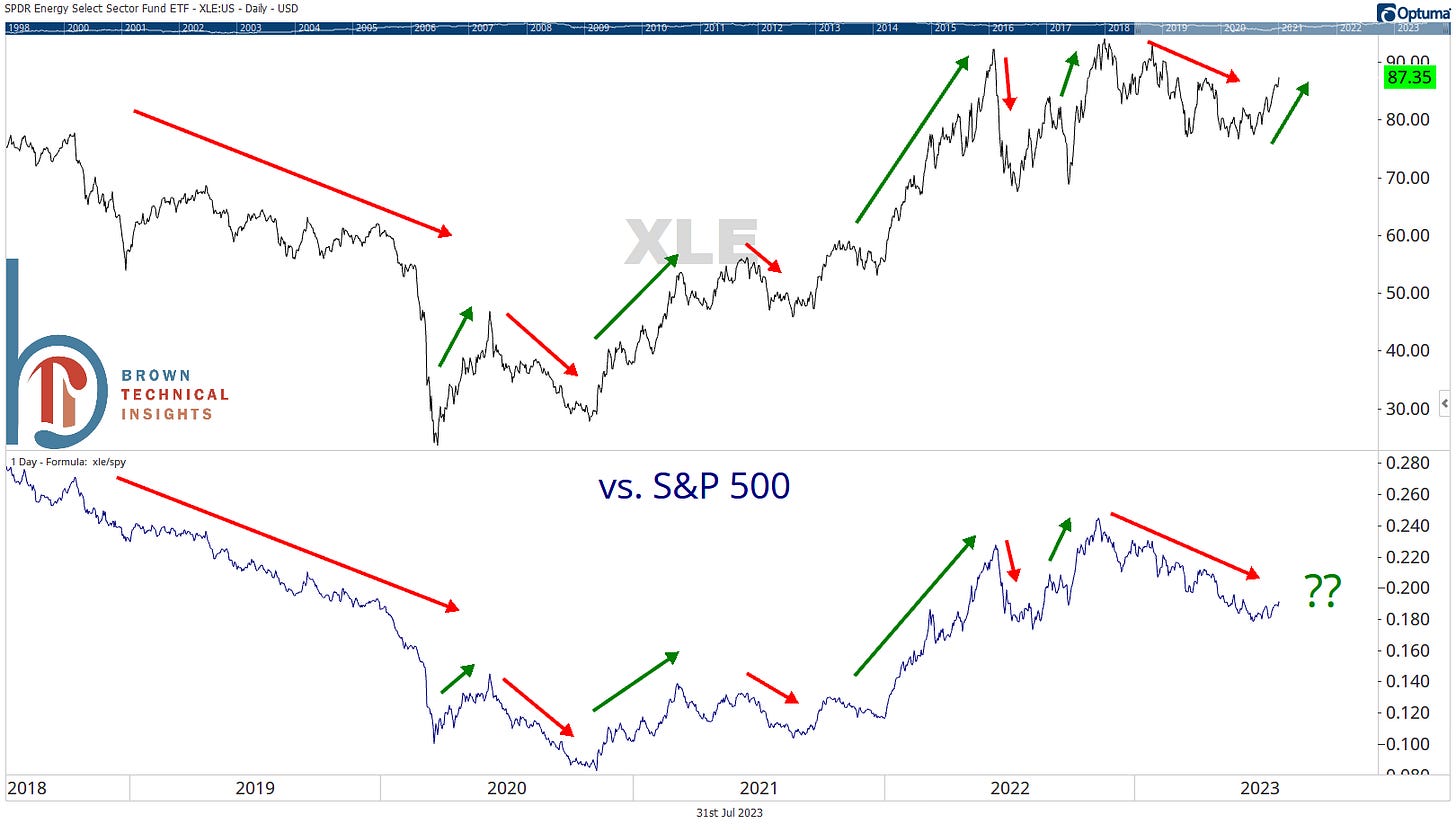
Relative to the S&P 500, the long-term trend of energy is still challenging. However, the ratio has eclipsed its 10-week moving average (equivalent to the 50-day) and the weekly MACD is on the verge of flipping higher as the ratio bounces off support. However, as shown below, the sector’s relative performance is highly driven by its inherent volatility. Simply put, when XLE goes up, it outperforms, when it goes down, it underperforms. If we’re betting on it going higher, expect the relative performance to follow suit.
Small-caps outperforming is bullish
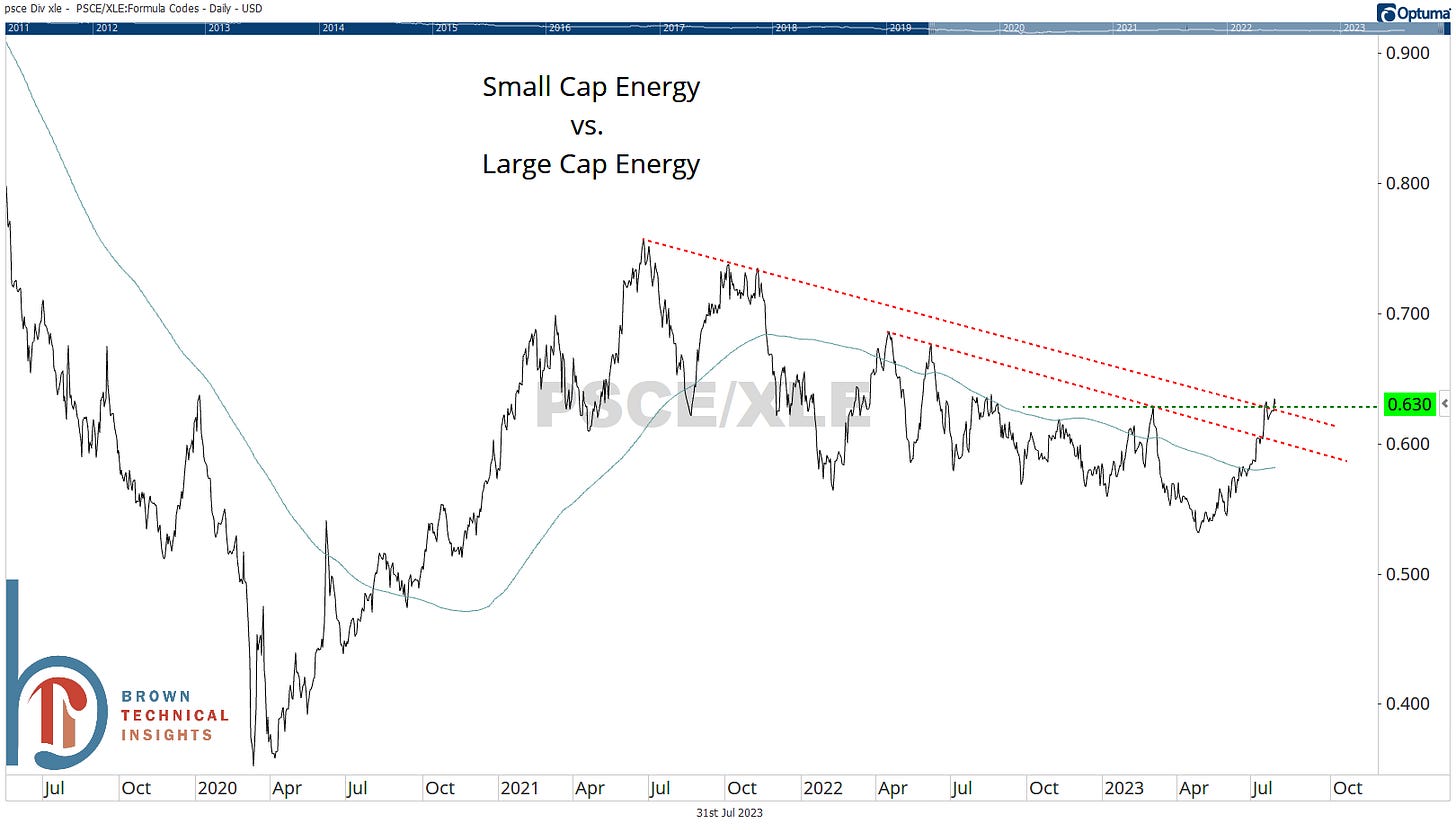
Since energy topped last November, large-caps have been the better relative performer. But we’re now seeing of smalls outperforming like they did during energy’s initial move off the Covid lows. The small-cap energy to large-cap energy ratio has broken all major downtrend lines and now sits at the highest level since last August.
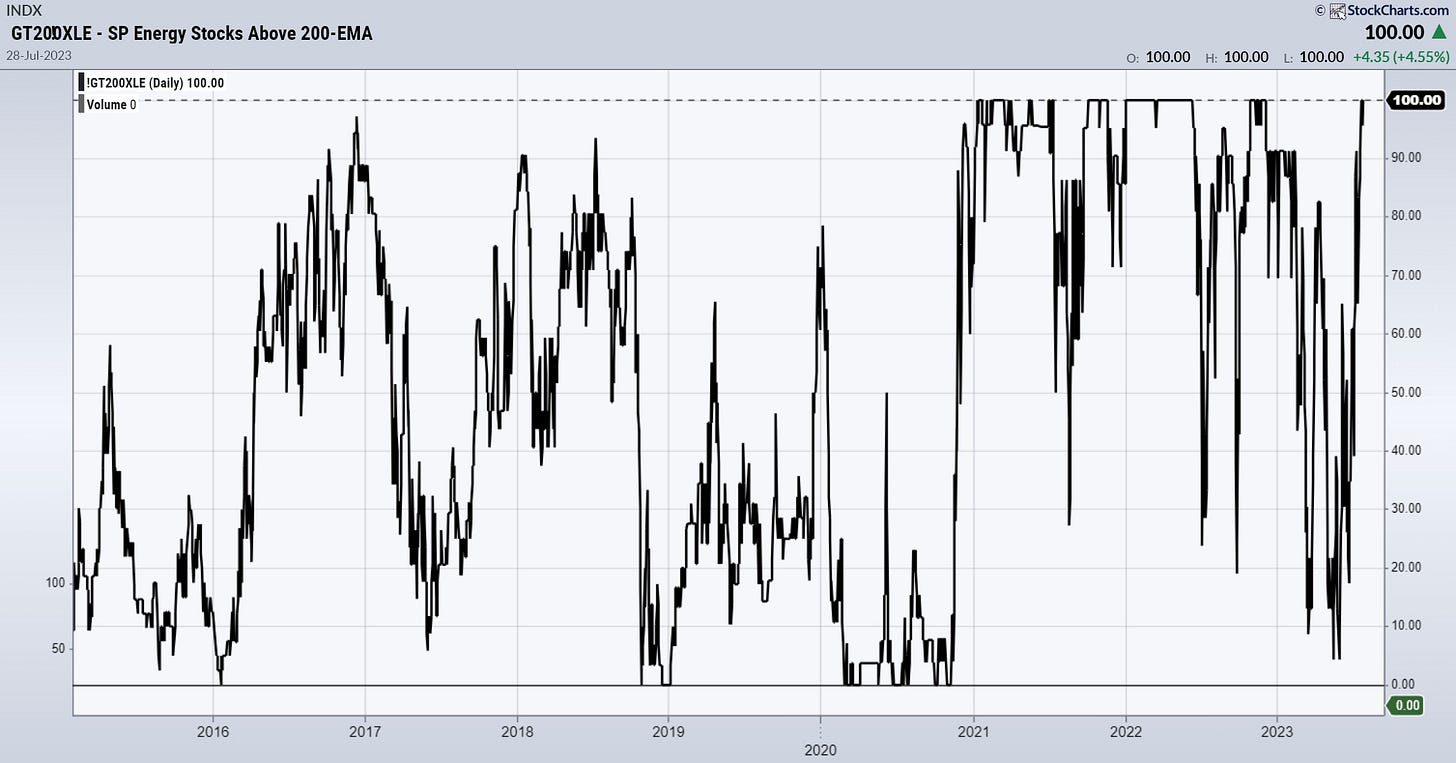
Can’t get better than 100%
100% of stocks in the S&P 500 Energy sector are above their 200-day exponential moving averages. We’ve seen a few of these initial readings over the past few years and they’ve tended to be good signs for the sector’s future strength. Note, how this didn’t occur at all from 2014-2020 as the sector was in a long-term bear market.


