
Overtime
Mailtime


Good morning,
Sometimes you all are heavy on the chart requests but this month you brought some tough questions.
I tried to be concise but I’m not going short-change anybody and want everyone to understand where I’m coming from. Full disclosure, today’s report is looong.
Nevertheless, they were great questions and we also got a diverse set of chart requests.
Thanks to everybody who participated, let’s get into it!
Questions
We seem to be experiencing “Stagflation lite” would you agree? I get it that technology today vs. the 1970’s is not a good analogue: cash flow, earnings and steadily increasing reoccurring revenue. But, what do you think of the asset class returns under a moderate stagflation period and how similar might they be to the 1970s when value outperformed (especially small-caps and energy) and large-growth was one of the weakest?
I wouldn’t call the current environment stagflation because I don’t really see the inflation. Year-over-year headline inflation has been just 2.38% over the trailing 12 months, very much back in the range of what we saw in the 2010s, and that number continues to trend lower 👇
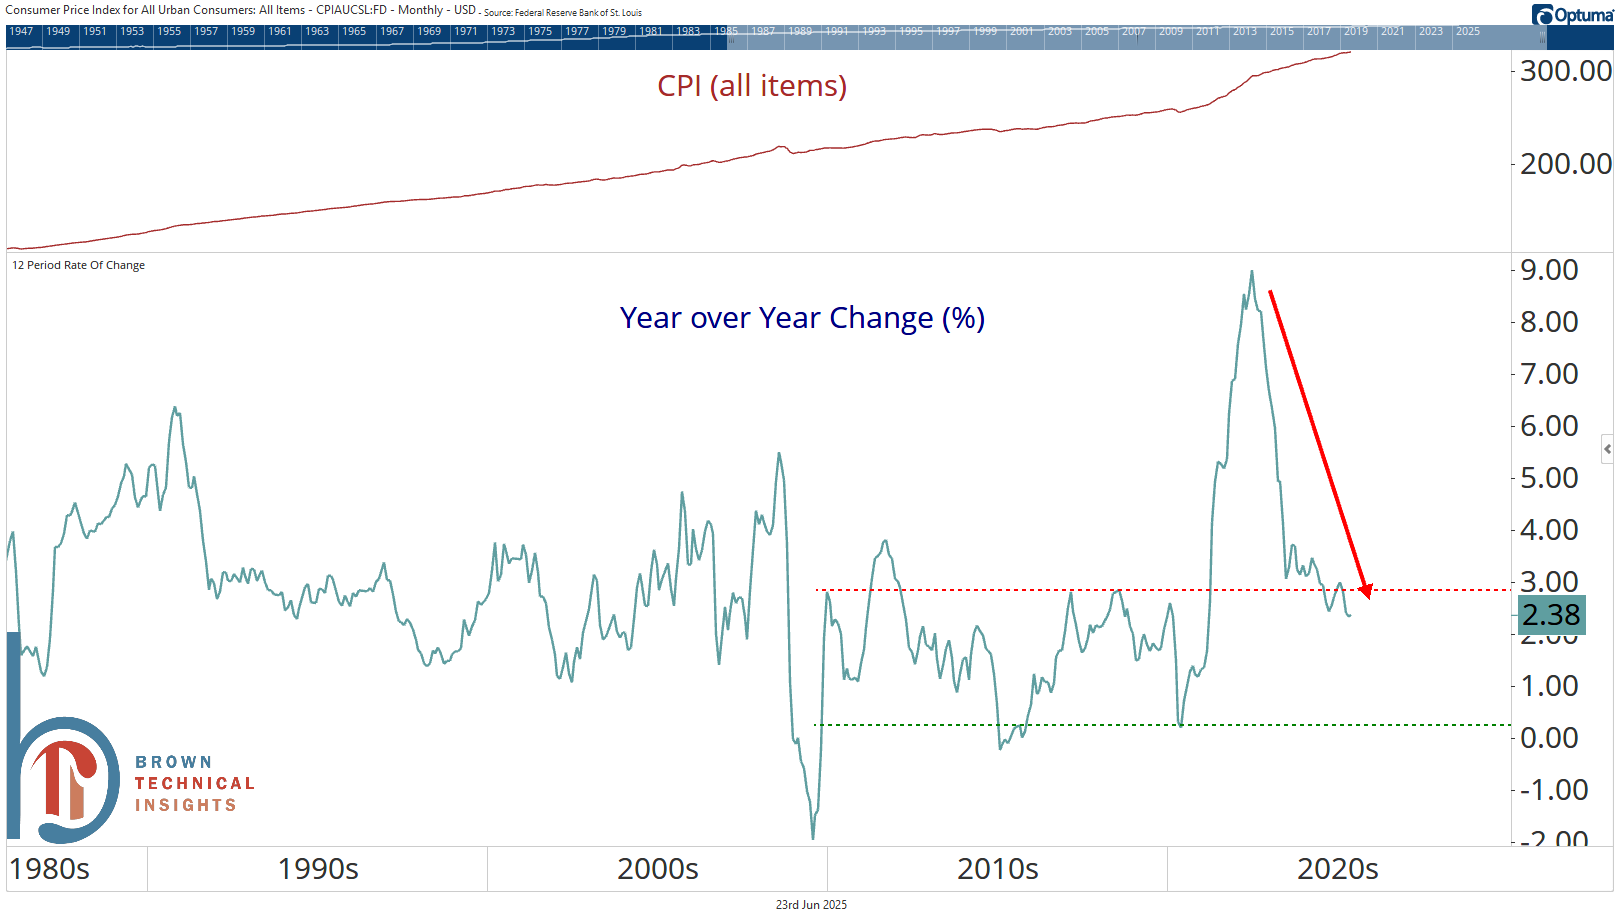
And as we’ve discussed recently, breakevens aren’t pricing in anything different for the future either.
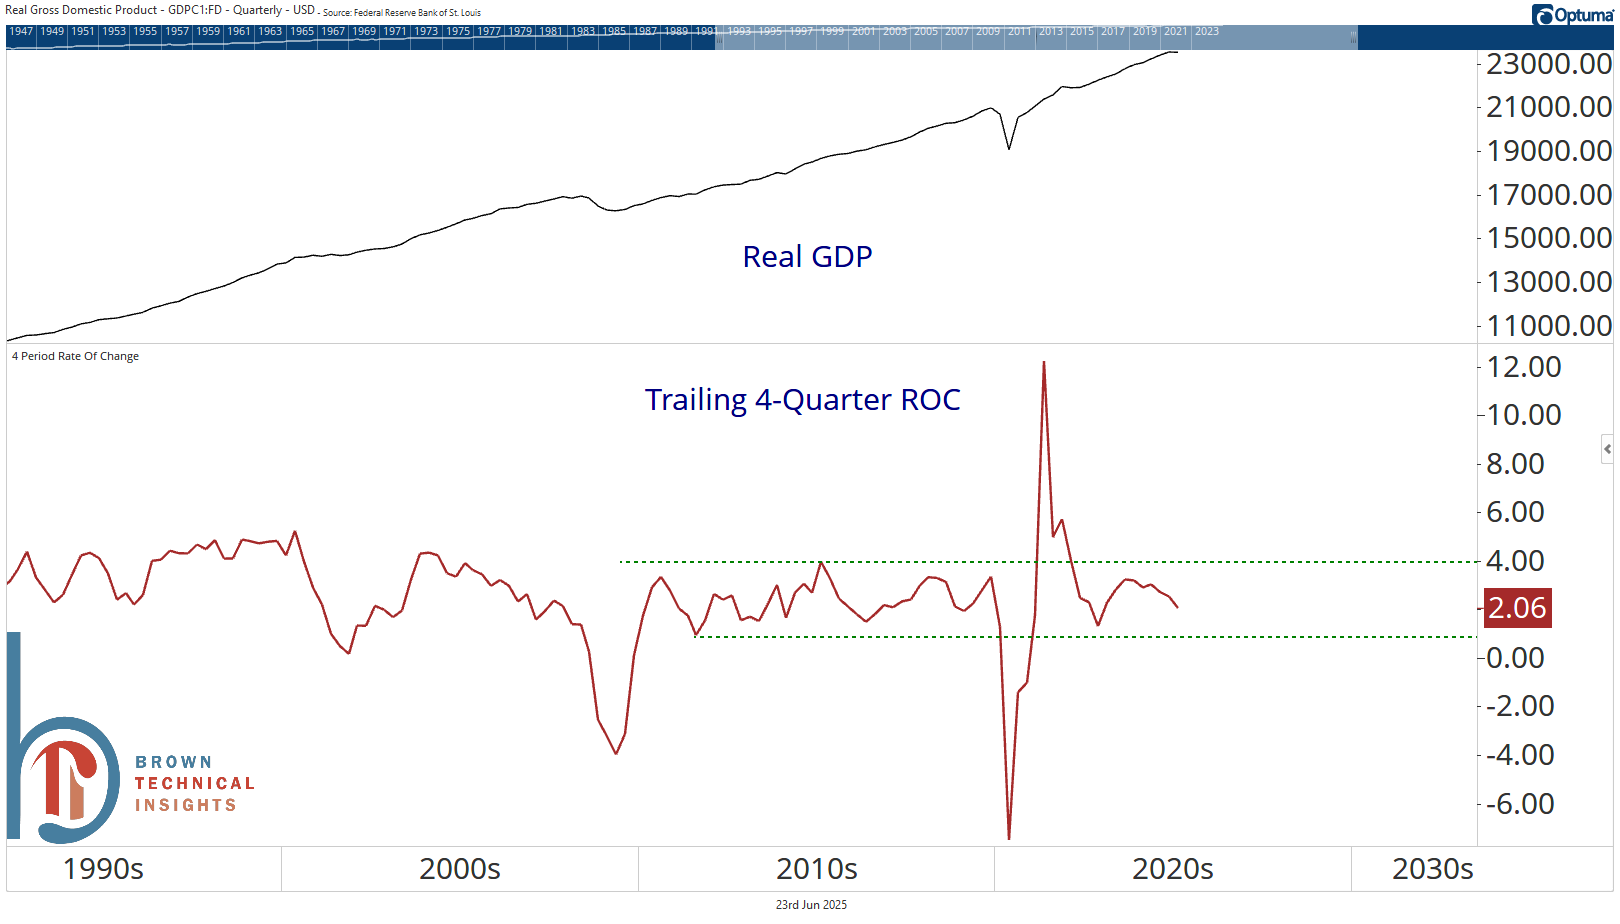
Now growth (+2.1% real over past four quarters) isn’t anything to write home about but looking at the chart, I just see things as right back where we were pre-pandemic, though the trend recently isn’t great.
As for what asset class will work over the next few years, we don’t have to guess or speculate. The simple brilliance of technicals is being able to accept what “is” happening and leaving the speculation to economists and TV pundits. And right now, growth is outperforming value, no matter how you define either.
Maybe that changes, but if we’re back in a slower economic growth environment, the companies that do have growth tend to trade at a premium, so I don’t think it’s a coincidence that the growth/value ratios are trending higher while economic growth has been slowing over the past year.
So far this year, 47% of S&P 500 stocks are outperforming the index. This follows two years (2023 and 2024) that saw less than 30% of stocks outperform the index. How long do you believe this period of broadening out can continue?
I would be careful calling the year-to-date action broadening out. In fact, as of this weekend, just under half (49.9%) of S&P 500 stocks had a positive return YTD. While many stocks didn’t outperform the huge index gains in 2023 and 2024, significantly more stocks were participating and the S&P 500 equal-weight index gained 11% both years, while it is up just 1.9% so far in 2025.
My view is that statistics that cite outperformance vs. the index aren’t breadth, they just tell us about what type of stocks are leading. Thanks to the huge concentration of the top growth stocks at the top of major indexes, if large growth or the Mag 7 are outperforming, most other stocks are underperforming and vice versa. But under/out performance doesn’t tell you about participation, it just tells you about relative strength.
However, to the point made in yesterday’s Playbook, I see more opportunities this year for investors willing to pick individual stocks than investors sitting in the S&P 500.
