
Overtime
Learning from history


Good morning,
This week’s Overtime is taking us back in time.
As I laid out yesterday, the Brown Technical Insights base case is that we’ve seen the worst of the selling in the current drawdown. But historically, that doesn’t mean the index low has been made.
In today’s report, we’ll take a look back at past bear markets and stock market crashes and I’ll highlight what separates bear market rallies from new bull markets.
Let’s get into it.
Just how high can a bear market rally go?
The dot-com bust saw 3 different +20% rallies
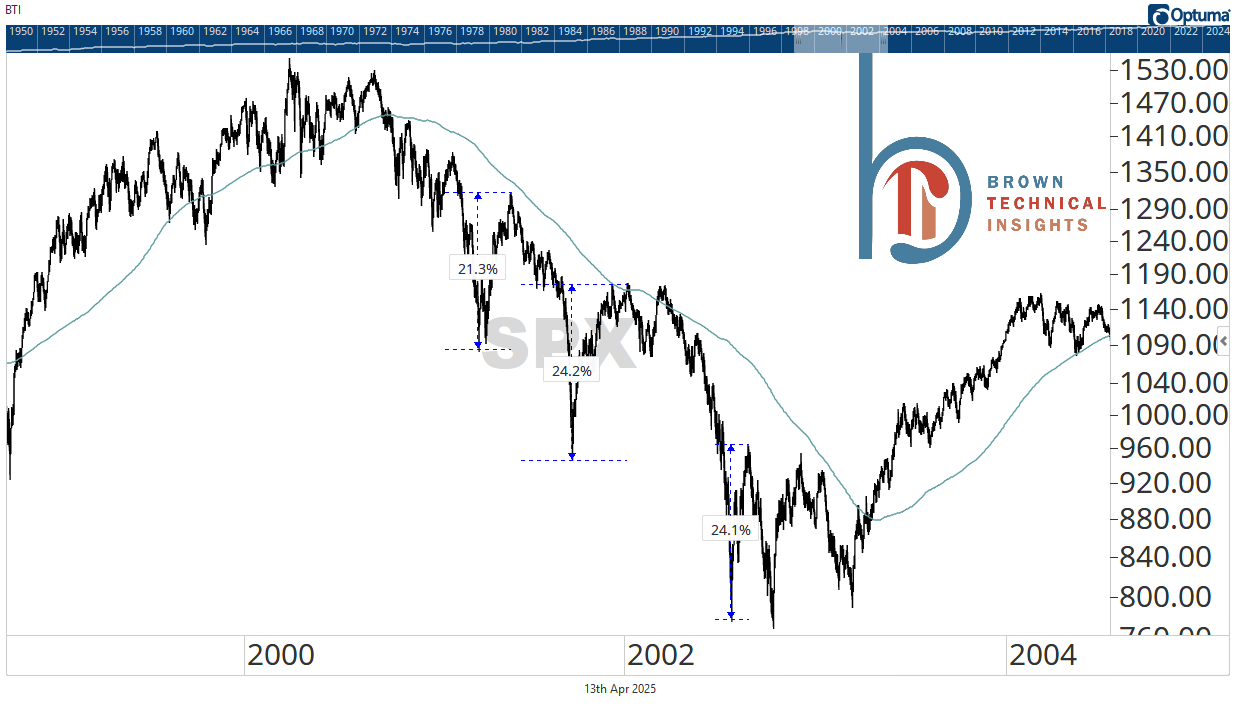
A 26% rally followed the most intense selling in October 2008
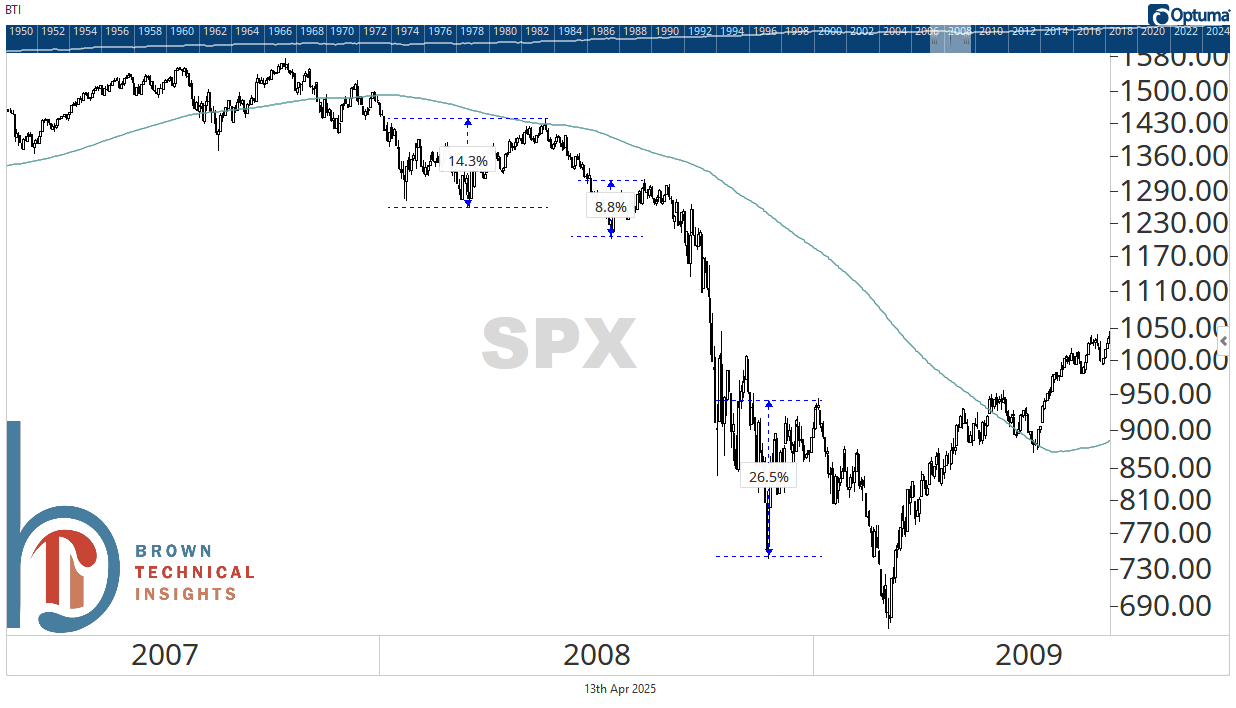
But the index low didn’t come until 6 months later in March 2009.
18% rally after Black Monday before the retest of the lows

19% rally in between the bang and whimper in 2022
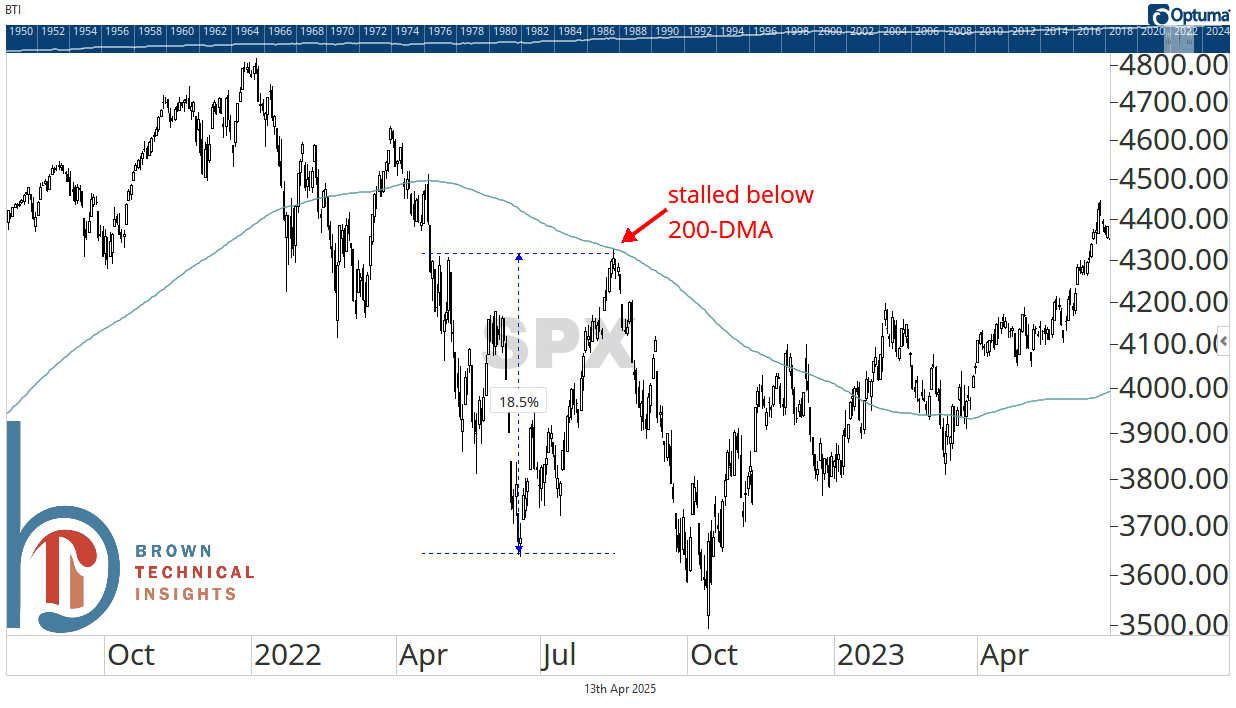
The lesson: Rallies of 10-20% aren’t just possible in bear markets, they’re to be expected. Patience and respect for the trend are top priorities for investors, as the 200-DMA is rarely breached in a bear market rally.
