Overtime
Growth ETFs
Good morning,
The subject of this week’s Overtime is Growth ETFs. In yesterday’s playbook, we talked a lot about the risk at the top of the index, a flashback to a big theme of 2022. However, a lot of the so-called epicenter stocks, those that were up the most in 2020 and down the most in 2021 and 2022 have been getting battered this earnings season.
So, today we’re going to check in on the technicals of some of the most popular growth ETFs, both active and passive, to see where there may be opportunities and where there may be risk of a deeper downturn.
Today’s report will review:
Major growth indexes
The ARK family of funds
Thematic growth ETFs
and industry-focused growth funds
Major growth indexes
Nasdaq 100 pullback coming from position of strength
The ultra-popular QQQ ETF, or Nasdaq 100 has pulled back about 5% since mid-July and broken below its 50-DMA for the first time since March 10. The good news is that the pullback is coming from a position of strength, with still more than 70% of components above their 200-DMA and no deterioration ahead of the peak like we saw in 2021. That means the pullback should be buyable. If there’s bad news, it is that there isn’t super strong support until about $336, about 9% below current levels.
Large Growth pausing at big resistance
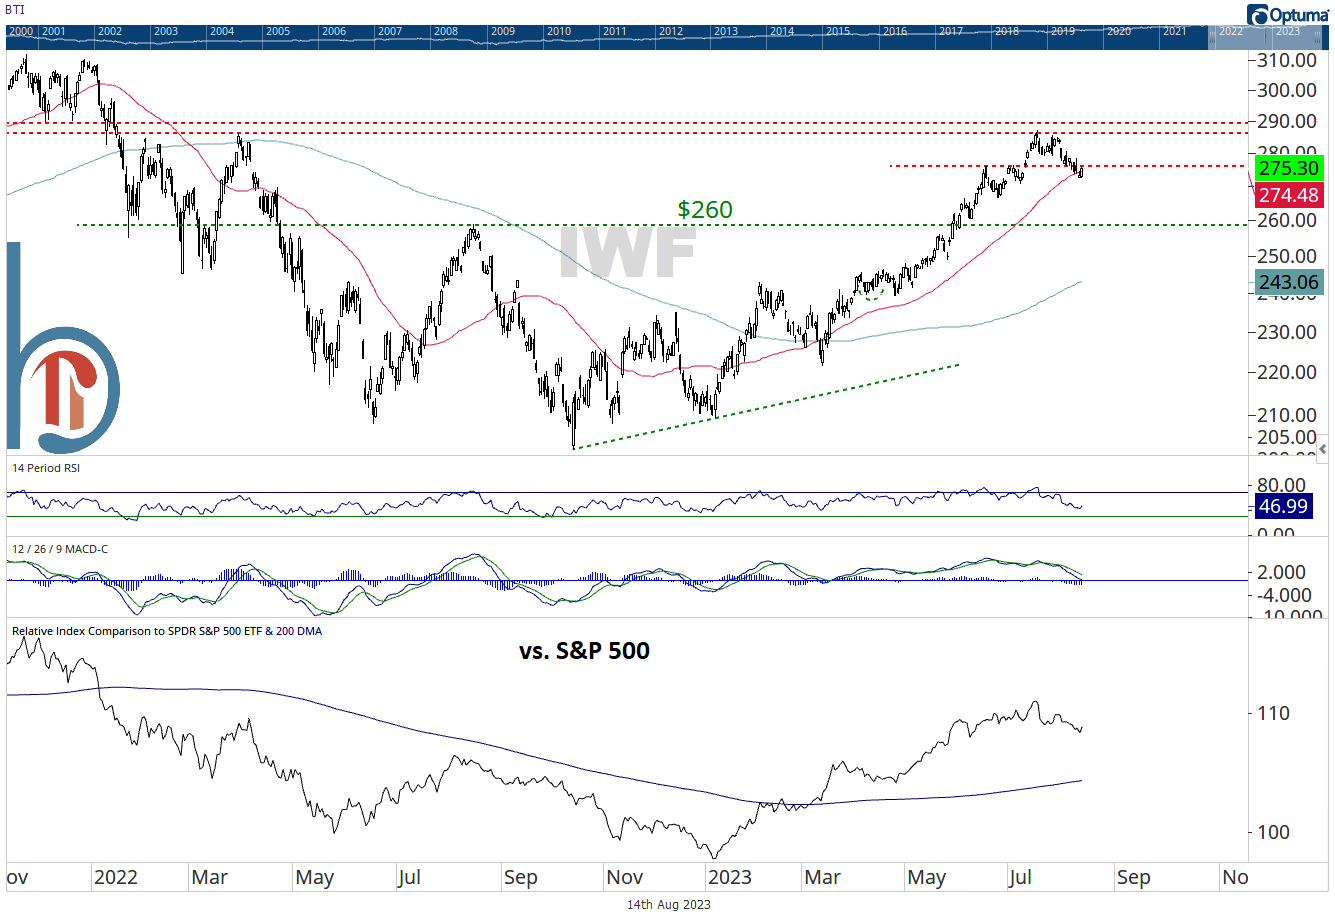
The Russell 1000 Growth ETF of course looks similar to QQQ, but you can see the chart has run into more well-defined resistance near the $290 level. $276 represents hyper-short-term resistance, while $260 is the most critical support level below.
False breakout for small growth?
Prospects for the Russell 2000 Growth ETF looked to have really turned up in early July when the index broke out higher from a year-long triangle formation. However, small growth is now back in that range and hanging on relative support vs. the S&P 500. $229 is key support.


