Overtime
Industrials
Good morning,
This week we’re taking the industrials sector into Overtime. Two of my most important charts for the second half of 2023 were cap-weighted technology and equally-weighted industrials. In the past few months, these two leadership groups broke out but have pulled back below their respective 2021 highs.
As yesterday’s Playbook showed, upside in tech appears to be capped as long as Apple, Microsoft and Nvidia remain below recent highs. But the industrials sector is much more diverse, with no stock accounting for more than 5% of the sector. Not only do we want see what the chance of a bounceback are in absolute terms, but with growth on the sidelines, this sector will be key if cyclical value can keep outperforming vs. defensive value.
This week we’ll look at:
Absolute and relative technicals for XLI
Key industry-level ETFs
Leading and lagging stocks
and more!
Top-down
Sector bouncing above the spring highs
The absolute chart of XLI remains technically constructive. While the sector has pulled back and is trying to recapture its 2021 highs, it held above the $104 breakout level from earlier this year. RSI momentum failed to get oversold (a good sign) and the daily MACD is on the verge of flipping positive. Longer-term, this base measures to about $131/share.
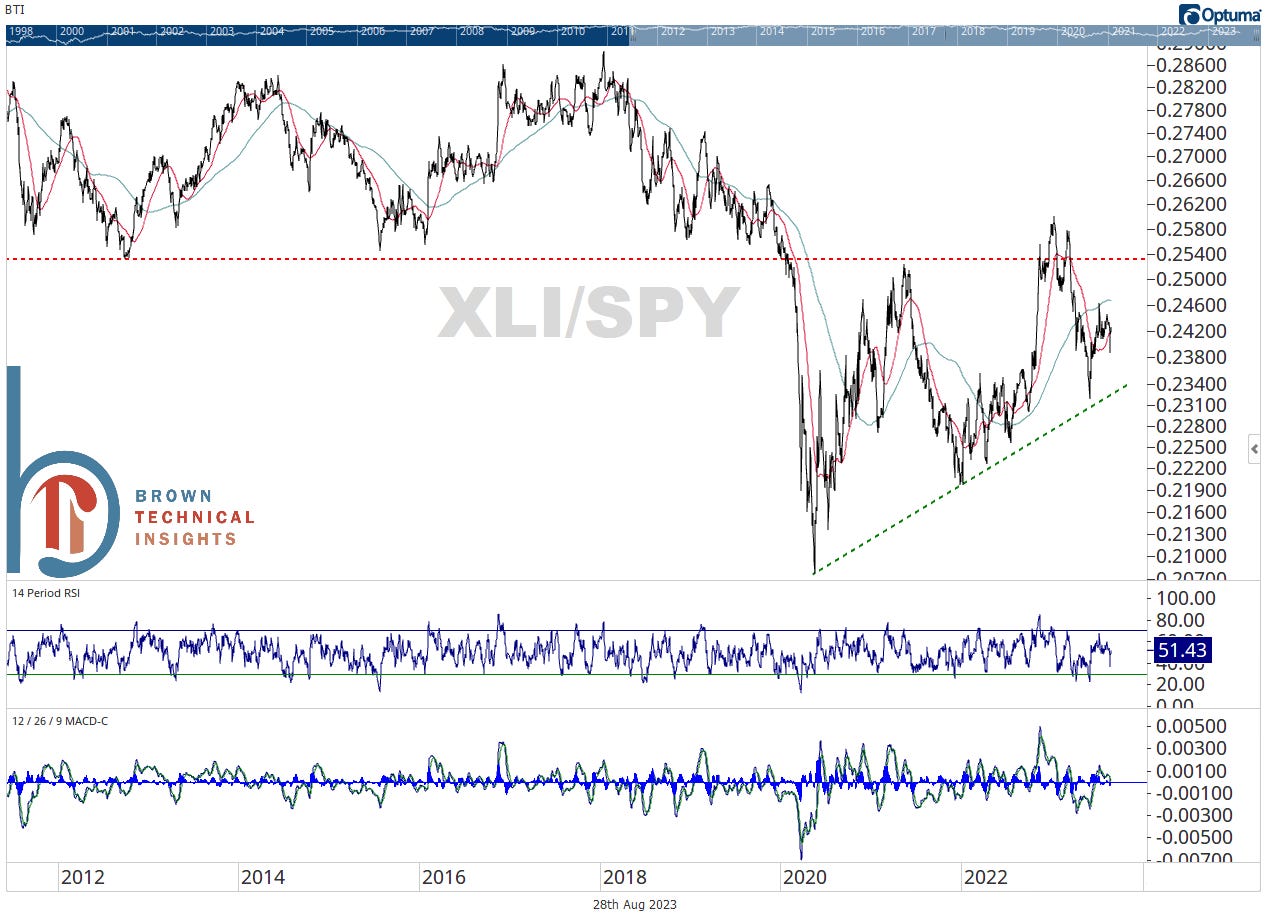
XLI vs. SPX
Industrials have outperformed the broad S&P 500 going back to the pandemic bottom, but on a cap-weighted basis struggled to keep up with the tech-led rally during the first half of this year. The sector has outperformed by 460 basis points since the beginning of June, roughly when tech’s leadership peaked.
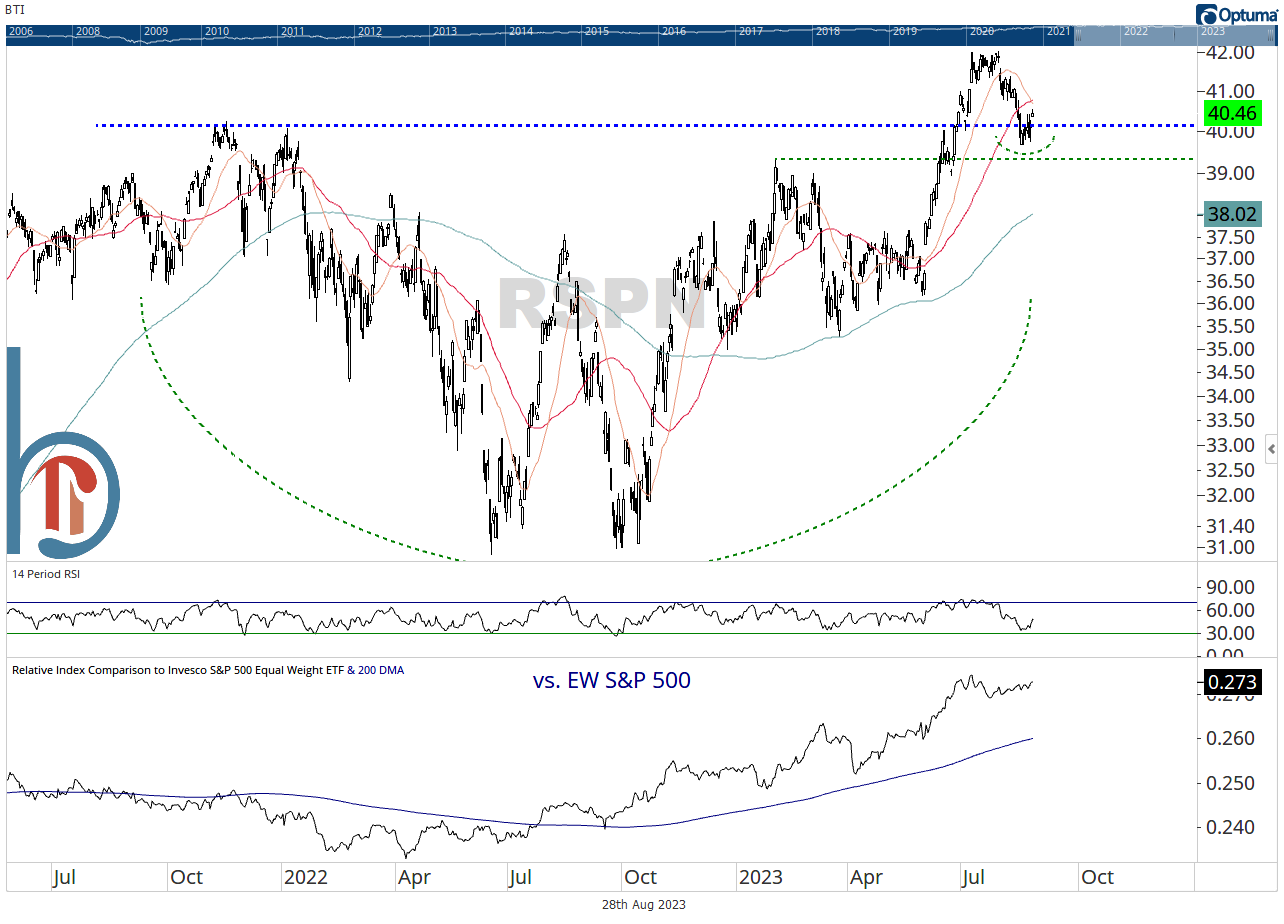
Equal-weight industrials back above the 2021 highs
As I mentioned in the intro, industrials are a very evenly distributed group, so it shouldn’t come as a surprise that the equal-weight ETF chart looks remarkably similar to XLI. But what stands out here is the relative chart, where as soon as you negate the impact of mega-cap tech, the leadership becomes very clear.
Small-cap industrials leading within small caps
It’s the exact same story in small-cap industrials. Trying to push out of a base, but overwhelming leadership vs. the rest of small caps. These last two charts really tell you there is a strong fundamental base to the industrials story and it certainly isn’t because of the leadership of one or two stocks.


