
Overtime
The Big Picture


Good morning,
Amid the market’s recent volatility, we’ve been zooming in more than normal. 15-minute candles on the S&P 500, key tactical levels on sector SPDR ETFs, things like that.
But, the strong bounce-back we’ve seen in equities is also an important reminder of the big picture: It’s a secular bull market.
So today we’re zooming way out and looking at major indexes, rates, commodities, and more from a long-term perspective.
Markets will zig and zag but no matter your time horizon, the probability of success is always higher when you’re trading with the primary trend.
Equities
It’s a secular bull market

The most important chart in today’s deck. If the 200-week moving average isn’t being breached, we’re in a secular bull market. And we’re currently 29% above it.
The Nasdaq 100 just retested its 2021 highs

And sorry bears. +32% in the past year is nothing out of the ordinary for QQQ.
Getting back above $209 was a big deal for IWM

But small-caps remain a disaster vs. large.
Homebuilders keep making new highs

Semiconductors riding a 2-year uptrend channel
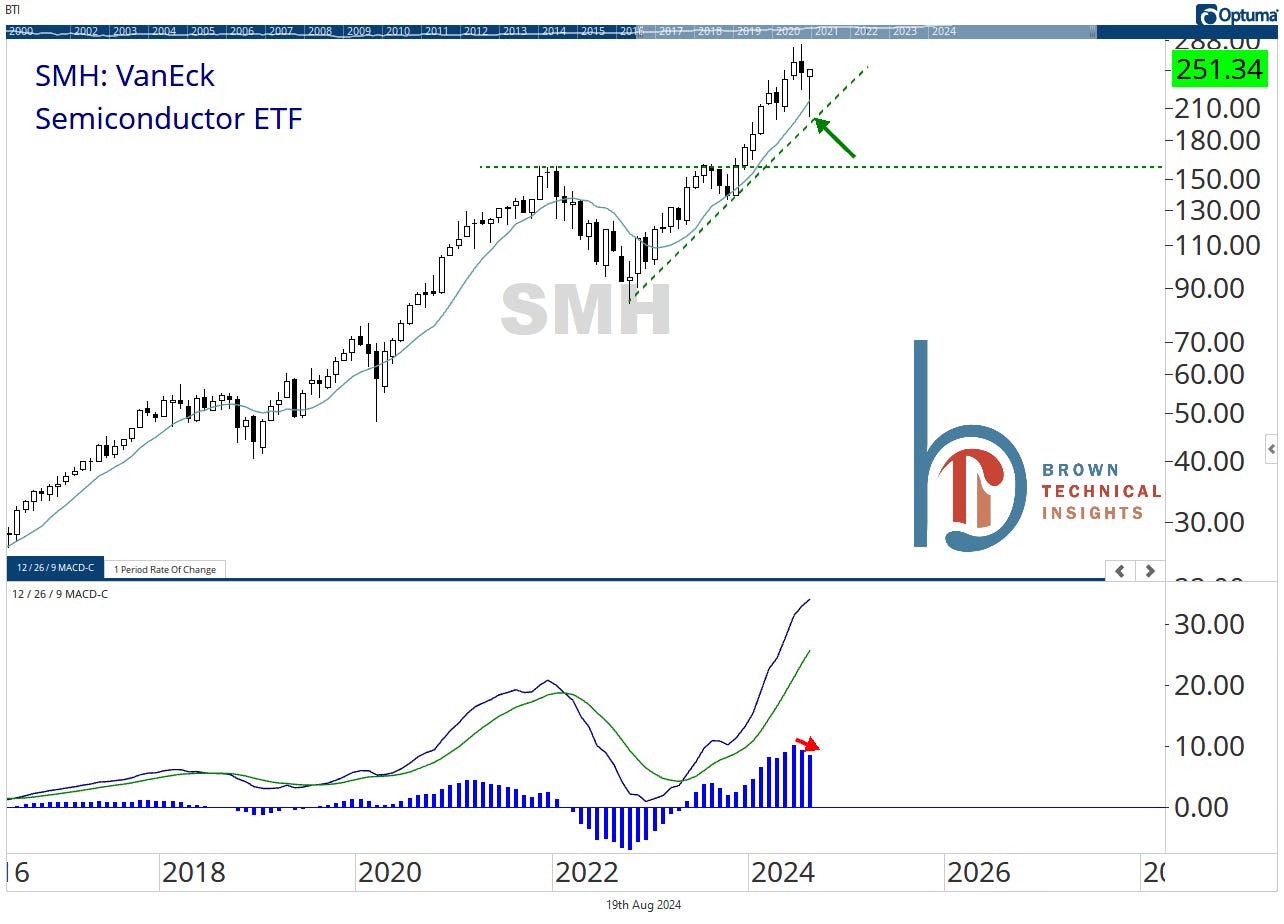
Some signs of slowing long-term momentum bear watching but no reason to jump off the train until that uptrend line is broken. Looking like another successful test this month.
Software is a huge base

Low vol stocks on the verge of ending a 3-year bear market

Energy continues to struggle at previous cycle highs

Textbook breakout, retest and go for the healthcare sector

Financials held their breakout despite the early-August correction

Inverse head and shoulders breakout for real estate

What? You think real estate has topped forever? This is going to make new all-time highs, the only question is how long it takes.
Materials have been dead money for 5 months

But this isn’t a bad chart.
This is an index of all the worst-performing stocks

Even it looks like it wants to break out higher.
