
Overtime
The State of the Markets


Good morning,
As long-term readers know, there will never be an outlook from Brown Technical Insights.
We’re here to make money, and guessing what will happen in the next 12-14 months is no way to do that.
The epiphany that drove me headfirst into technical analysis more than a decade ago was that focusing on what “is” happening was a lot more valuable than pontificating or analyzing what “might” happen.
That’s what we’re going to do today. A big-picture look at the state of the markets and what is happening, along with some of the most important thematic charts for 2026.
We’ll review:
Major US indexes
All 11 equity sectors
Foreign stocks
Fixed income
Commodities
and more!
Major US indexes
S&P 500 on track for its sixth gain of +15% in 7 years
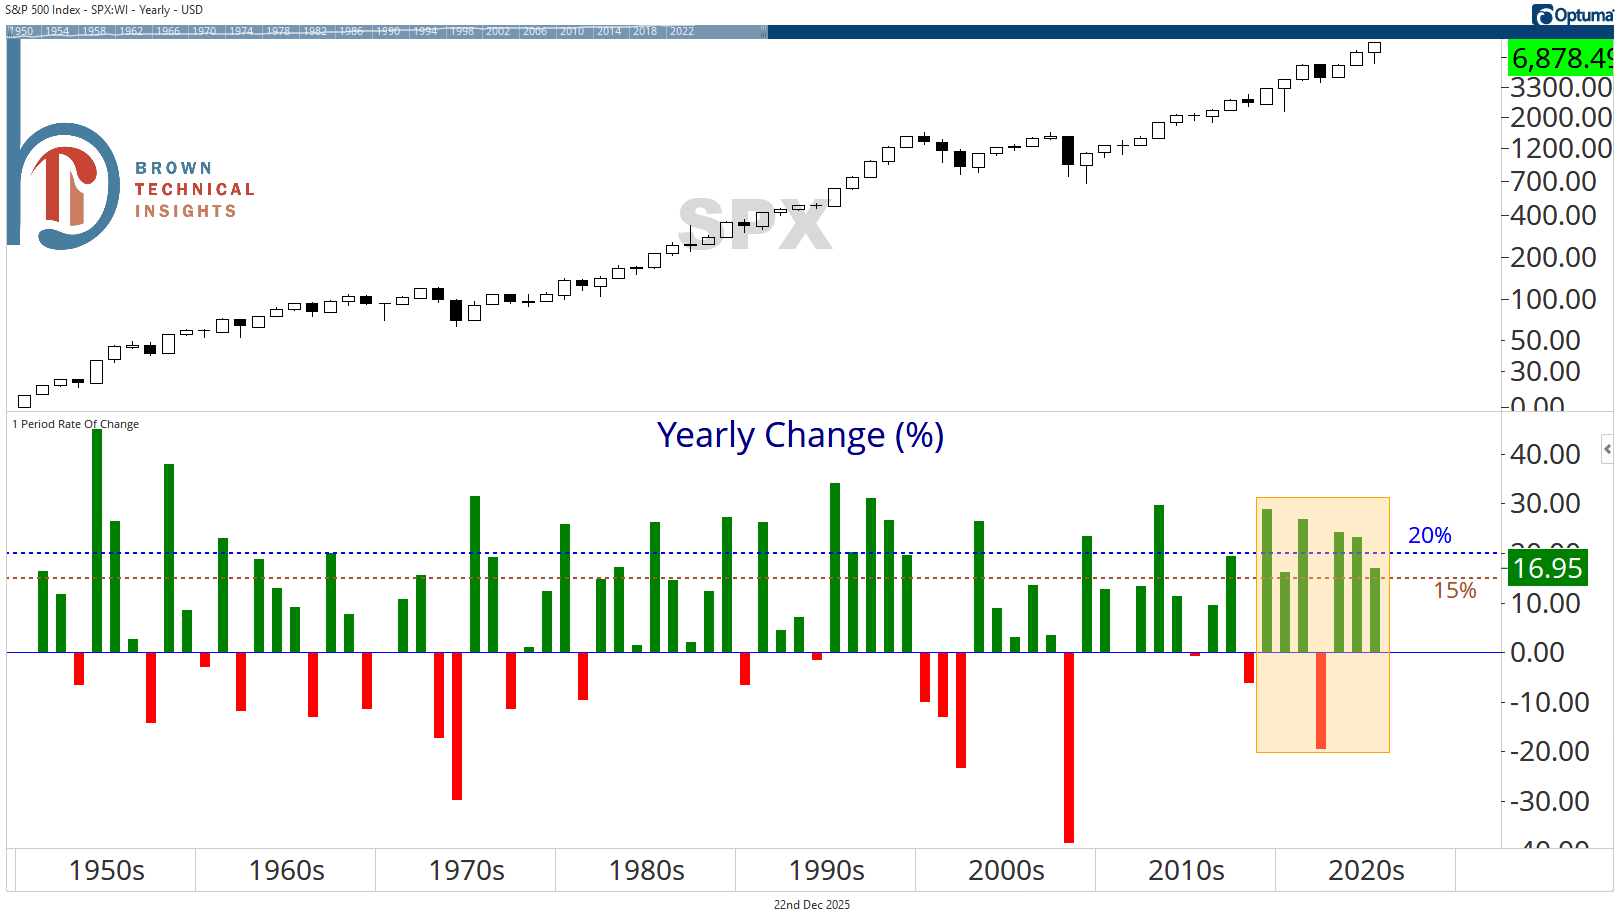
And third consecutive. And it may be a tall task, but with six trading days to go in 2025, the index is within striking distance of a third consecutive 20% annual gain (currently up 16.95%). That hasn’t happened since we went four straight in the 1990s.
The index has spent the final three months of 2025 in a 400-point trading range
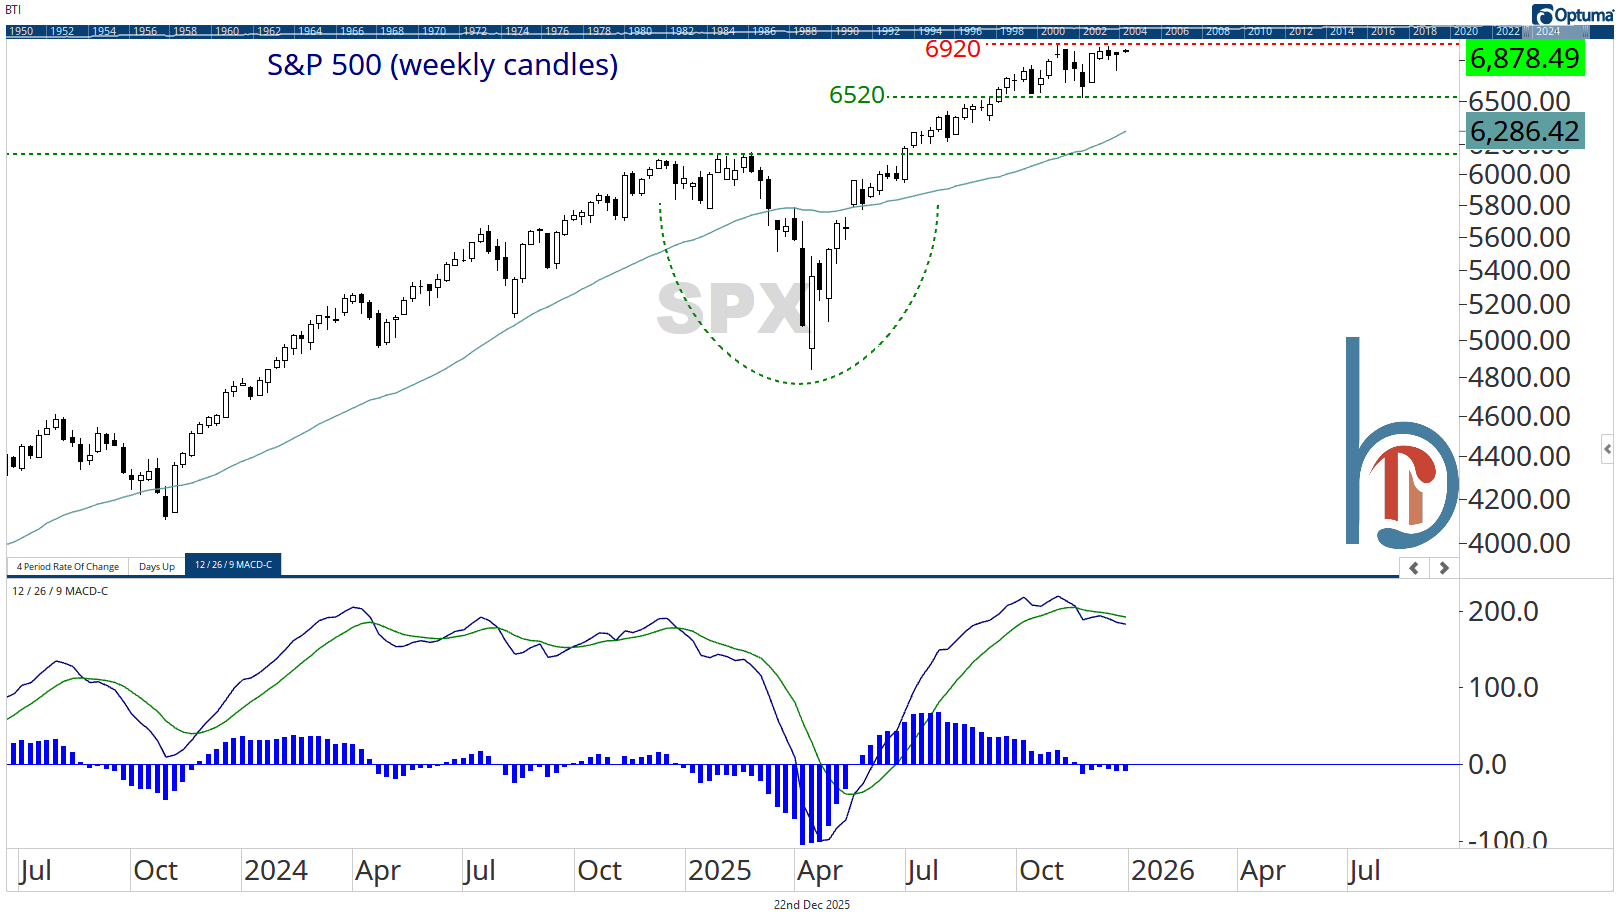
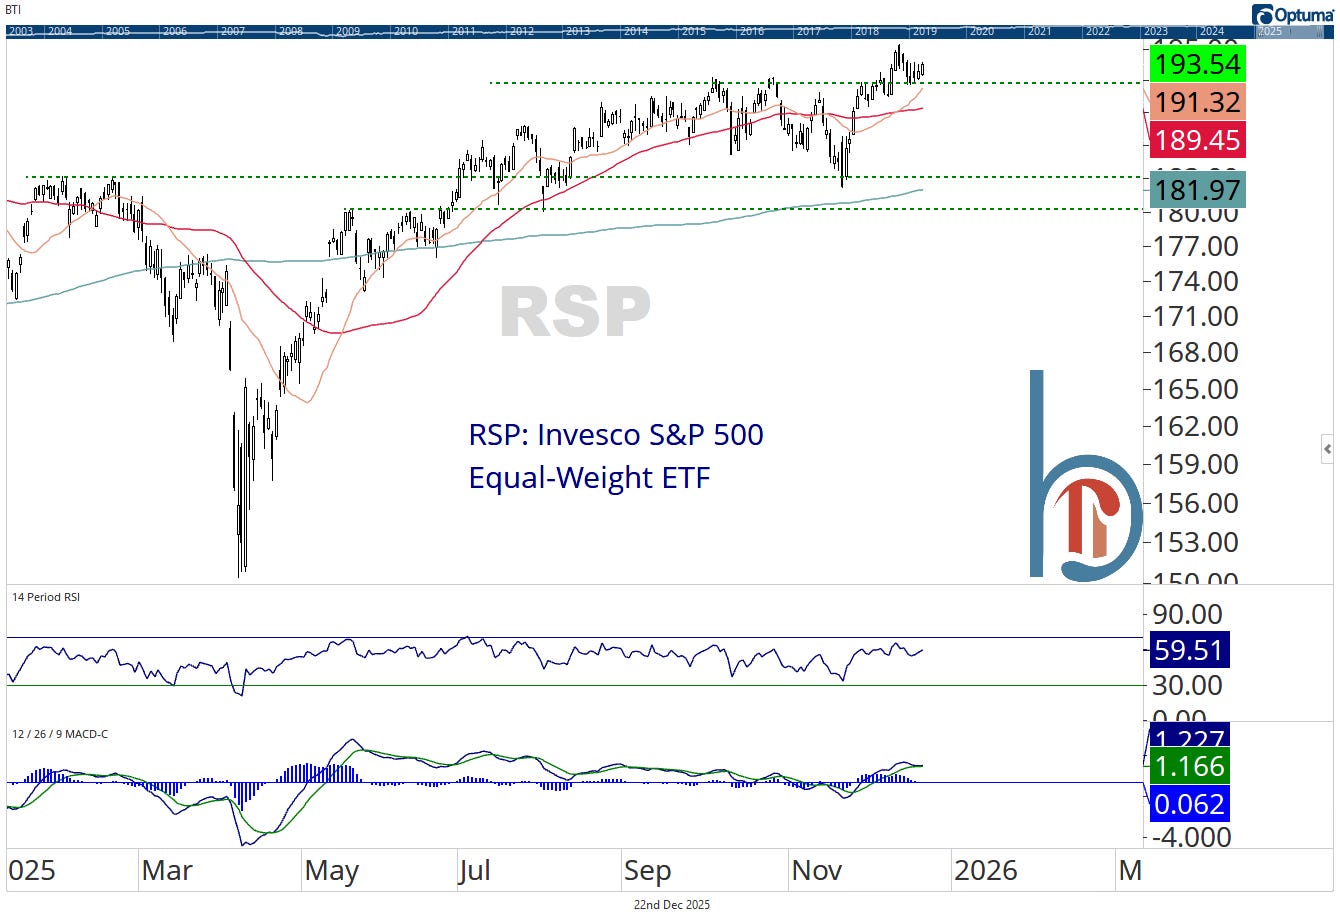
7320 is the measured objective if we get a breakout. And that’s the expectation because the equal-weight index has already made new highs.
The S&P 500 is starting to get extended from its long-term moving average
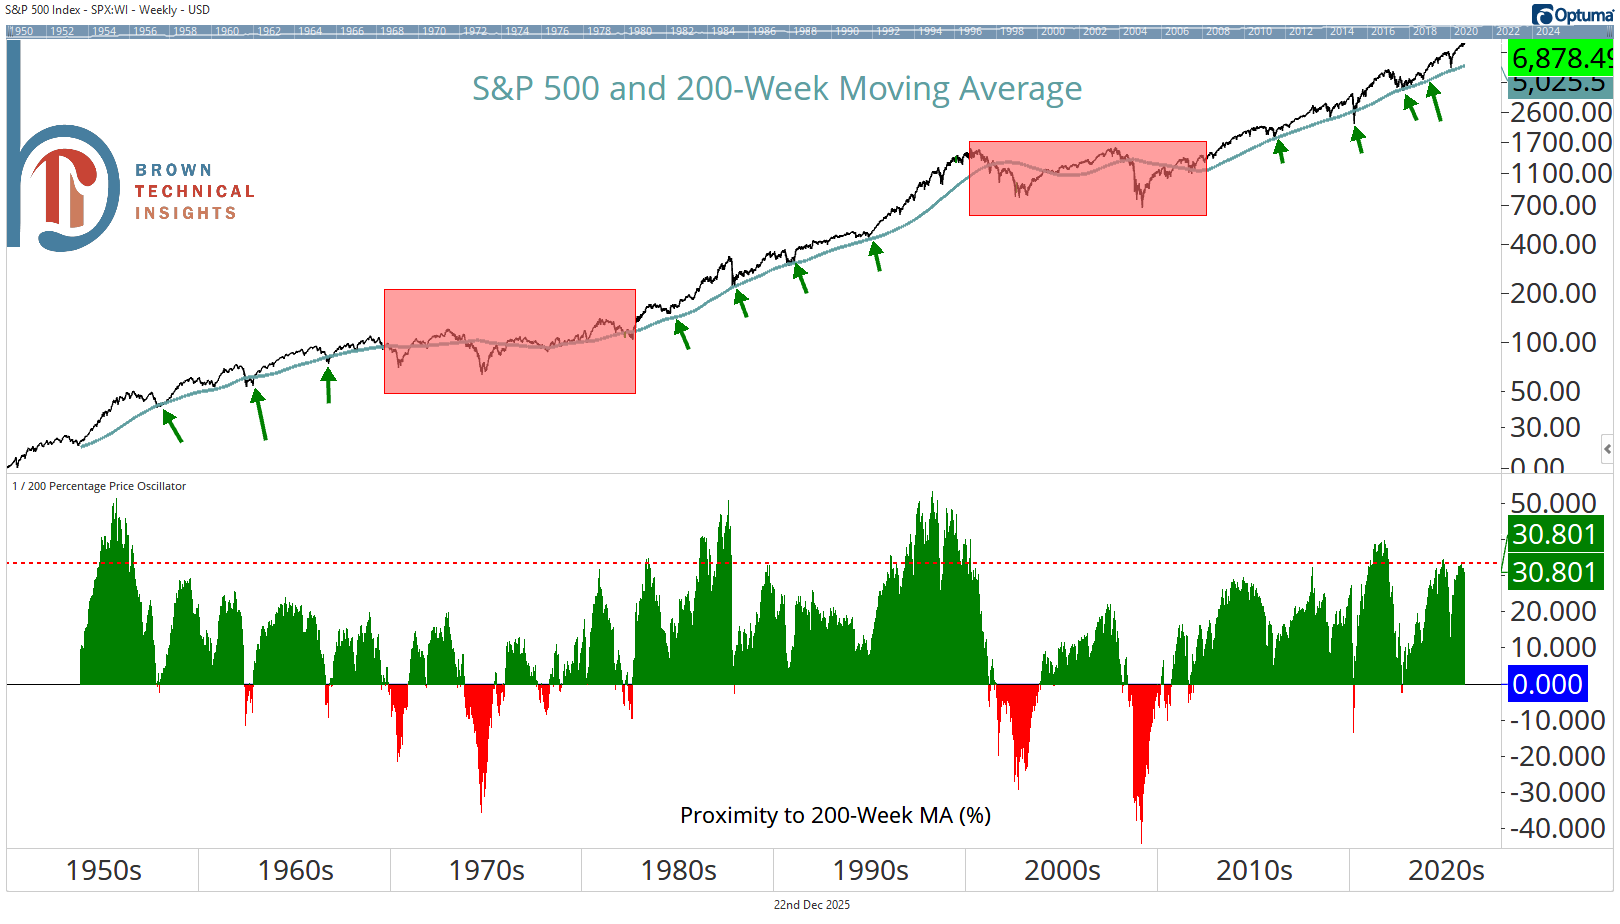
The 200-week moving average has a storied history of separating secular bull markets from secular bear markets. At 30% above, we’re clearly in a secular bull market. However, it should be noted that we’ve rarely gone further above this average, and when we have, big losses have followed. The last three times? Late 2021, the late ‘90s, and 1987. This is not a sell signal, but it does suggest the rubber band is getting stretched.
