
Overtime
Mailtime


Good morning,
Well, everybody sure got their Mailtime reminder yesterday.
I normally send those out on Friday, but clearly, Monday morning is the time to send for a big response. I think this is the largest amount of chart requests we’ve ever gotten (plus a few good questions), so the comments will be brief, but I think I got to almost all of them.
It’s a longer report than normal, so of course, skim only what you are interested in, and let’s see what your fellow readers had for me!
Questions
How do you determine when to hold a stock with a strong primary trend that has pulled back into support versus taking profits in a stock that has run well and pulled back without breaking support?
I’m going to start with the baseline assumption that in any uptrend, a pullback into support is a stock we want to hold. However, there are two exceptions where I might consider pulling the trigger and taking a profit.
The first is a breakdown in relative strength. Relative strength leads, and if that has deteriorated, I might be more likely to either just cut a lagging stock, or, combined with other indicators, have a reason to think support won’t hold.
The second instance would be based on the environment. Stocks and groups move together, and if I have some speculative software stock that has pulled back, but all the other speculative software stocks are pulling back, breaking support, and rolling over, odds are mine won’t be special. So, the macro or big-picture view can override what might normally be a bullish view if looking only at the chart.
What are your thoughts on diversification in today’s world, where so many index funds have become heavily concentrated? The top 10 holdings are now heavily tied to the AI trade/bet. If NVDA starts to slow down, it could have a devastating impact.
Okay, this is a valid question and a real concern for a lot of people. But I’m going to give my frank and somewhat contrarian view.
Who cares?
The thing I learned a long time ago is that end clients only care about the S&P 500. They don’t care about the risk. The don’t know what Germany returned last year, or care that you were “diversified” while you underperformed the benchmark by 10%.
So, my philosophy managing money and our ETF models is to run a long/short strategy relative to the S&P 500. If the AI trade is working, I want to be overweight the semiconductors, and utilities, and industrials, and so on. And if and when the AI trade inevitably underperforms, then I’ll want to be underweight those groups based on the relative strength charts.
This is my personal view and it’s not that I don’t believe benchmark-agnostic or “go anywhere” strategies don’t have value or can’t work. But, in my experience, any strategy like that will inevitably have such tracking error and periods of severe underperformance that end clients (and yes, even advisors) won’t stick with it.
Two additional points on this topic:
Fellow Substacker Sam Ro has written about how the Mag 7 are more like the Magnificent 70 when you look at all the underlying companies within those stocks.
Many other countries have even more concentration risk. Just go look at some of the country-specific ETFs from iShares. Tencent is 18% of the China ETF. Taiwan Semi is 24% of EWT. Samsung is 24% of South Korea’s ETF. SAP is 15% of Germany, followed by Siemens which is 10%. You get the idea.
Chart Requests
ALL: Allstate
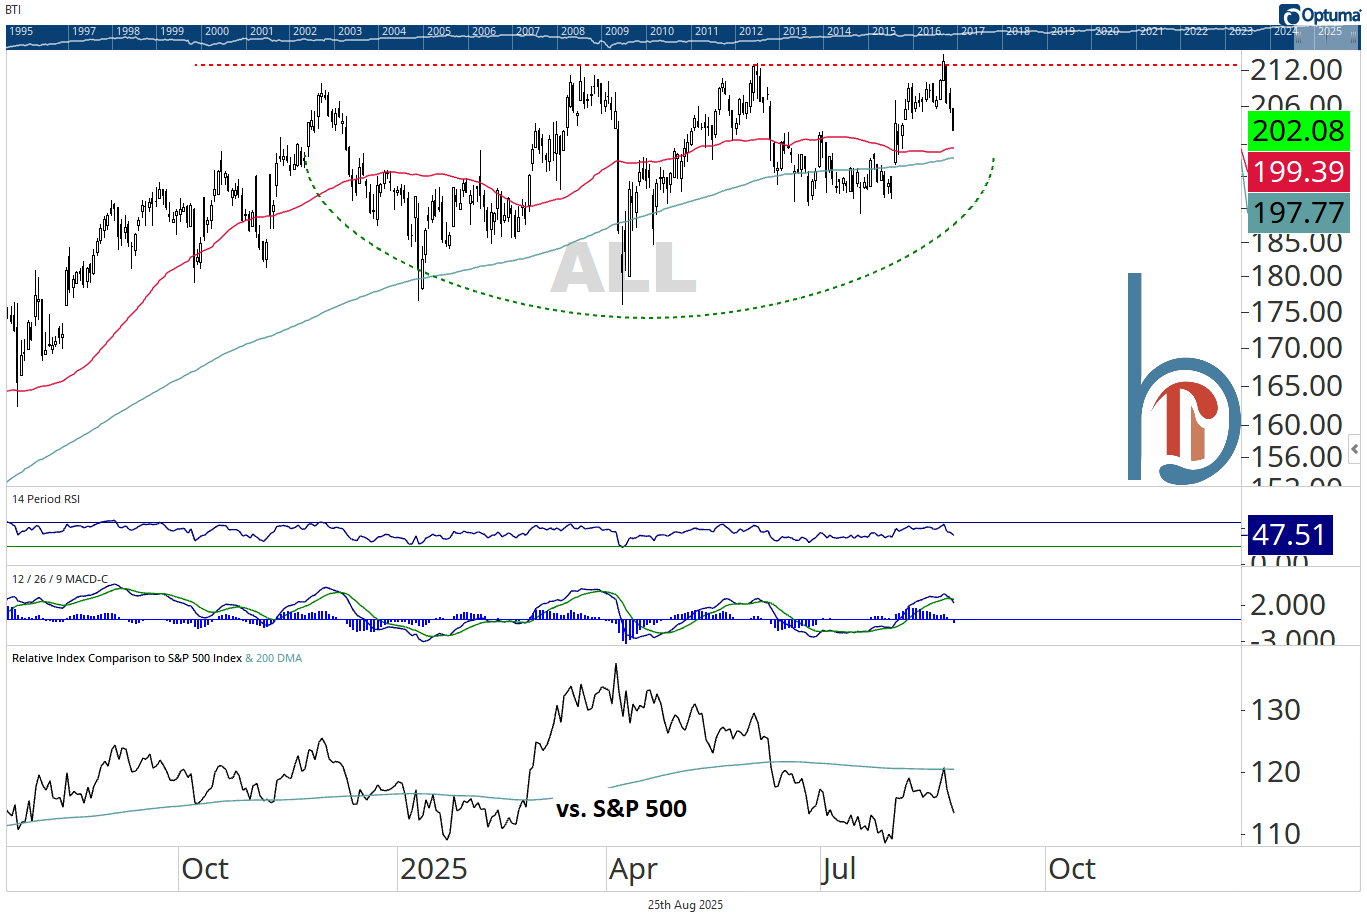
Allstate has big base potential but the stock is down sharply four days in a row after another rejection at resistance. Needs to see short-term stabilization and keep the 50-day above the 200-DMA before it’s a buying opportunity.
AMD: Advanced Micro Devices
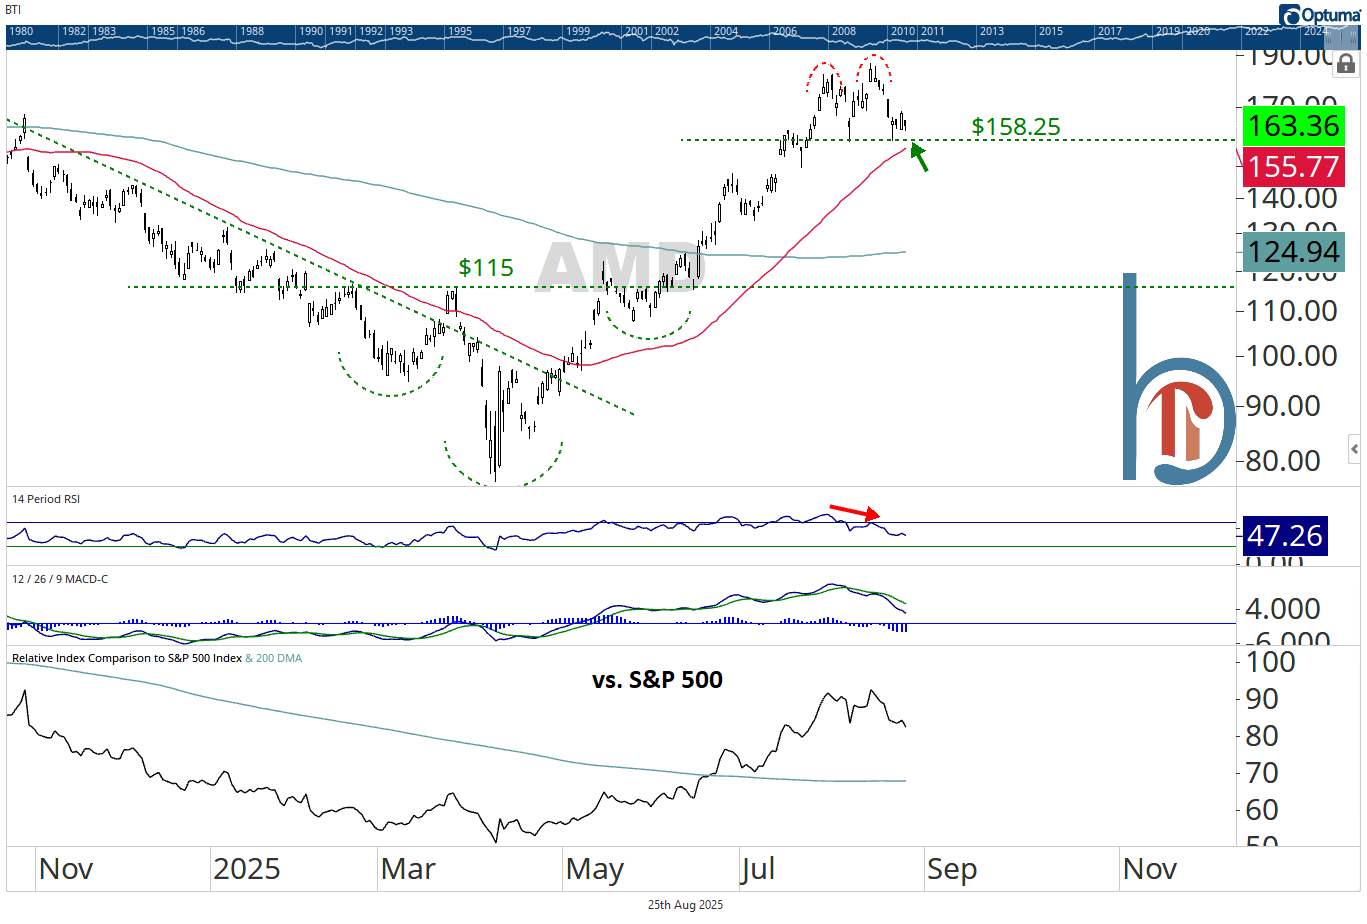
$158.25 is the key level for AMD. Hold above, and this is a buyable consolidation in an uptrend. But a break completes a double-top that targets $130.
AMZN: Amazon
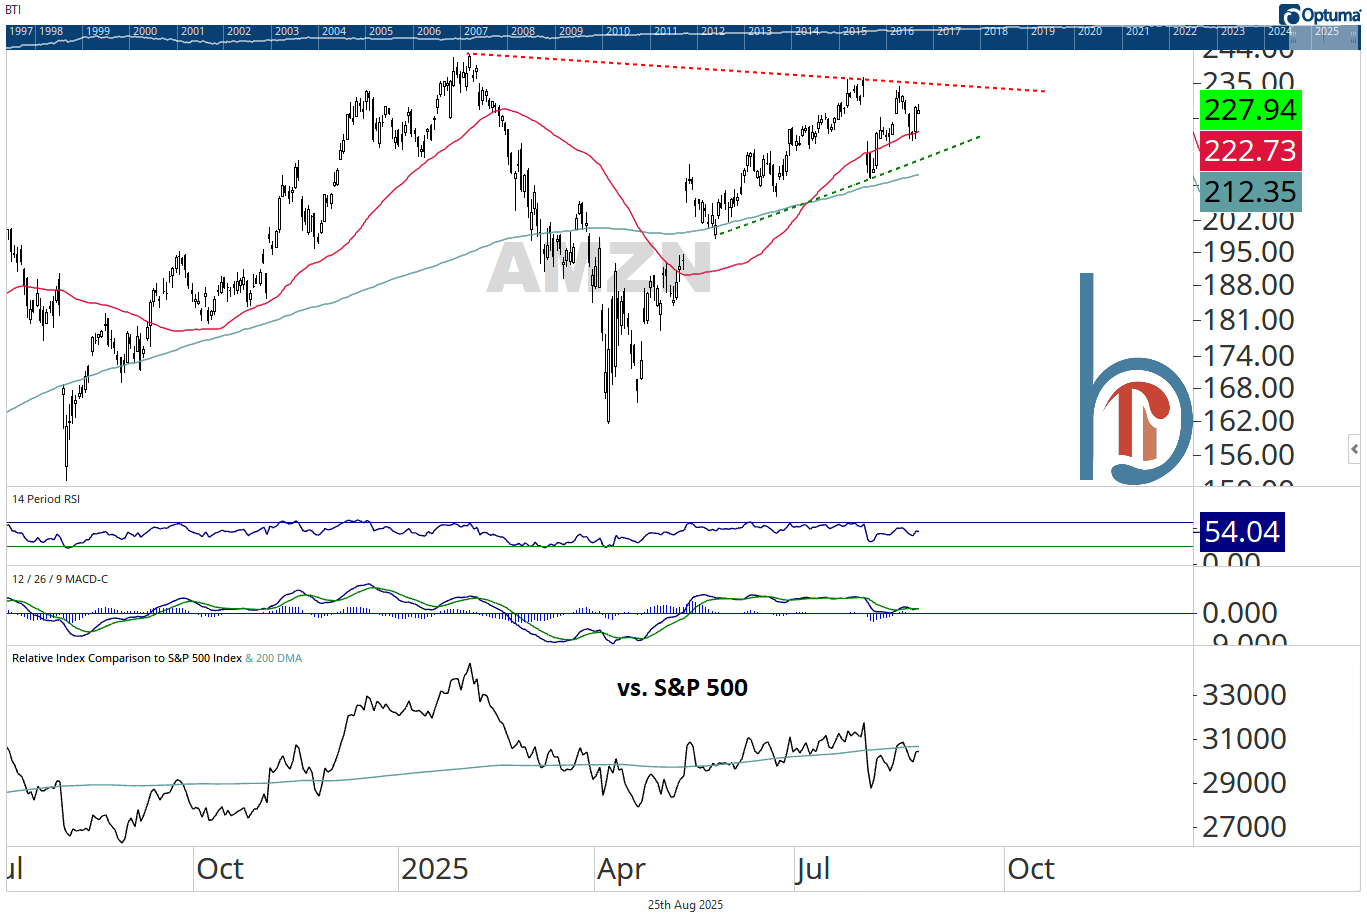
I would need to see a breakout above $235 to turn tactically bullish on Amazon. Neutral relative strength.
ANGL: VanEck Fallen Angel High Yield Bond ETF
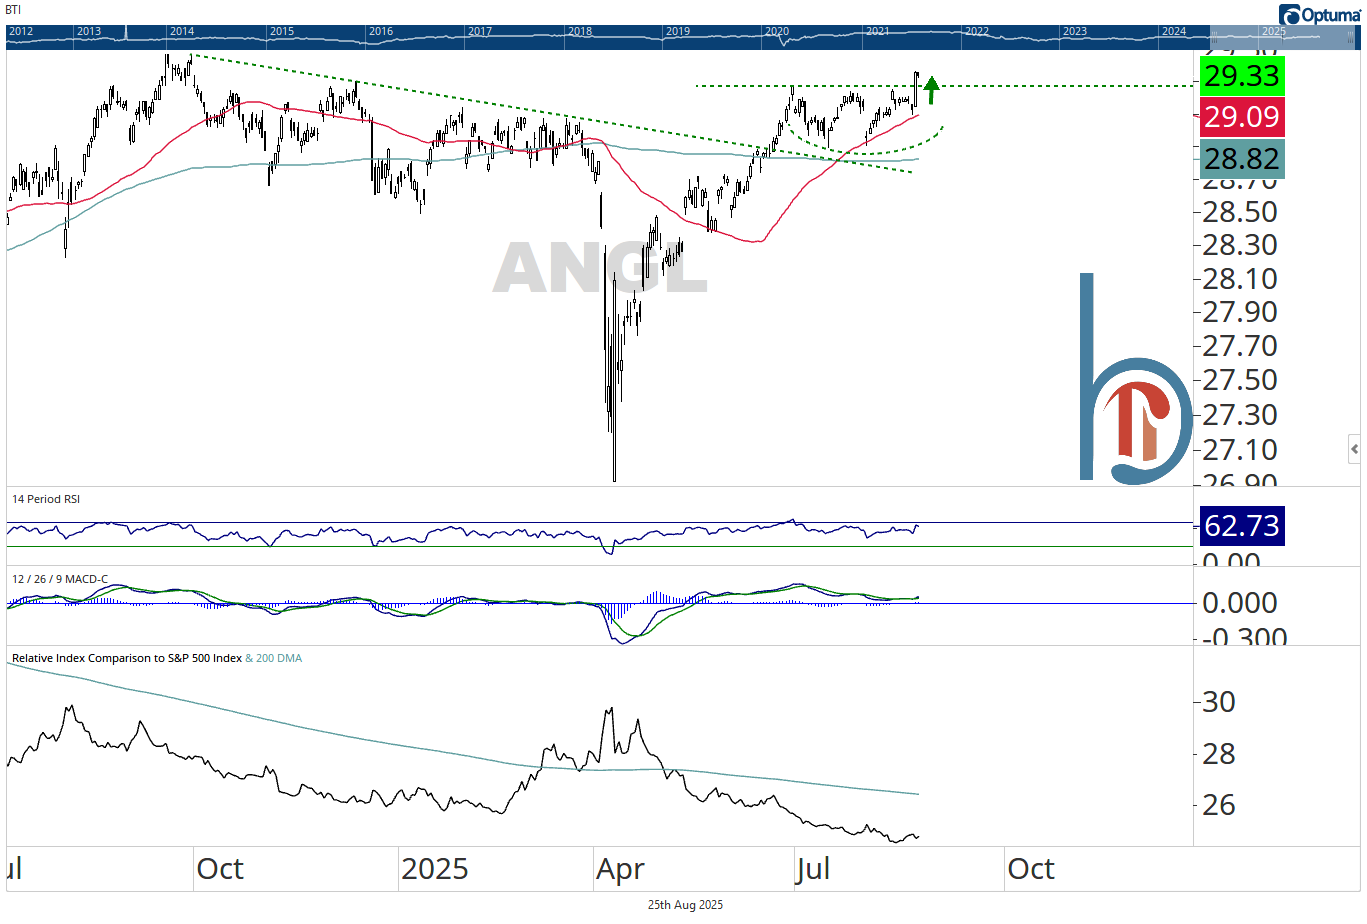
This is a good example of why I don’t like doing technicals on fixed income ETFs. If this was a stock, we’d be buying it. You have a nice base breakout, in an uptrend, simple. But look at the chart below:
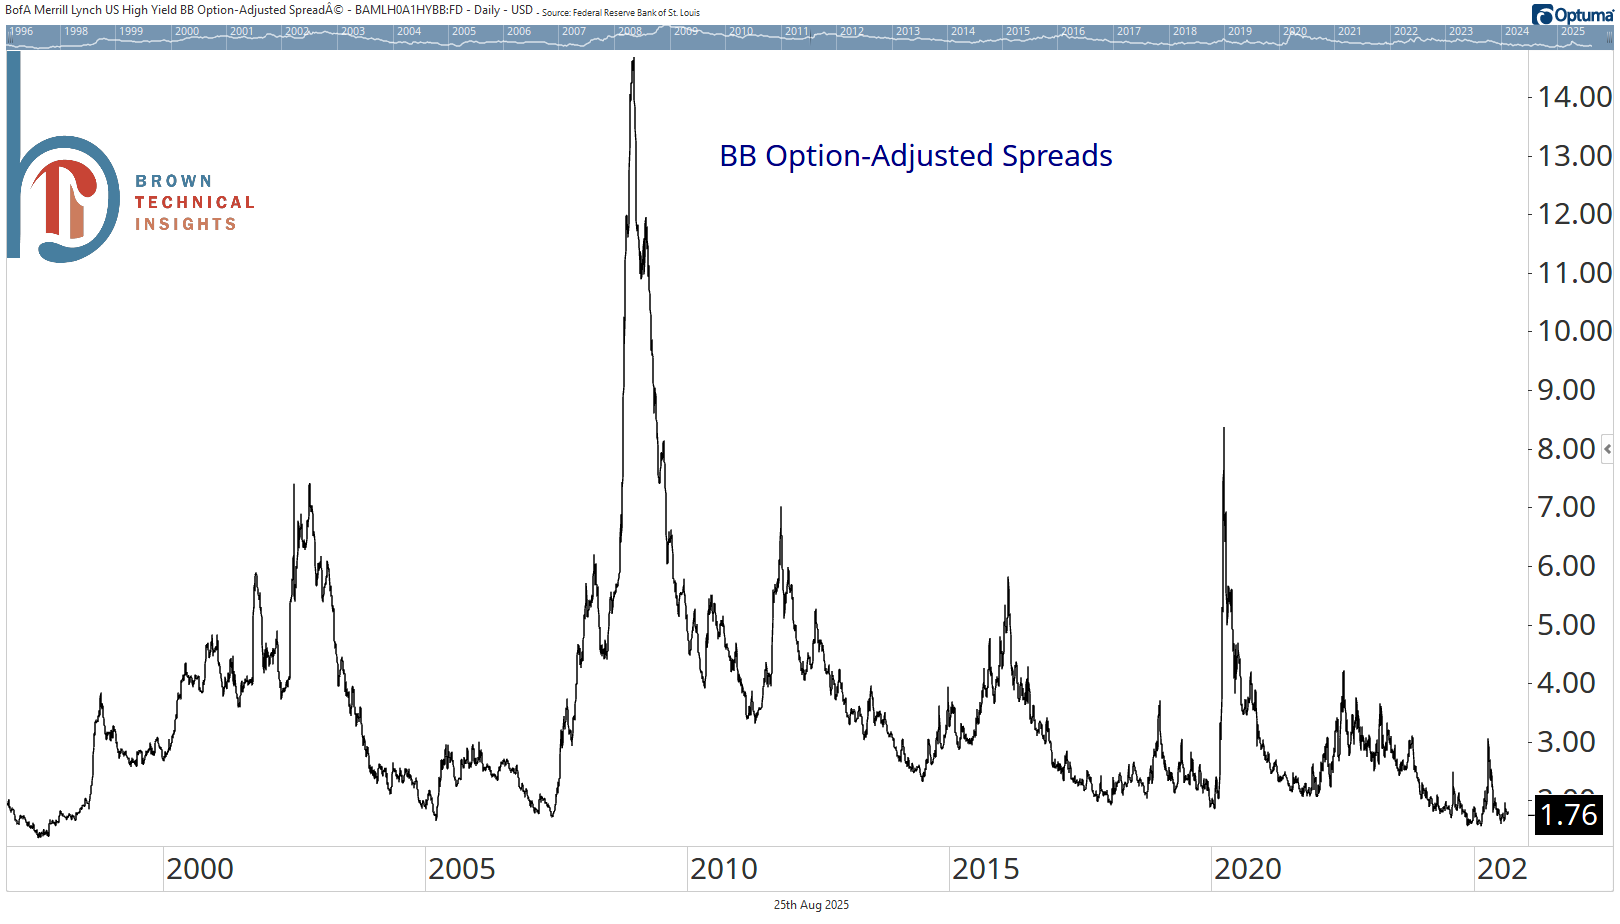
BB spreads (which is 75% of ANGL’s exposure) are near their lowest level in nearly 30 years. So, you have almost no upside from continued spread compression, but all the risk if spreads widen. And you’re not being compensated almost at all for it. So, the only way ANGL continues higher is if interest rates broadly fall, a view that would be better expressed with a Treasury ETF.
