
Overtime
Mailtime


Good morning,
People love stats. The little stat I featured on the S&P 500’s April comeback went so viral on Twitter (fine X) that it got quoted multiple times on CNBC yesterday.

Alas, I am not Scott Brown of Raymond James, so some economist who retired 3 years ago is getting all the credit, but thankfully, you fine folks know who I am, and that’s all that matters.
I’m thankful for all of you and I’m especially thankful to everybody who sent in questions for this month’s Mailtime.
We got some great questions and chart requests, so let’s see what the charts say.
Questions
5500 seems resistance, a break-through here on price alone is likely not confirmation. What else, in order of importance, do you need to see to confirm a sustainable move higher?
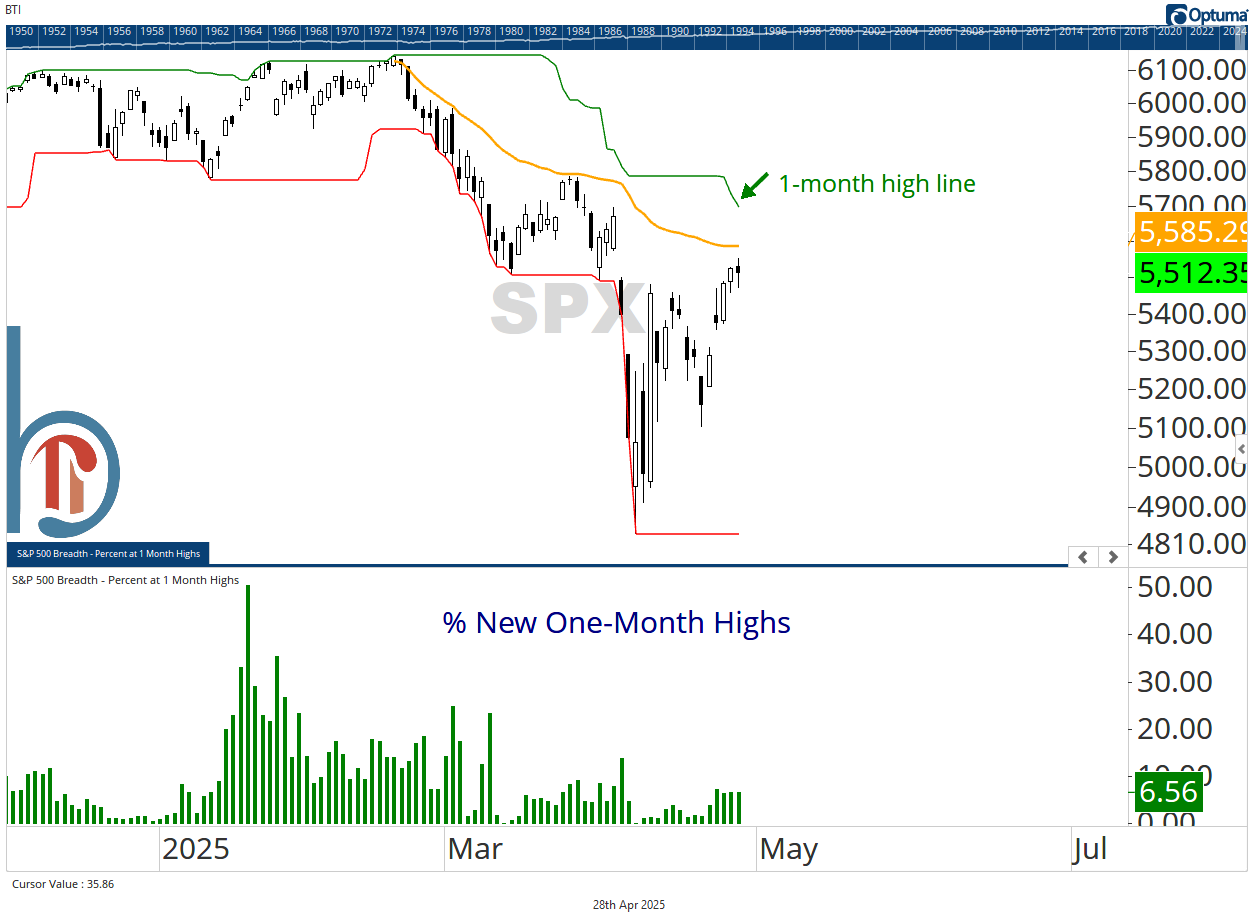
The most important thing I want to see is new highs expand. As the S&P 500 potentially approaches its one-month high line in the coming days (green marked line on the chart), we want to see a significant number of stocks doing the same. 55% is the famous deGraaf breadth thrust (never lower 12 months later) but at least 30% would be a better reading than anything we’ve seen since the decline from the February highs began. Last week’s high water mark was just 7%, despite the improvement in notable growth stocks.
What is your take on India vs. China over the next few months?
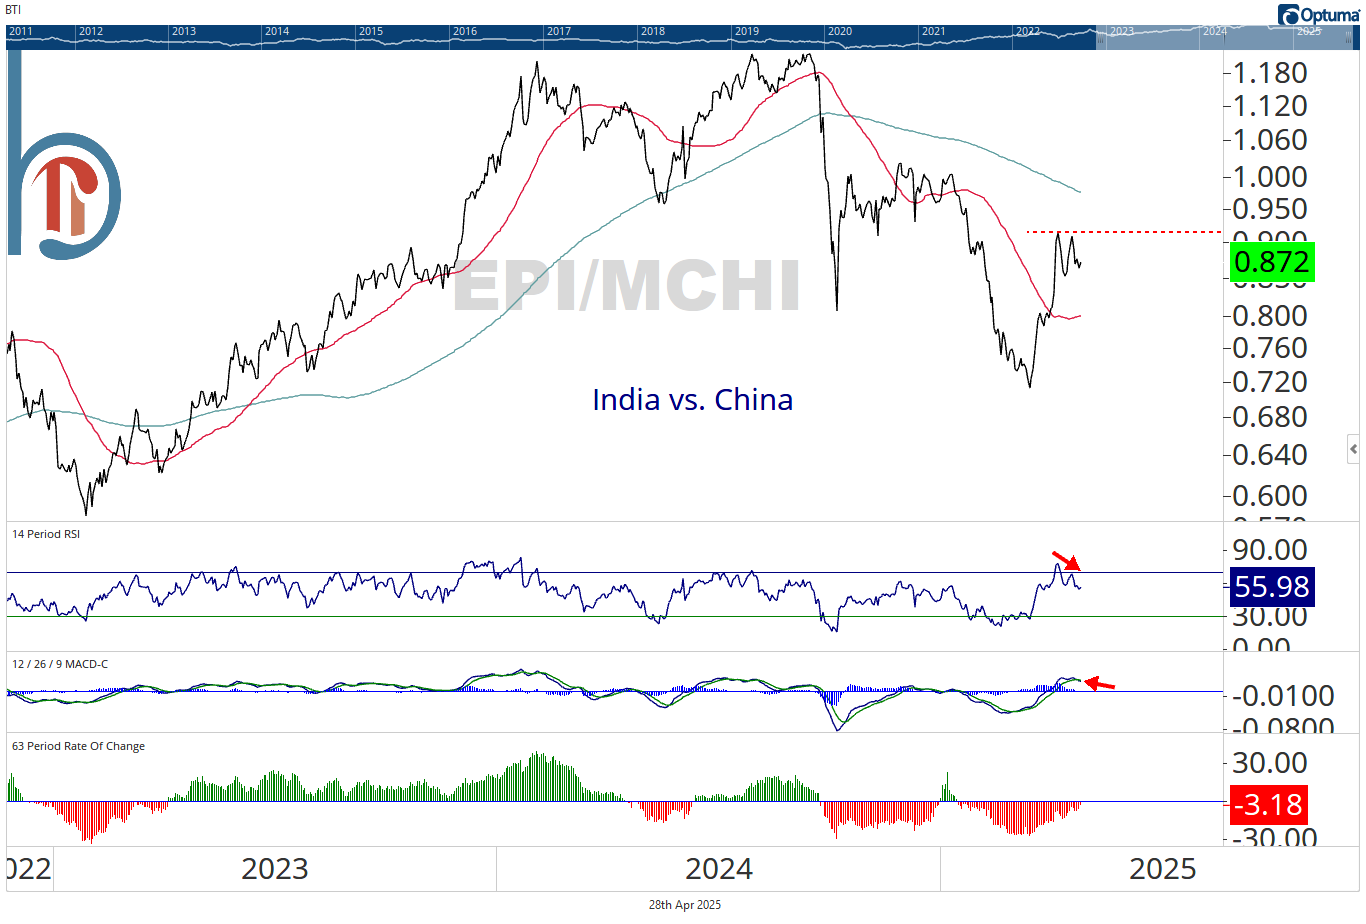
I would prefer to own China. Above is the ratio of the WisdomTree India Earnings Fund (EPI) relative to iShares MSCI China ETF (MCHI). After a 27% rally in the past six weeks, we’re seeing both momentum measures stall out. A rally in a downtrend is something we want to fade, and this looks like an ideal time for investors to rotate out of India and into China, despite any prevailing fundamental narratives.
What one indicator you would rely on for trading (swing or position) that is not price itself? Feel free to throw out a top 2 or 3.
Okay, so relative strength (price vs. the S&P 500) is the most important when it comes to model positioning but the question was trading, so we’ll set that aside.
The two indicators readers almost always see on my screen, in addition to relative strength, are RSI-14 and the traditional MACD (12/26/9).
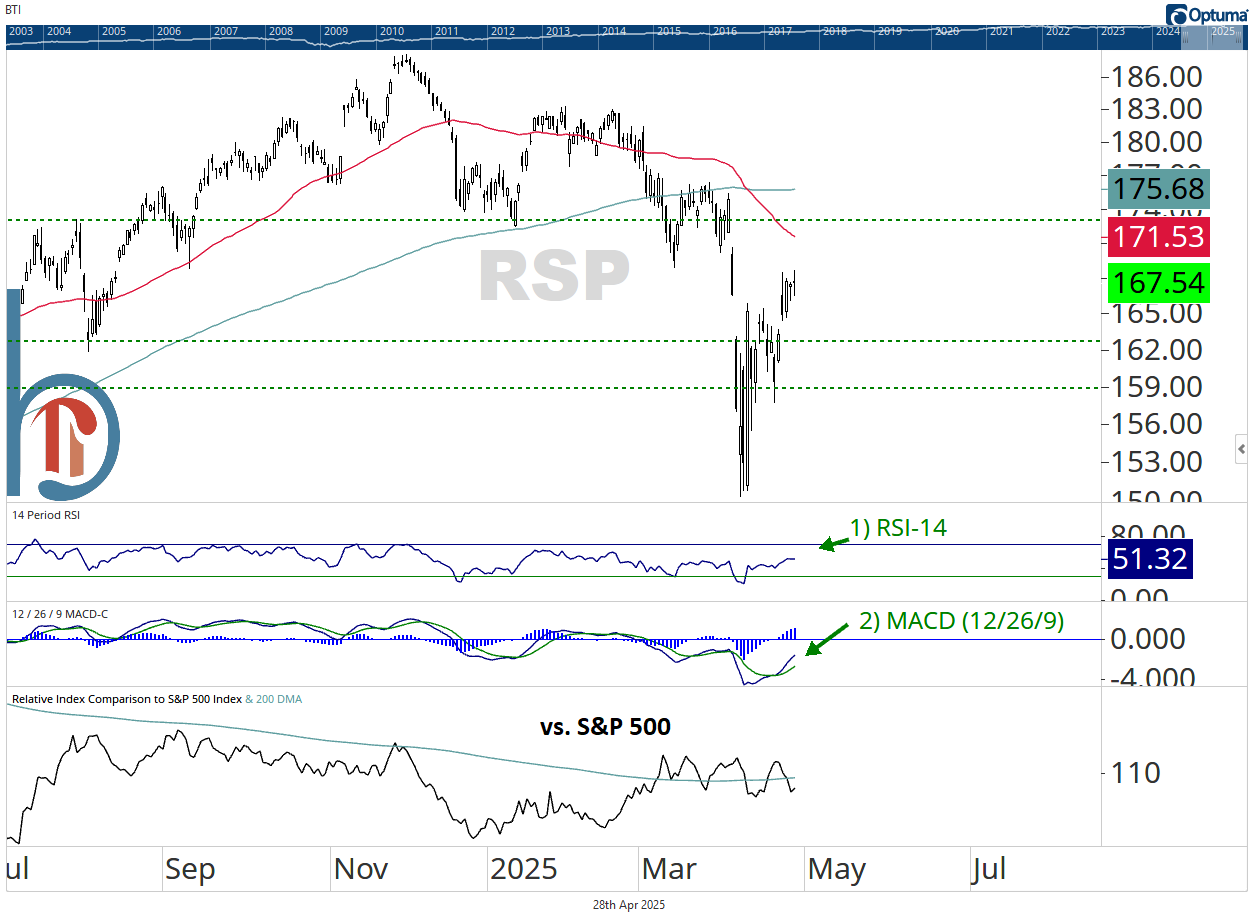
I use RSI-14 for two reasons. One, to identify strong trends. Rather than the face-value interpretation of overbought = bad; oversold = good, a consistently overbought stock is usually a strong uptrend, and a consistently oversold stock is a sign of a downtrend. The second thing I look for are divergences. When a stock makes a new high in price, but doesn’t get overbought, that can be an early warning sign.
The MACD is more of a traditional trading signal; when the histogram flips positive, that’s considered a buy, and when it goes negative, that’s the sell signal. I don’t trade solely off indicators, but for our time horizon, I find the weekly MACD to be a very helpful tool.
