Overtime
Equity ETF Chart Book


Good morning,
Yesterday’s Playbook went deep on oil and its ripple effects, so today we’re keeping it straightforward with a good old-fashioned chart book. We’ll cover trends and key support levels across major sectors, popular industry ETFs, and anything else worth flagging.
We’ll start with energy stocks, since they’re still very much in focus.
Energy
XLE at new highs but clearly tired
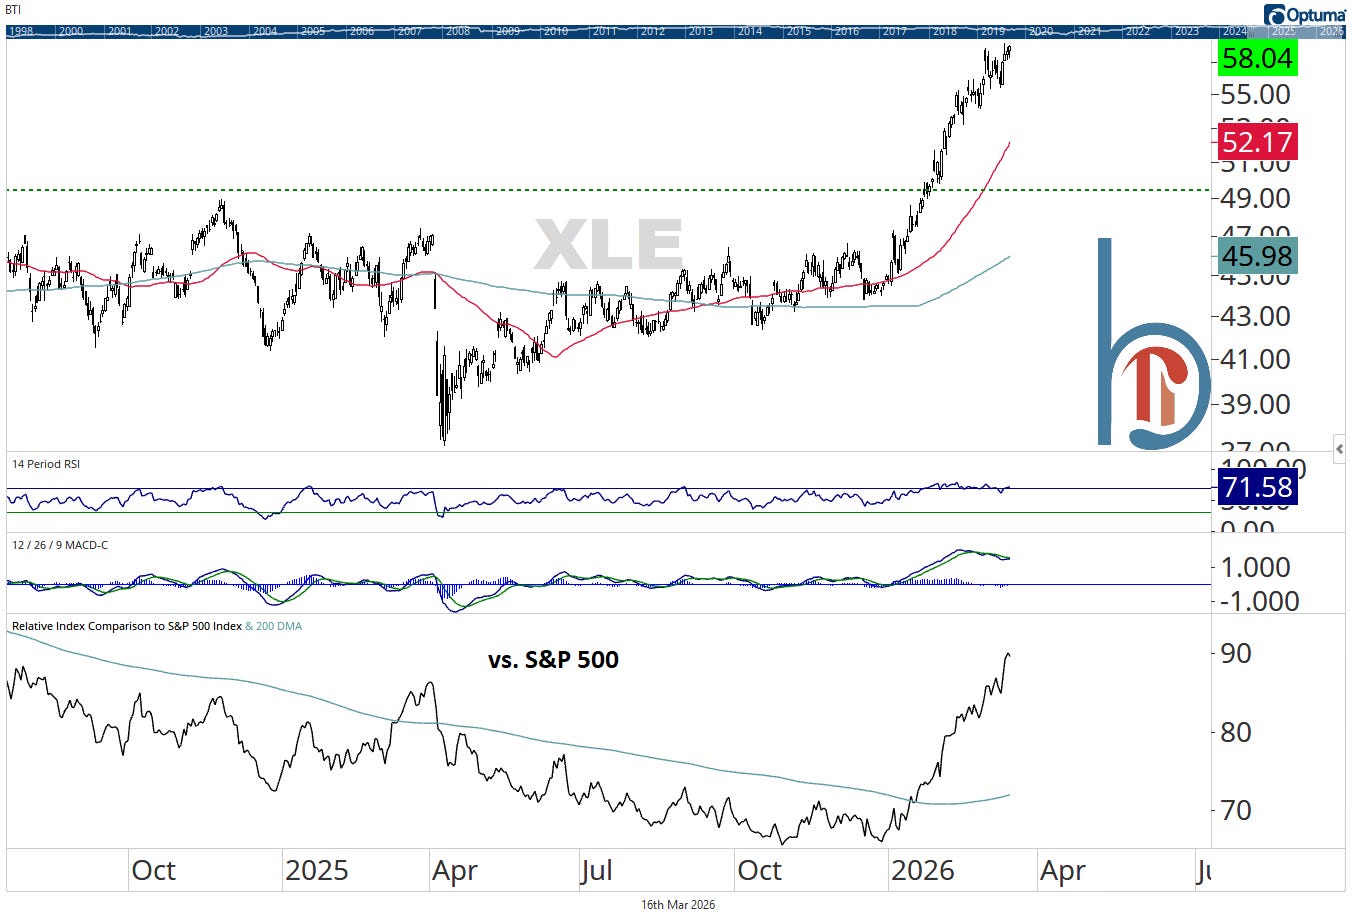
Since the Friday before the Iran attack, oil prices are up 40%. XLE? Up less than 4%. A good trend, but excessive inflows before the oil shock have limited upside and likely will continue to in the near-term.
Our sale of oil services has paid dividends
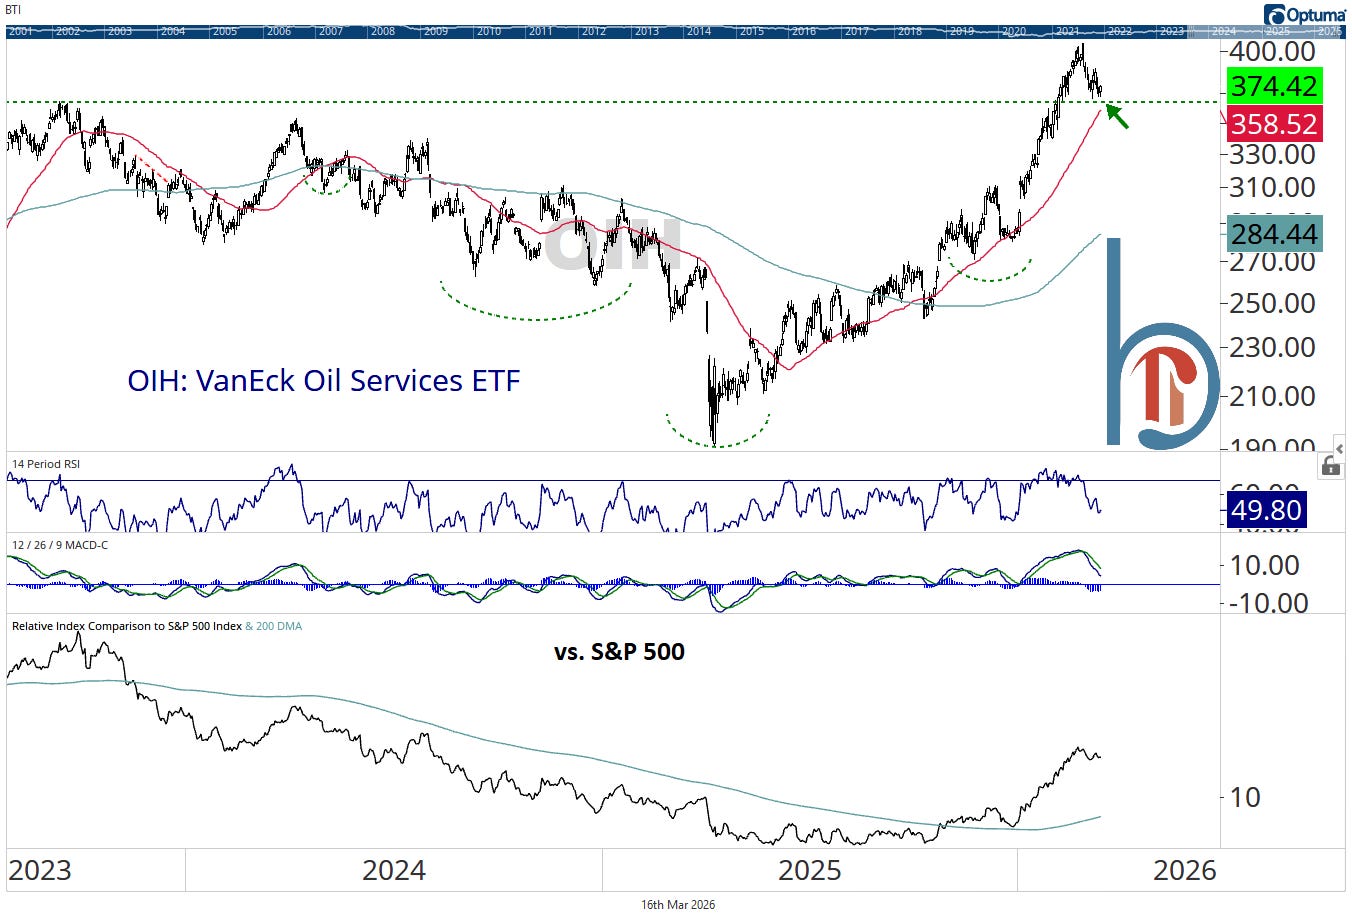
We sold out of our oil services position to move back to neutral on energy exposure at the beginning of the month, and OIH is outright lower by 3% since. The extreme inflows and overbought condition would suggest we need more time to consolidate before this is an opportunity again, but it’s encouraging that OIH is holding above the 2023 highs.
All the money is flowing into price-sensitive E&P stocks
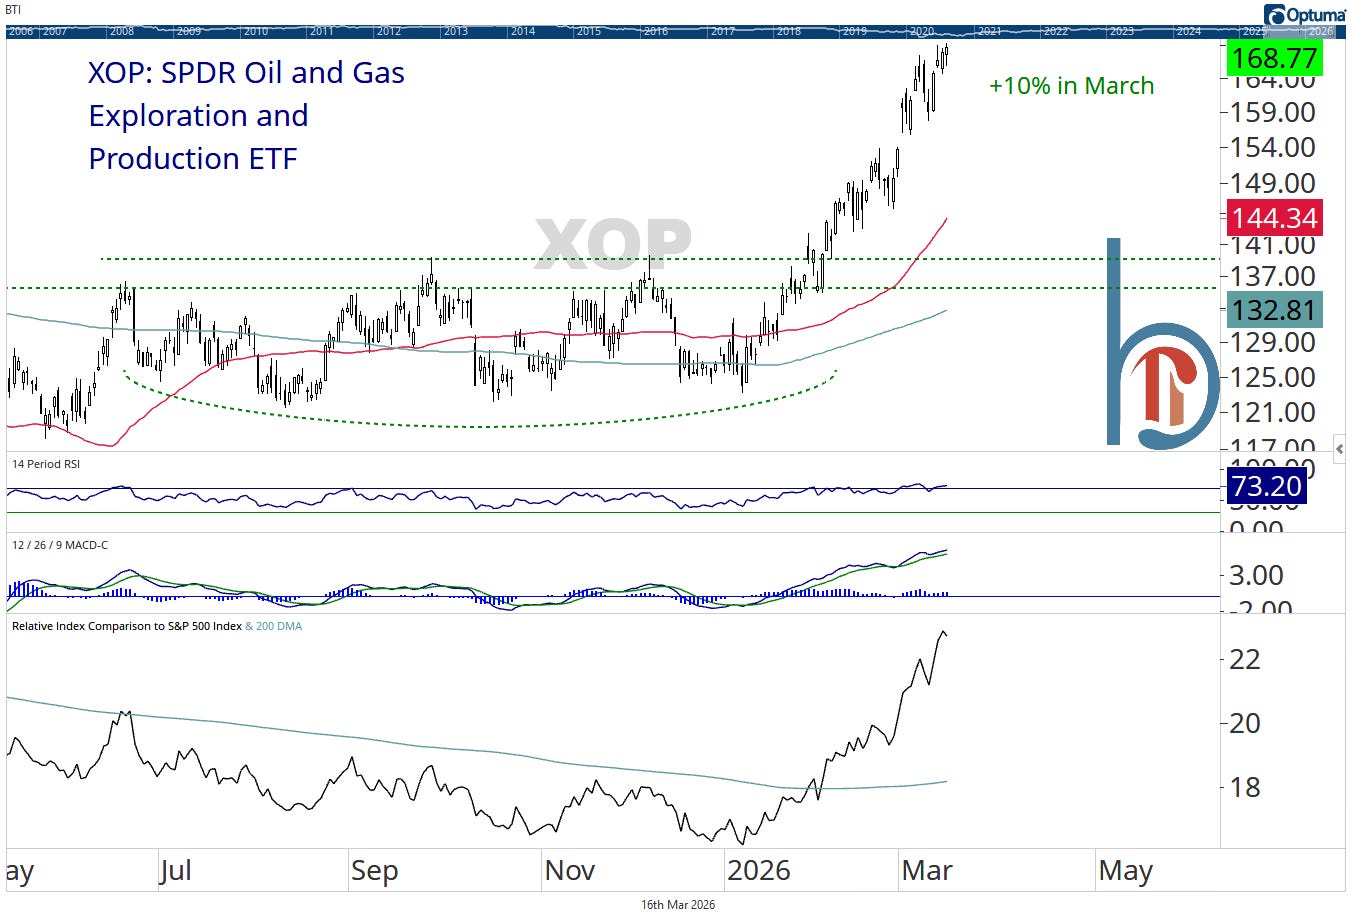
It’s well short of the gains that oil has seen, but exploration and production stocks have been the best-performing area of energy since the Iran attacks, and XOP hit fresh highs yesterday. These stocks are most sensitive to the price of oil, should it stay high, and this chart gets really interesting when you zoom out 👇