
Overtime
Small Caps


Good morning,
This week, we’re taking small caps into Overtime. Last week, the benchmark Russell 2000 hit a new all-time high for the first time this year and the index is trying to break out of a more-than-four-year base.
The chart says there’s huge upside potential. But that’s table stakes in a bull market.
The million-dollar question for asset allocators is, can smalls actually sustain their recent streak of outperformance?
In today’s report, I’ll break down:
The long-term target for IWM
Breadth and how concentration may be even more of an issue for small caps
Key relative trends
and 10 single-stock opportunities
Top-down technicals
Do not underestimate the potential upside for IWM
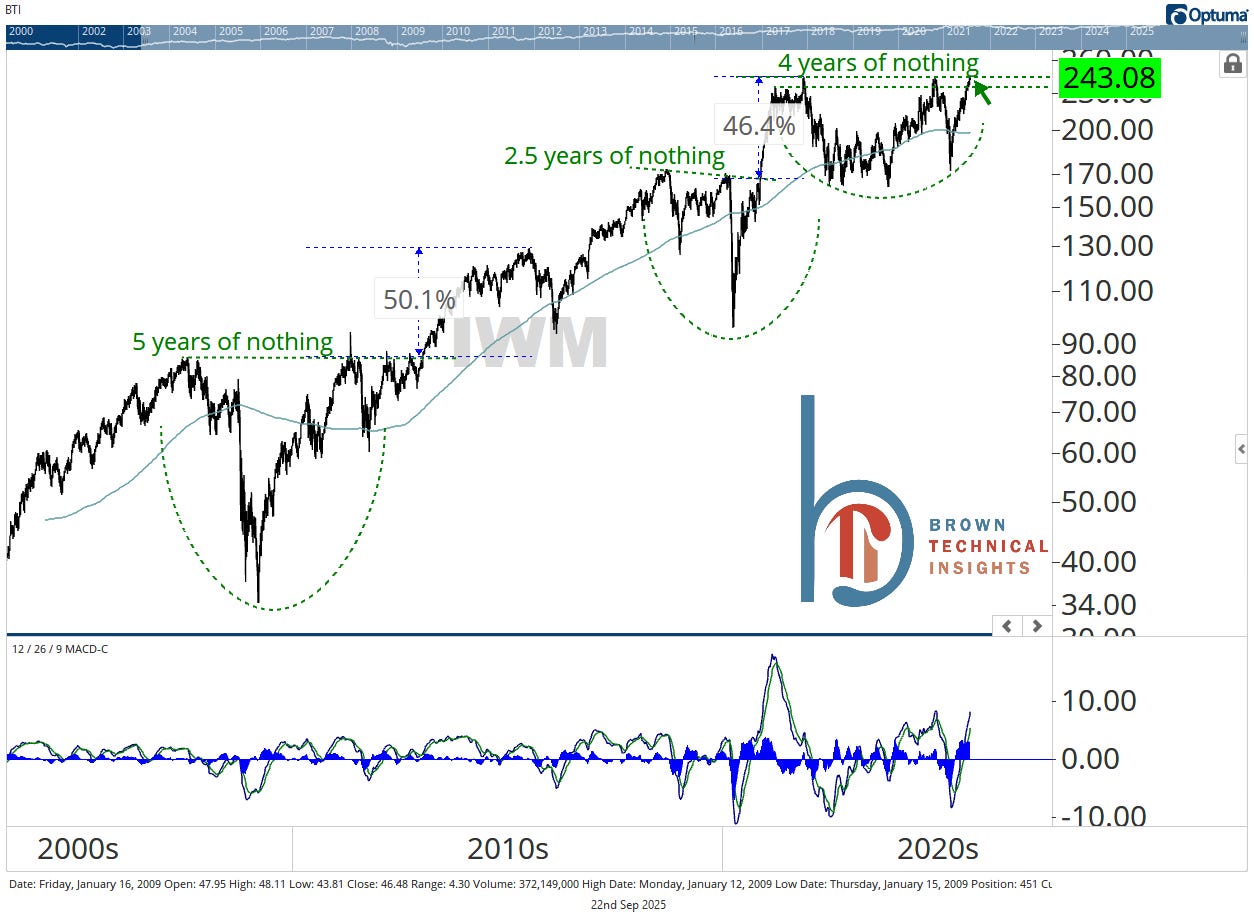
We love big bases out here, and the Russell 2000 is absolutely one. After four years of sideways action, IWM is breaking out. The last two times we saw multi-year base breakouts, IWM ran 50% and 46%. This time, our measured target is $326, 34% above yesterday’s close.
Zooming in
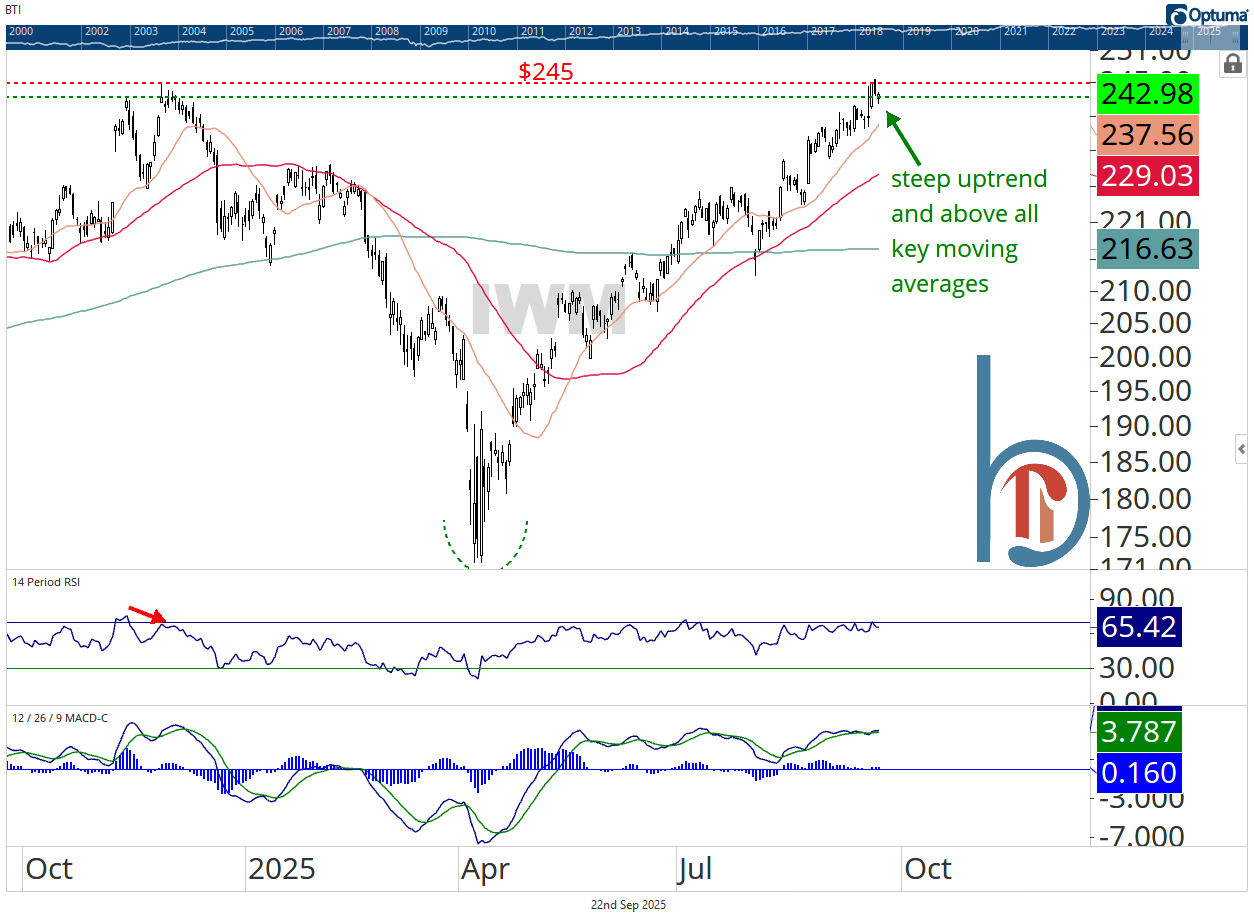
Shorter-term, the Russell 2000 ETF is riding a steep uptrend and above all key moving averages. First support is at the 21-day ($237 and rising), followed by the 50-DMA ($229 and rising). We do, however, want to see a strong close above $245, and ideally, stay above that level for good.
One major issue
Moving average trend breadth is lukewarm (like large caps)
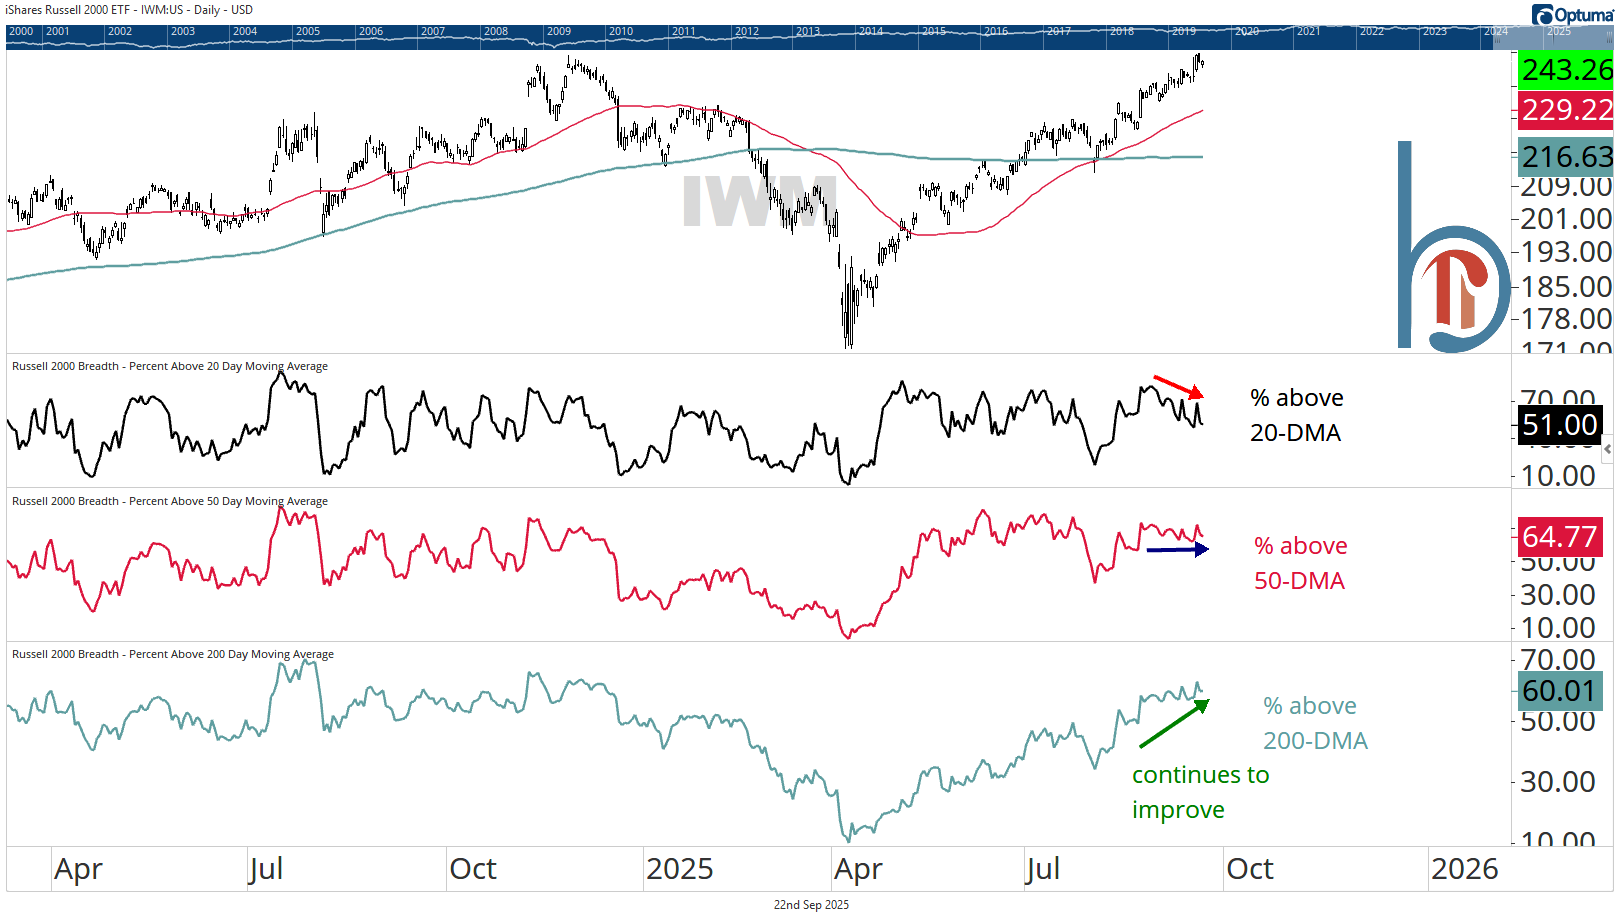
We showed moving average trend breadth for the S&P 500 yesterday, so here are the same stats for the Russell 2000. You can see the recent drop in the percent of stocks above their 1-month MA, but it’s actually a higher number than in large caps (51% vs. 42%). The reading above the 200-day (60%) is the same for both indexes, but in small caps, this is the highest reading of the year.
