Sector Round-Up
Quick look at the 11 SPDR sector funds following the release of July's lower than expected CPI data
Thanks for reading our first blog post! If you’ve stumbled upon this now, congratulations, enjoy the free content! For now, this is an early trial as I get used to SubStack and my new charting software, but don’t worry there is a lot more to come and it will only improve from here.
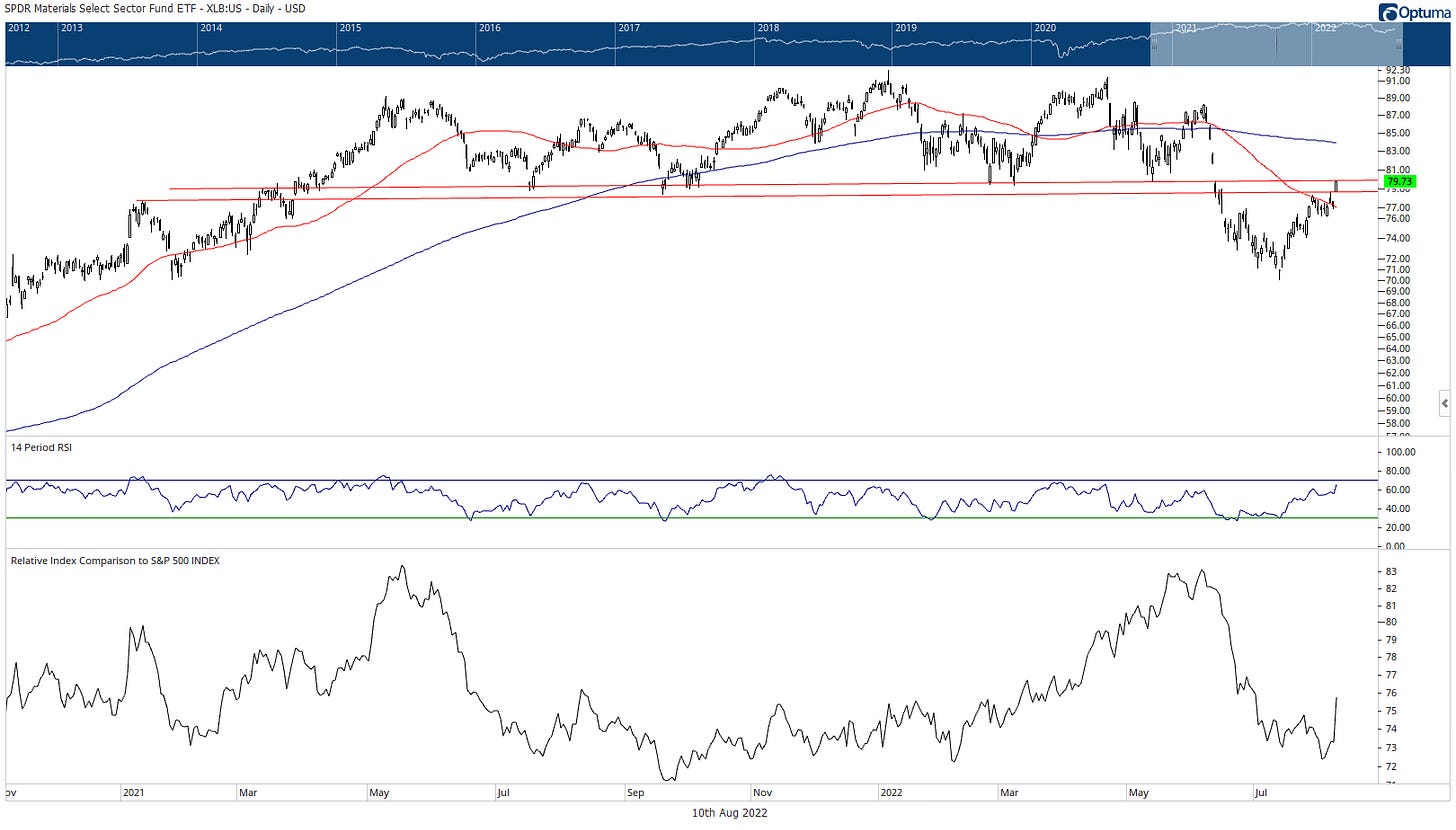
XLB: The materials sector is up into resistance, clearing recent highs, but so far still short of the May lows. It also remains below a downward sloping 200-dma.
Relative strength vs. the S&P is bouncing from extremely oversold conditions, but remains neutral.
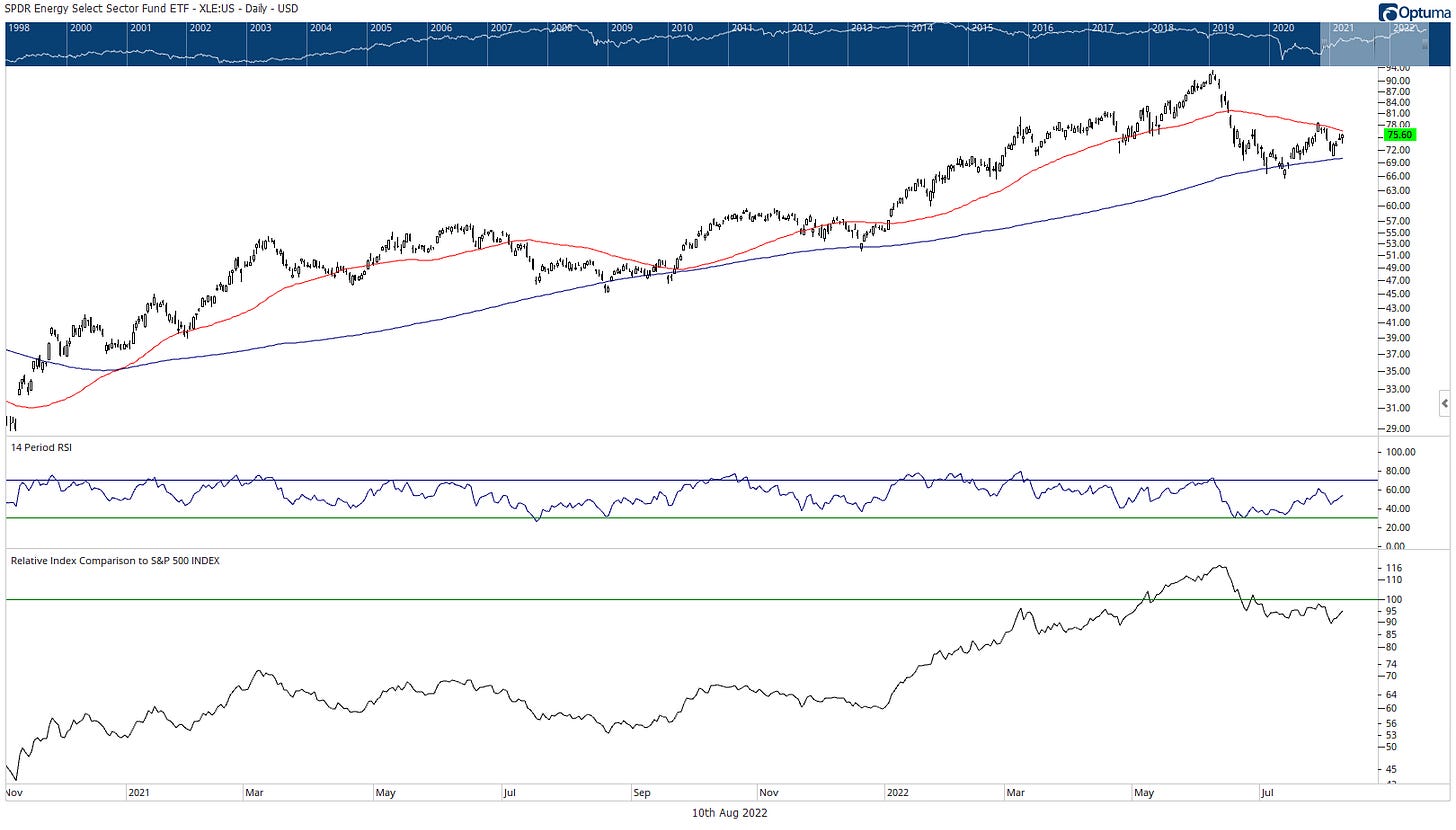
XLE: Energy remains trapped in no-man’s land, between a rising 200-dma and a falling 50-dma. More resilient than crude oil which has recently broken down, but nat gas’s failure to break through May’s highs has us extra cautious.
Relative strength continues to get the benefit of the doubt above a rising 200-dma.
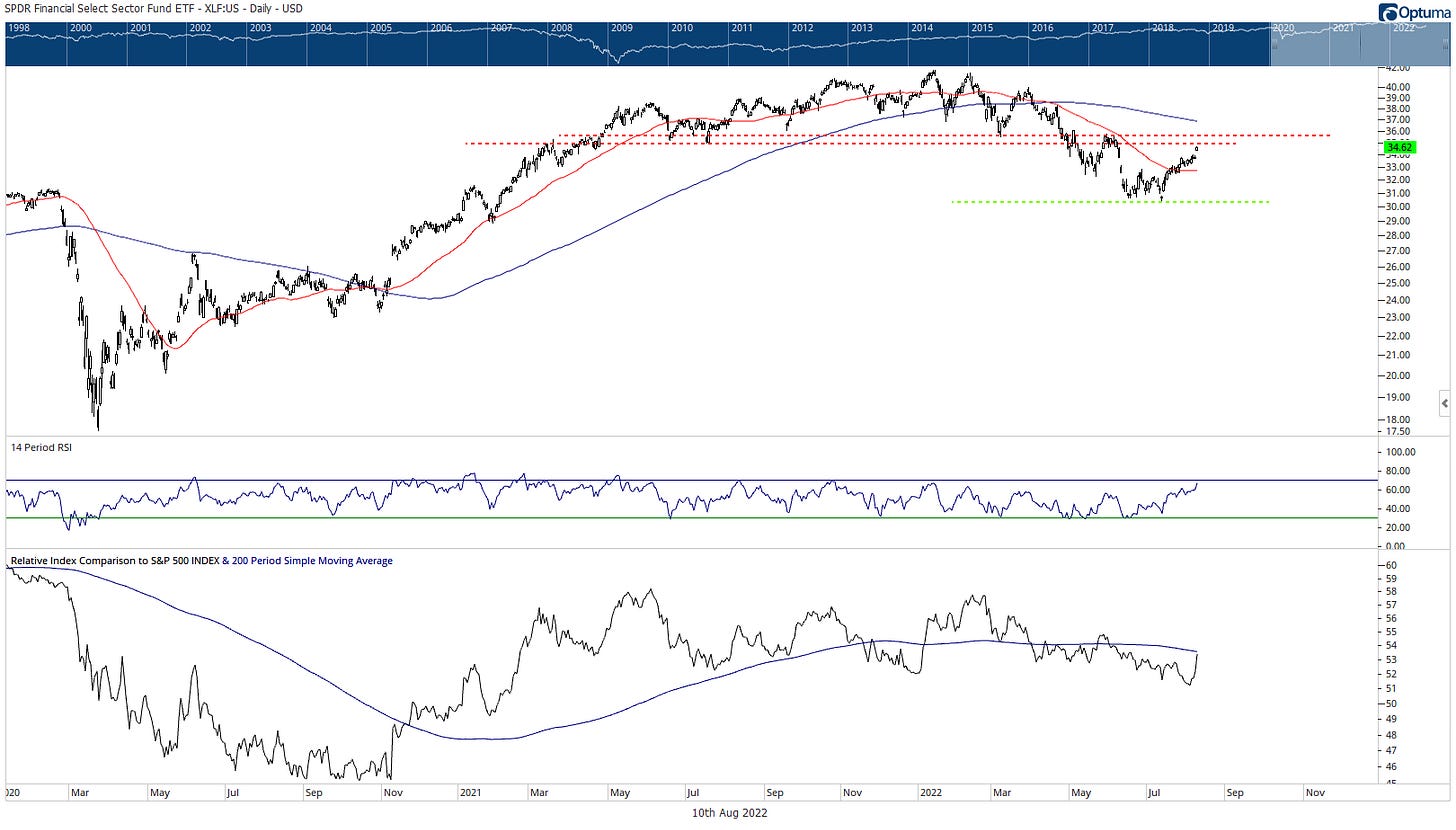
XLF: If XLF is below $35, forget about it. There is nothing to see. Yes, Wednesday provided a nice gap, but between the broken support range and a lurking downward sloping 200-dma just above, you would have to be insane to be adding here.
In relative terms, nothing is much different, it continues to trade sideways relative to the broader market.
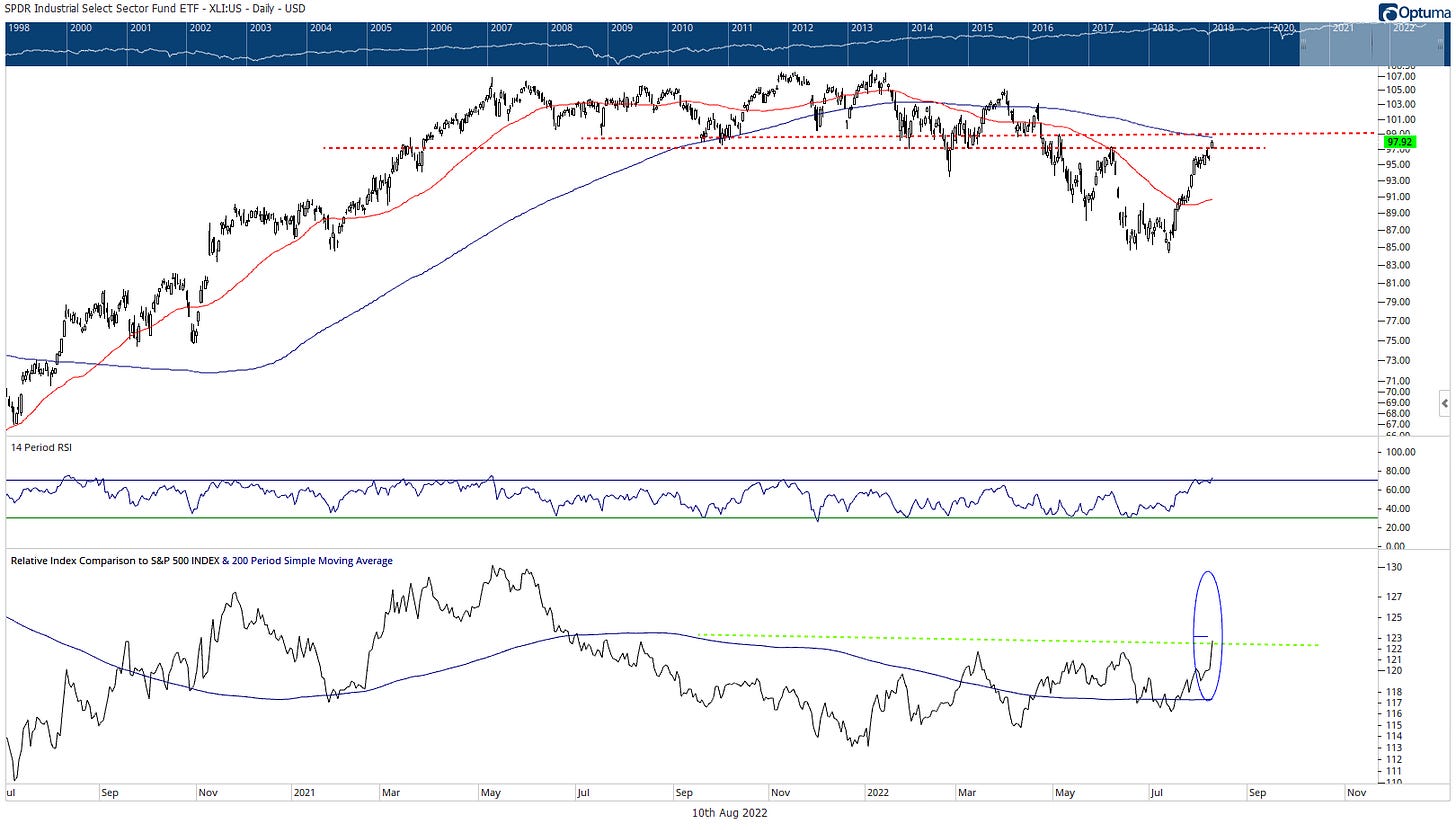
XLI: 52-week relative highs are nothing to ignore, even with the sector historically most-correlated to the broad market. Strong gap today up above the early-June highs, but (again) hard to be excited about jumping back into the range and still having to do battle with a downward sloping 200-dma. I don’t know what the future holds, I just know this is a bad entry point.
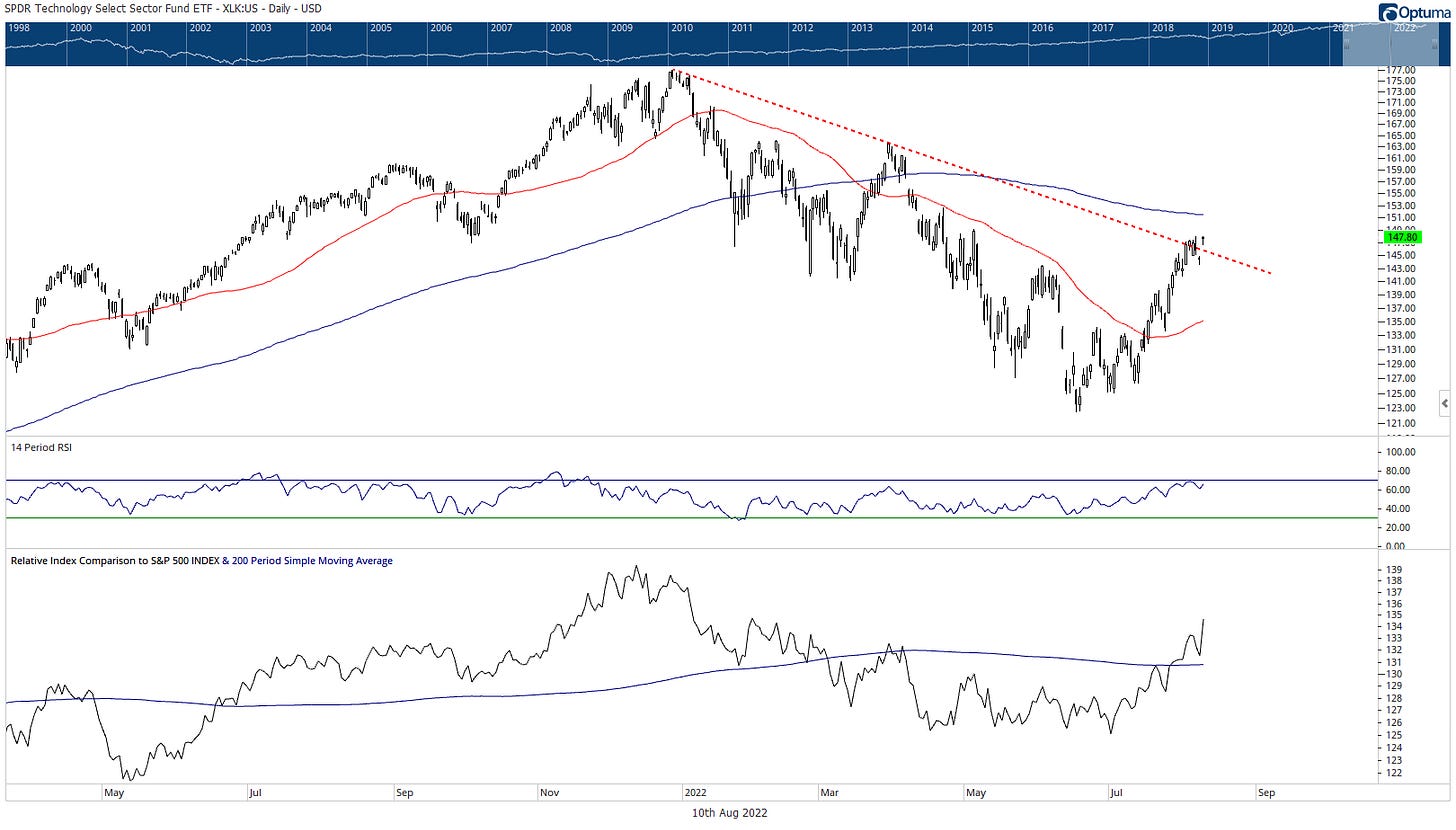
XLK: Big picture, breaking through this downtrend line is clear progress. And while we aren’t day-traders, we can’t help but notice that XLK was unable to punch through Monday’s highs at $148. For such a big news day for growth stocks this should be a concern.
In relative terms, Apple continues to do all the heavy-lifting. You don’t have to be overweight, but you sure can’t be underweight this sector if you run an ETF model, or at least that stock as long as it continues to act this strong.
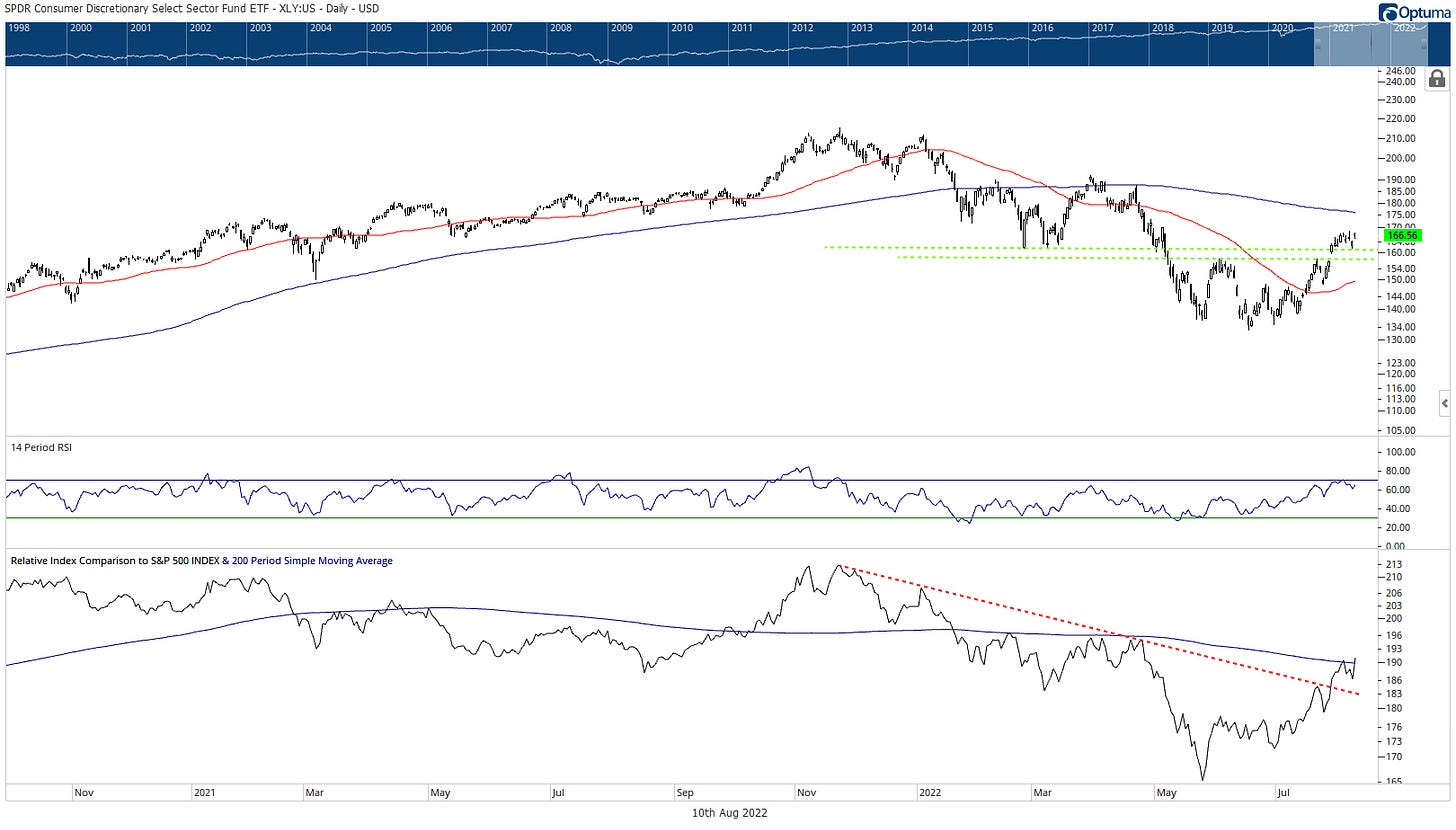
XLY: Not to be sticklers here again, but we can’t help but notice that XLY is also not through its Monday highs. That said, an entry point up above the $160 range isn’t crazy, and this is no longer a clearly lagging sector, as shown in the bottom panel.
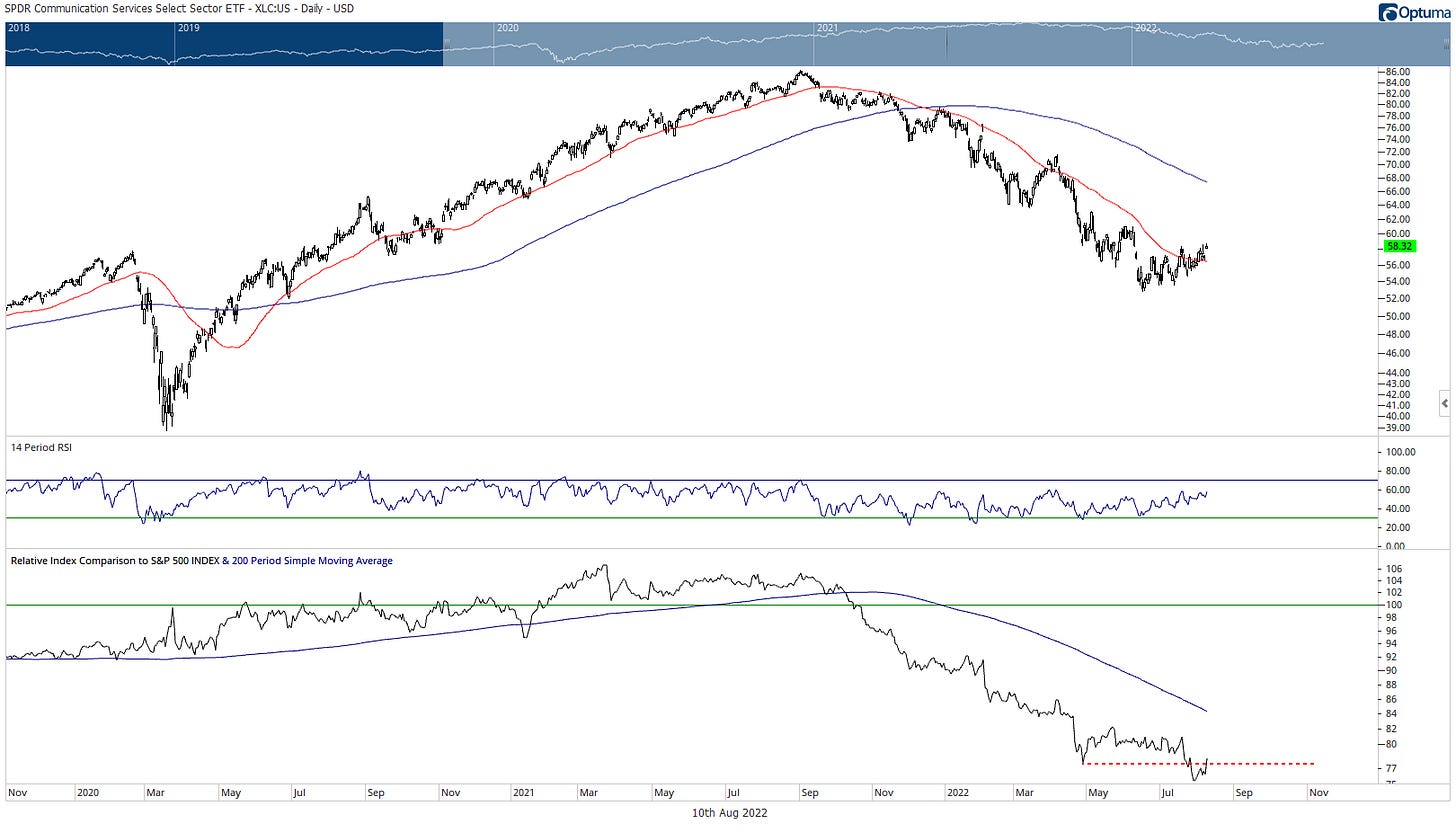
XLC: How can you not hate this sector? Just days removed from fresh 52-week relative lows and still in a steep decline of lower lows and lower highs in price.
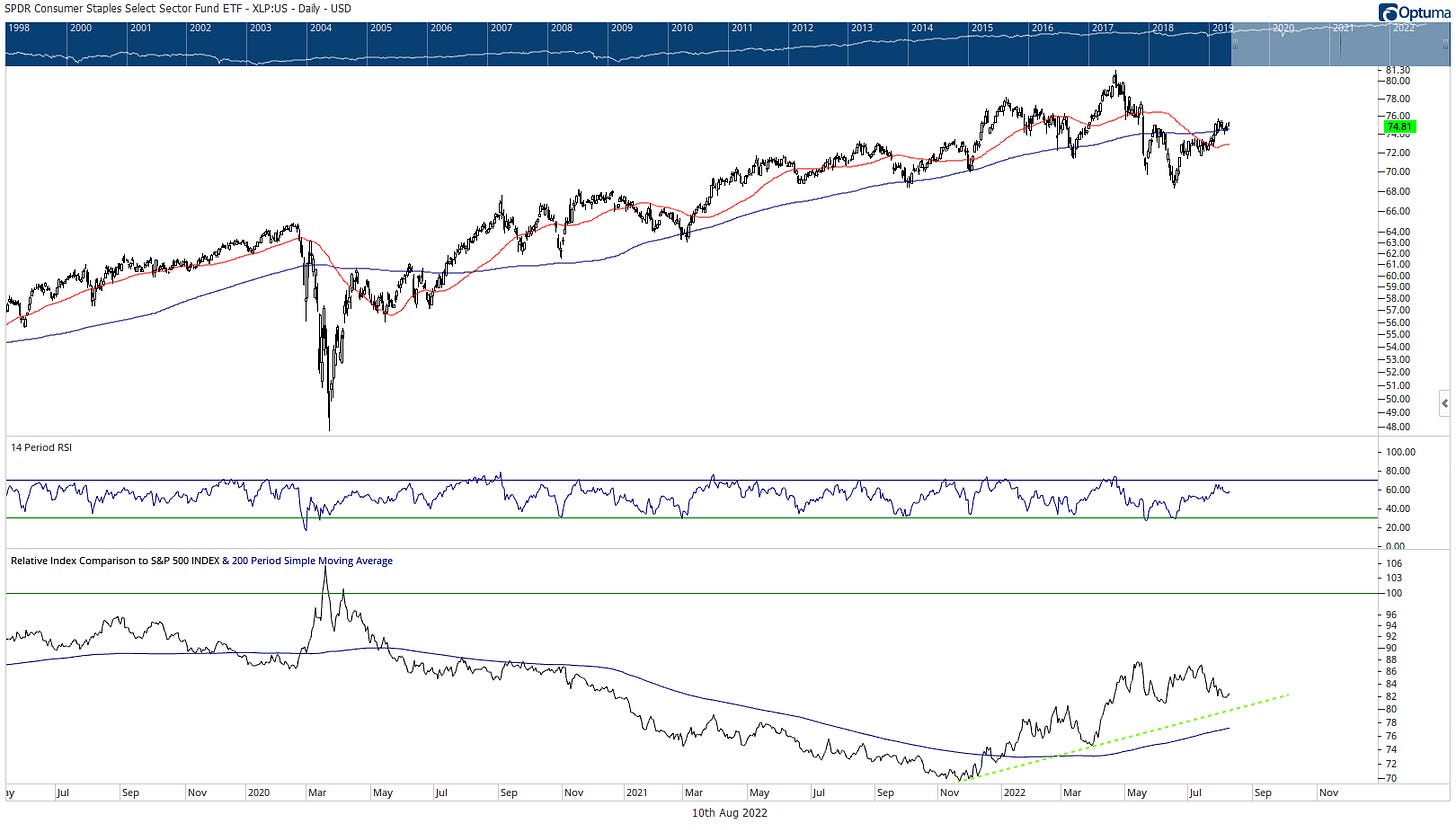
XLP: It is relative strength showtime! After printing a lower relative high in July, will a lower low be next for XLP? Time will tell, but for now it has to get the benefit of the doubt as a leading sector, which isn’t great because it looks like dead money in absolute terms. Stuck to that flattening 200-dma that acted as support throughout 2021.
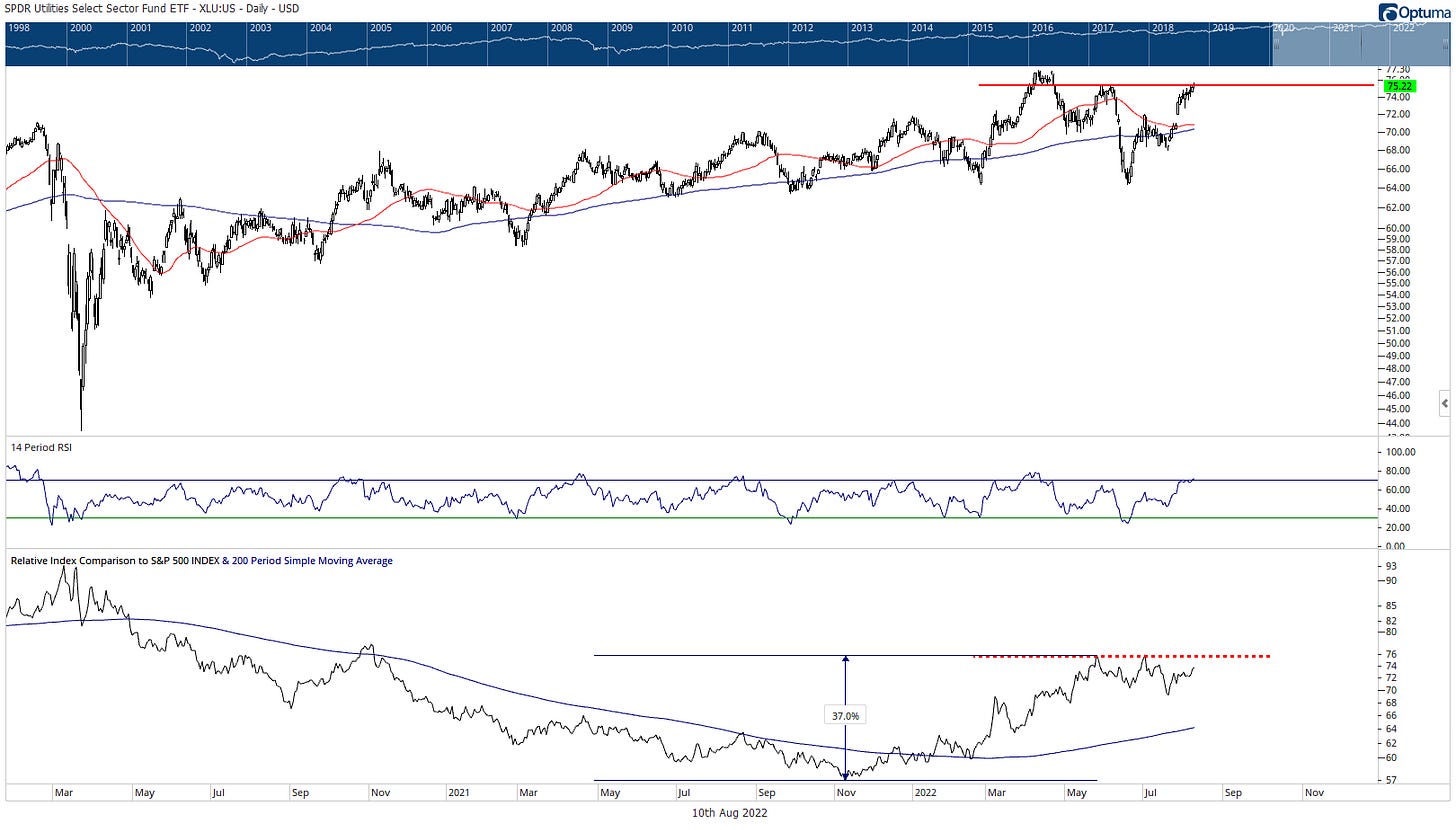
XLU: $75.35 is the magical level that separates XLU from making a run at all-time highs and for now, it looks like it may not get there. Still a relative leader, though consolidating after outperforming the SPX by 37% from November through early-May.
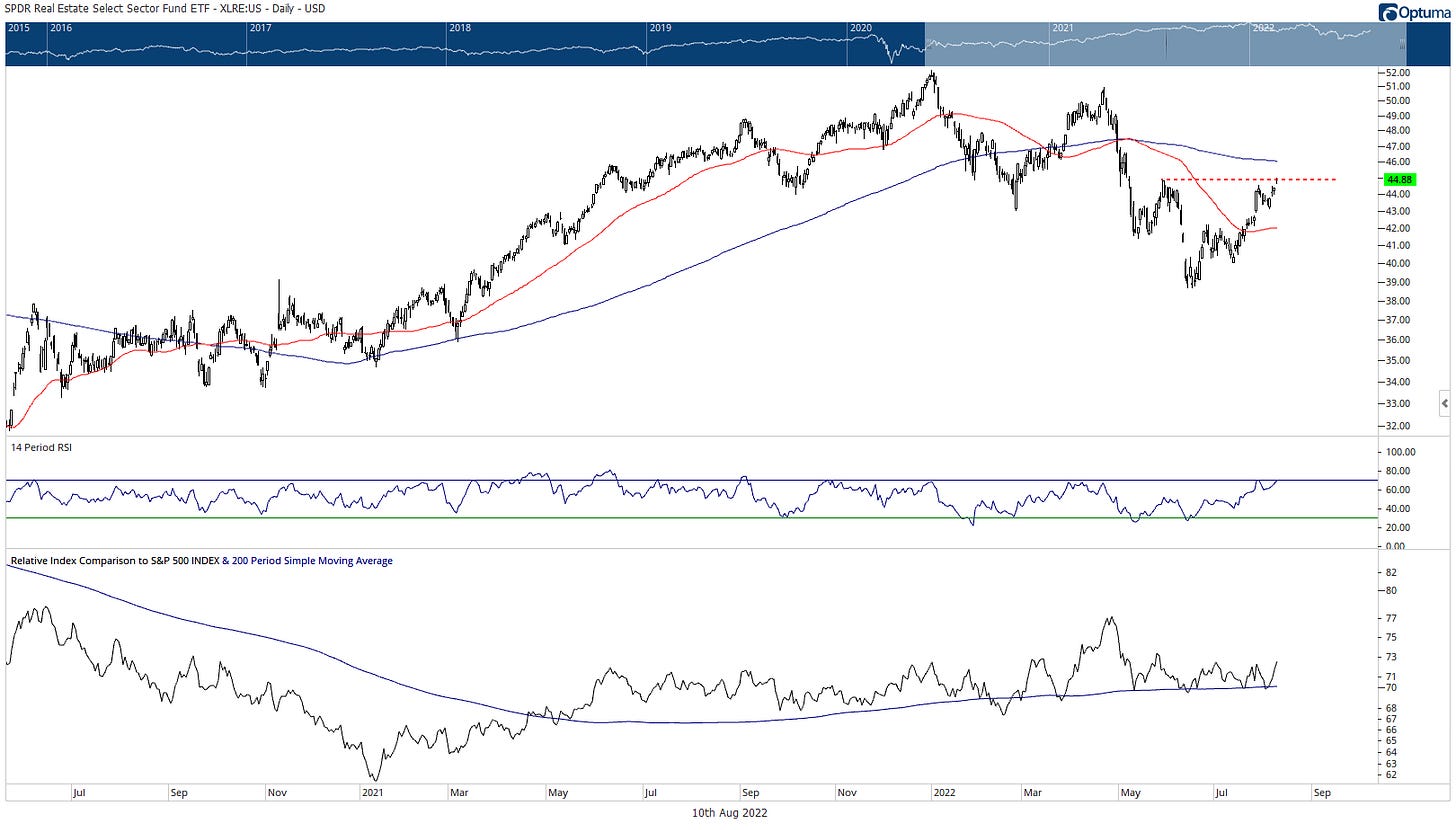
XLRE: If you are bullish on real estate, you really better hope to see some upside follow through on Thursday, because this is looking like a very timid gap and is so far unable to push XLRE through its late-May highs.
In relative terms, this incredibly diverse sector is as neutral as neutral gets.
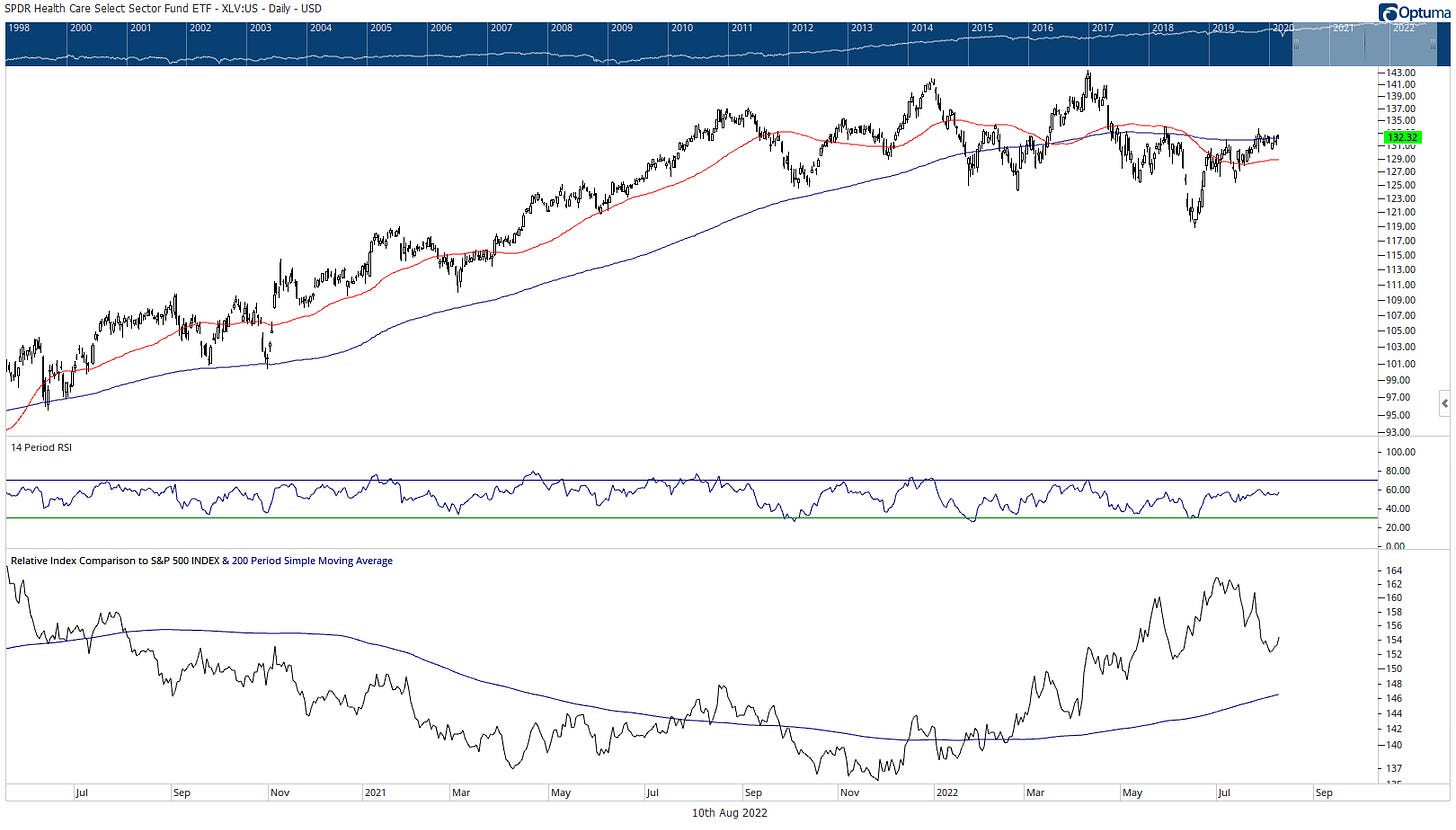
XLV: Looks like an attractive entry point for relative managers. In absolute terms, XLV looks like a broader top, though our work under the hood of the sector suggests that isn’t the case. Simply a sector to be more selective in.
All information in this post is for educational and entertainment purposes only. This is not intended to be taken as investment advice nor as an offer to buy or sell securities. If you have questions about your own investments, please contact an investment professional.


