
Stock Trends
S&B 20 Index Review


Good morning,
I made the decision to review the S&B 20 Index earlier in the week, with the hope of answering two questions from the bottom up:
What the hell is going on with the rest of the market?
And how likely is it that the top tech stocks will catch down to the rest of the market and its recent breadth problems?
As a reminder, the S&B 20 is my custom index of what I believe are the market’s most “important” stocks. You can read the reason for each stock’s inclusion in the introductory report.
Unfortunately, we may have answered question #2 yesterday, as the S&P 500 fell 2.95%, its worst day since August and the second-worst day of this bull market.
That makes a review of these stocks all the more timely, but before we get into the charts, a few stats on recent market action:
The S&B 20 fell 2.7% yesterday, led lower by the tech basket (-3.6%) and cyclicals (-3.3%), while the defensive basket fell 0.9%.
The S&P 500 extended its negative breadth streak to 13. If it were to be negative again today, it would tie the all-time record of 14 from 1978.
SPX decliners outnumbered advancers by 24 to 1 yesterday. This is significant because up until Wednesday, the daily numbers were extremely mild (thus Monday’s report title: A slow bleed).
The Dow is down 10 days in a row, the longest streak since it went 11 in 1984.
The Russell 1000 Value ETF is down 12 consecutive days, the longest since inception.
The equal-weight S&P 500 has closed below its open 13 days in a row.
Finally, while we won’t have a Monday Morning Playbook next week for the Christmas holiday, it is important to note that the US 10-year yield closed at 4.5% (any more upward movement constitutes a breakout) and the US Dollar Index hit 108. If we’re above those levels, the top-down view is that stocks are likely to continue to struggle.
Now for the bottom-up…
Top Tech 8
AAPL: Apple

First off, any stock can get hit in a market panic but this is as strong of a chart as we’ll see today. AAPL hit a 52-week high yesterday morning before succumbing to the sell-off, is at 52-week relative highs, and has major support at $233-$237. It remains on the Blue Chip Hot List.
AMZN: Amazon

Amazon fell 4.6% yesterday but its big base should cushion the blow of any pullback. Tactical support at the 50-DMA ($203.82 and rising) followed by $187.
AVGO: Broadcom
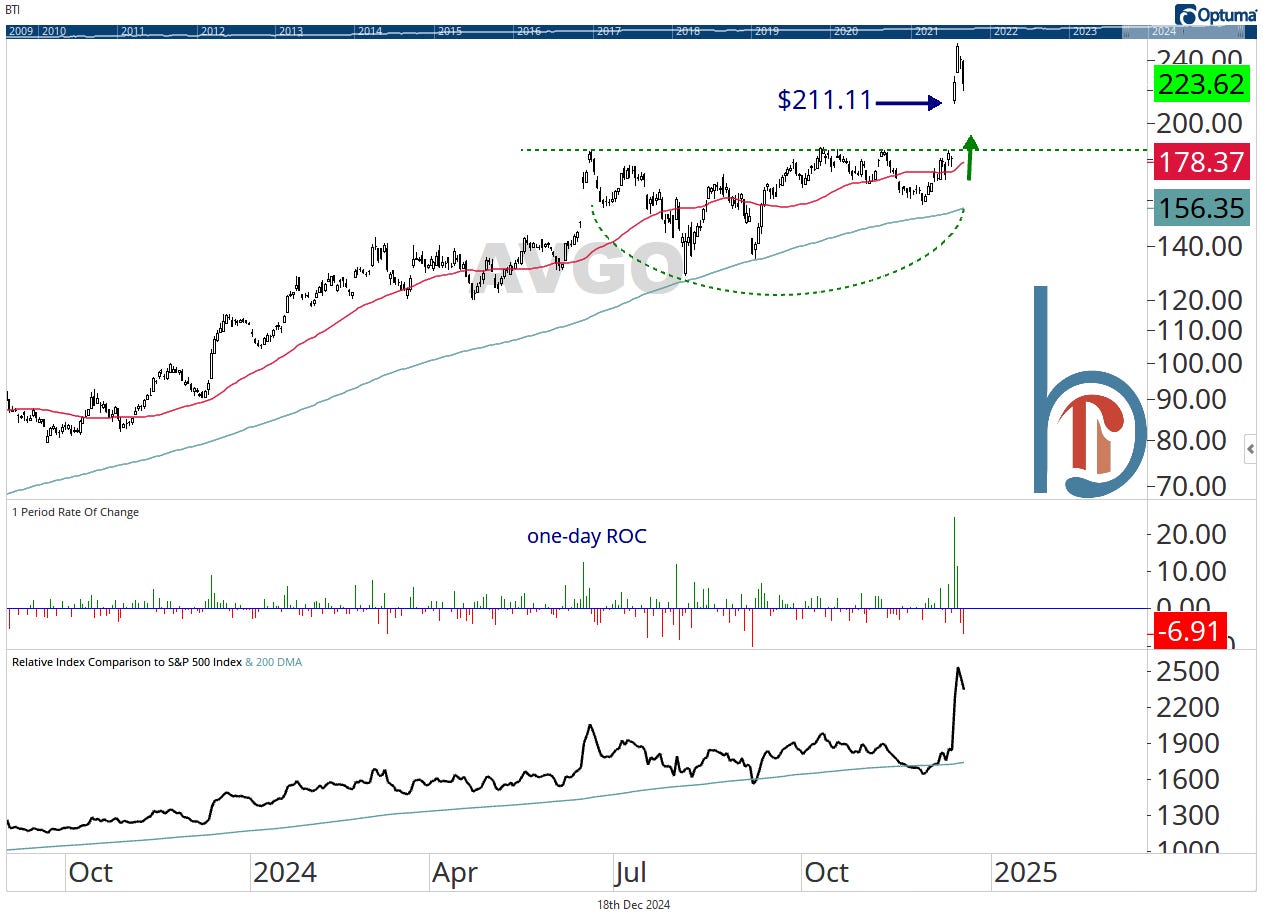
AVGO was our tech basket’s worst performer yesterday, falling 6.9%. It’s a strong chart I would be looking to buy not sell but the tactical risk here is a gap-fill. $211.11 needs to hold to prevent that.
GOOGL: Alphabet

GOOGL is on false breakout alert after slipping back below its July highs. A test of $181 looks likely, $176 would be support after that.
META: Meta Platforms

Switching up the view here. META is a strong uptrend but I would not want to see the $543 tested or breached amid weaker momentum readings. We’re off from our regular publication schedule next week but I will issue stops or profit-taking alerts for our Blue Chip Hot List if necessary. For now, it remains on the list with a 15.5% gain.
MSFT: Microsoft

Microsoft invalidated a potential head and shoulders pattern with a strong run higher but the stock’s relative trend still isn’t favorable. Zone of support 3-5% below yesterday’s close.
NFLX: Netflix

Recent momentum measures were extreme and negatively diverging so a pullback in Netflix was overdue. This is a stock to put on your “watch to buy” list, with a strong uptrend and support from a big base breakout.
