Stock Trends
These small-caps are bucking the trend
Good morning,
The Russell 2000 continues to underperform, rolling over this week at its declining 50-DMA despite posting its strongest week since February 2021 last week. It’s trailing the S&P 500 by more than 14% YTD and frankly shows no signs of turning that relative trend around.
However, as the saying goes, “there’s always a bull market somewhere” and today, I’m highlighting 5 small cap stocks that are bucking the poor trend in the Russell 2000.
These stocks are all:
Above their 50- and 200-DMAs
Outperforming the S&P 500 by at least 5% YTD
And at 50-day highs
The full list is 35 stocks long (and can be viewed here) but I’ve filtered it down to 5 of the strongest.
We’ll also look at:
The rich getting richer
Bases in the tech sector
Energy breaking down
Uranium stocks
and more
These small-cap stocks are bucking the trend
ANF: Abercrombie & Fitch
Wouldn’t have guessed a mall retailer I most associate with being popular in middle school would have shown up first on this list, but here we are. ANF is up nearly 40% since it broke out, but the measured target and trend say there is little reason to bet against it.
BRBR: Bellring Brands
BRBR sells protein bars, shakes, and powders, and based on the chart I’m guessing they have been selling a lot of them. This is a strong uptrend, and until that support line is broken, there is no reason to think it can’t continue higher.
CARG: CarGurus
CarGurus broke out to its highest level since August yesterday. $18.86 could be used as a tactical stop for new money.
MSTR: Microstrategy
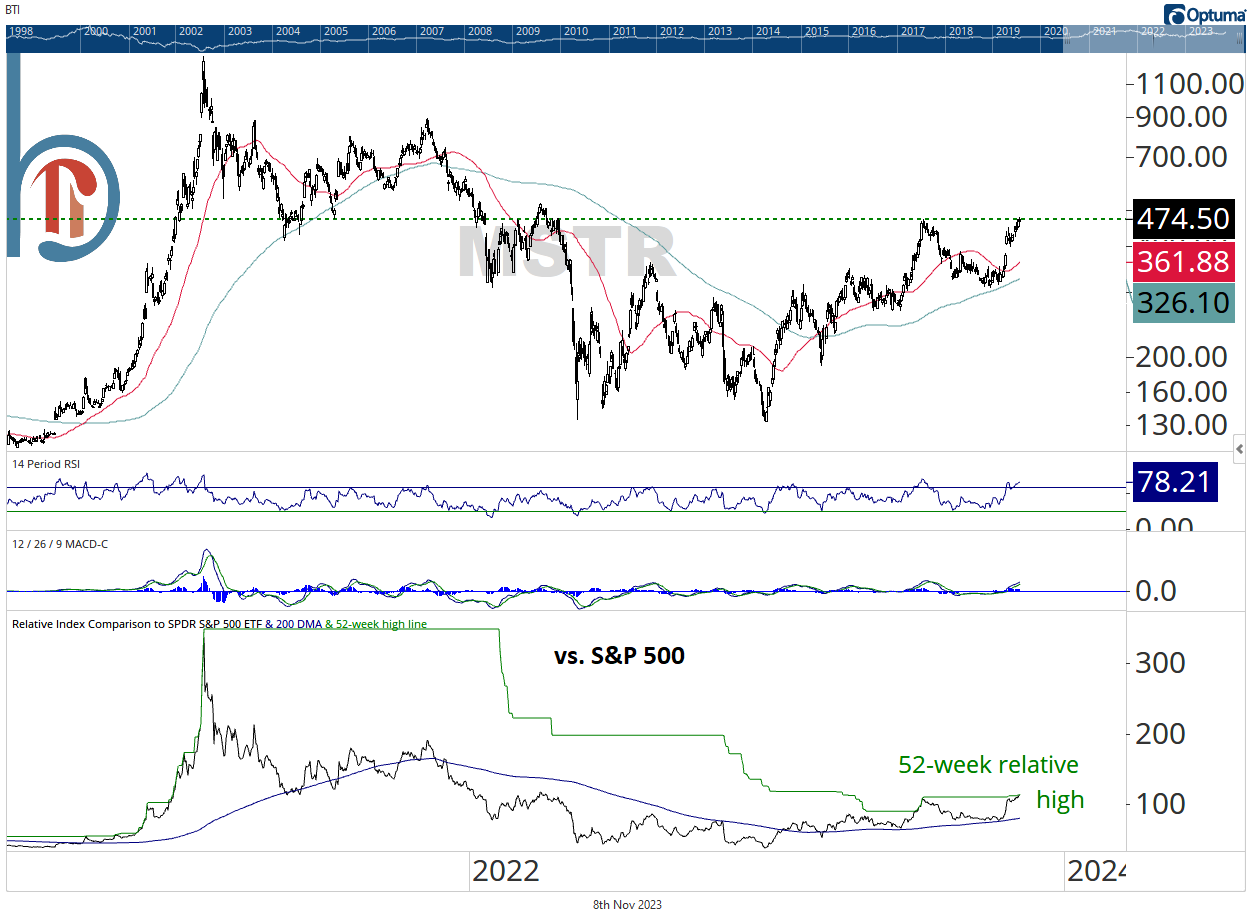
If you aren’t familiar, Microstrategy is a pseudo-bitcoin play, and supposedly the largest corporate holder of bitcoin. Bitcoin broke out in a big way in October, and now MSTR is knocking on the door. A sustained breakout above $475 could unlock a trip toward the mid-$800s.
VVI: Vlad Corp.
VVI broke out of an inverse head and shoulders pattern yesterday. Measured target is $43/share.
The rich get richer
Microsoft keeps on keeping on
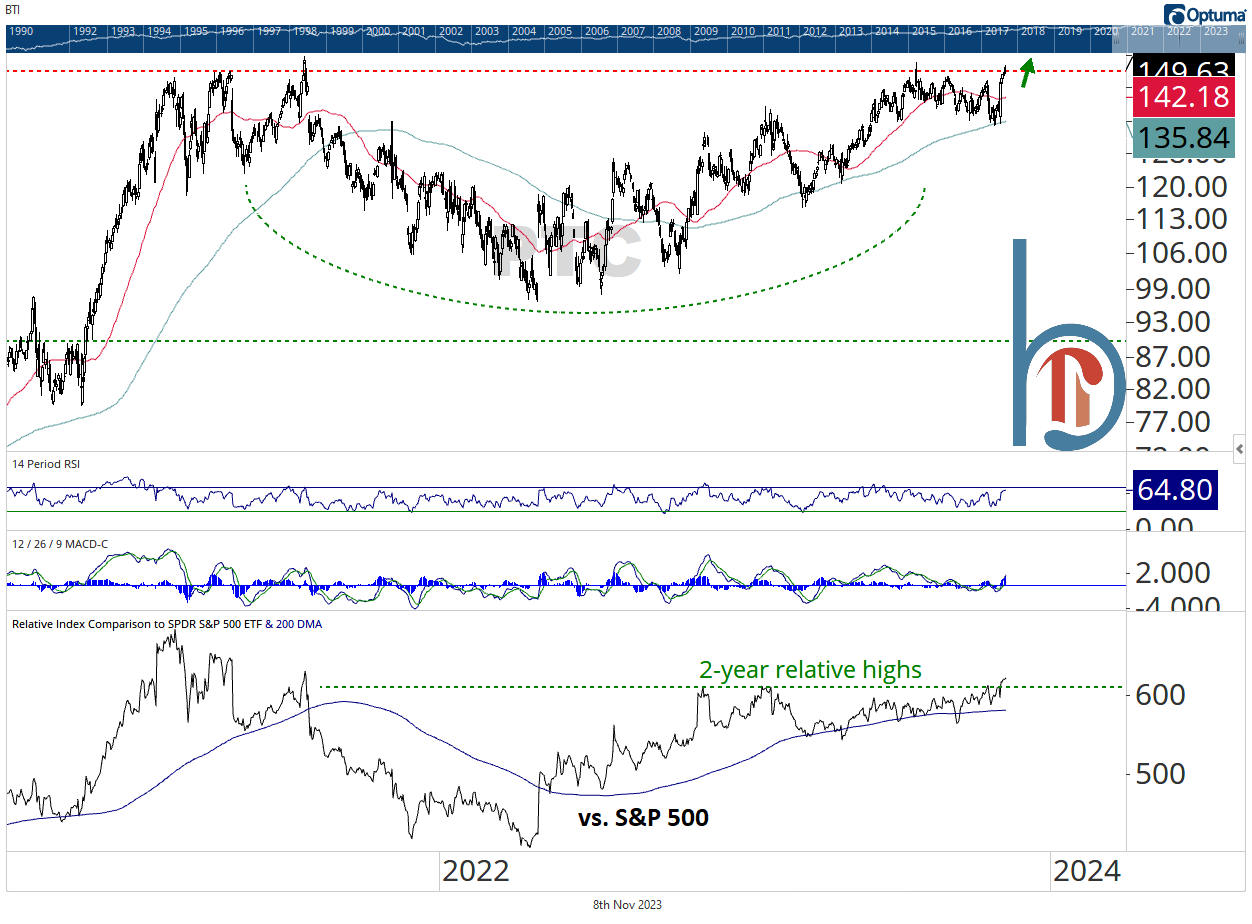
Blue Chip Hot List holding Microsoft is now up 9 days in a row, tied for its second-longest streak ever. The one time it got to 10? All the way back in 1987. Technically, there isn’t much to say. It is one of the strongest stock in the market, and looks to be just now breaking out of a 2-year base.
Is Amazon becoming leadership again?
Amazon stock has had a rough few years, but may be turning a corner. The stock just hit its first 52-week relative high since July 2020. In absolute terms, the stock just needs to clear resistance at $145 and then the discussion can turn to all-time highs.
Apple makes a higher high
Apple has held that green support line throughout this correction, but hadn’t been able to break the string of lower highs. It has now. This week’s move is a significant technical development and the stock is now on the verge of making a 3-month relative high (green line in bottom panel).
Checking back on those tech bases
IT breaks out
Gartner has powered higher this week, impressive follow-through after last week’s breakaway gap. This base measures $100 higher, to just over $500/share.
New relative highs for PTC, absolute ones next
PTC just broke out of a huge base vs. the S&P 500, and now I’m betting the absolute ones are next. The stock is just $4 away from doing just that.
ROP breaks out
ROP has broken out the last two days and is now officially in breakout mode. A super tight stop could be the breakout point (call it $504) but even the last swing low ($474) is only about 7% below yesterday’s close if you want to give it a bit more leash.
Energy is breaking
SLB breaks the neckline
SLB completed a head and shoulders top pattern on Tuesday and if we’re still below $55.50 at Friday’s close, it will be removed from the Hot List Monday. The stock did print a doji candlestick (a potential reversal signal) yesterday, but that is meaningless unless confirmed by an up day today.
MPC close to our stop
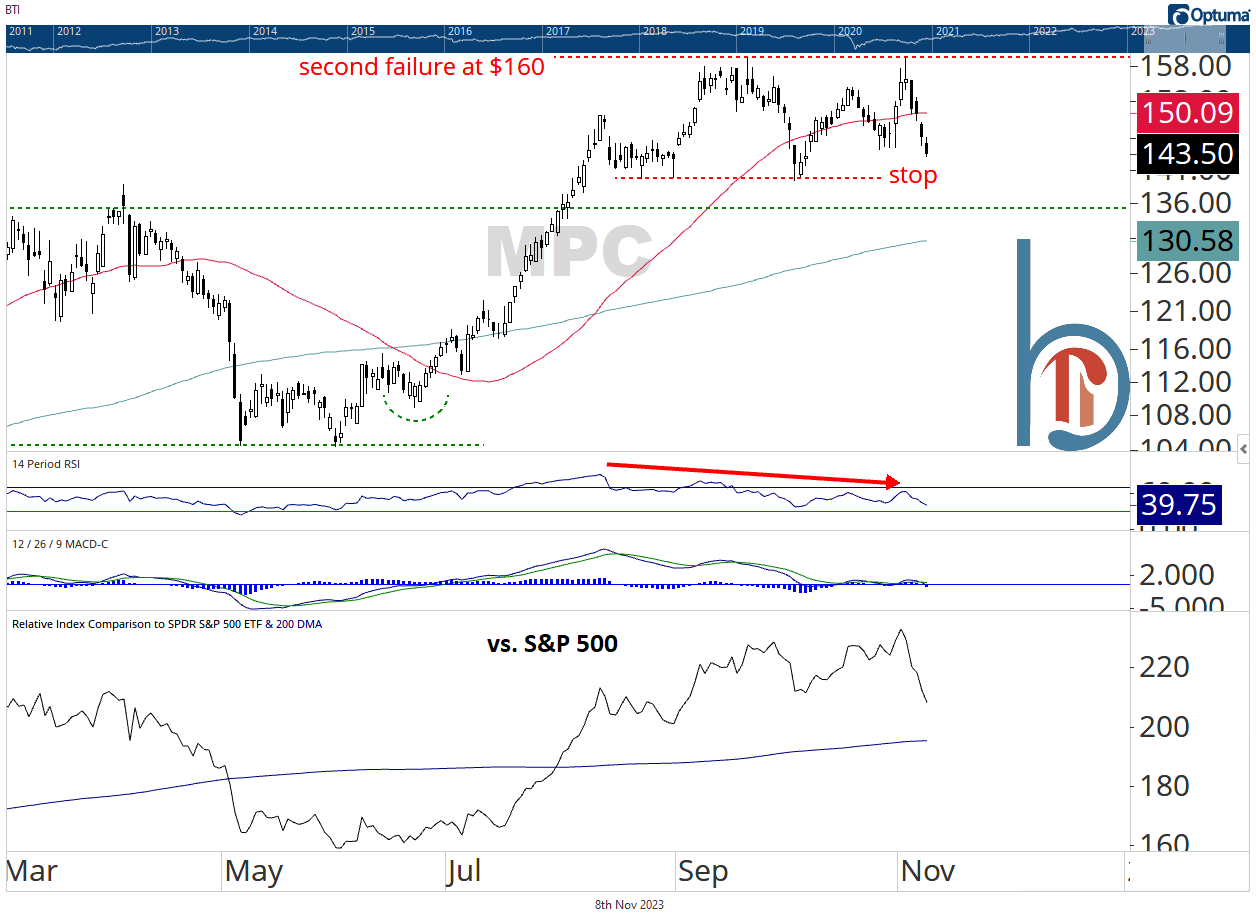
MPC has been a relative outperformer among our energy positions, hitting a 52-week relative high as recently as last Wednesday. Still, the stock needs to hold recent lows just above $139 or we’ll be out.
Phillips 66 fails at $118
Just last week, our update showed PSX breaking above its mid-October highs, but the stock failed at the $118 level and is now headed lower. Our stop is the October lows and what looks to be turning into the neckline of a H&S.
Is the Exxon trend changing?
XOM isn’t on our Blue Chip Hot List, but I am closely watching its reaction here with regards to our sector positioning. Ever since energy bottomed in 2020, a 3-month low (or even getting close to it) for Exxon has marked a tactical low and sparked a rally. We’re making a 3-month low now, but the difference is Exxon hasn’t made any upward progress in a year…
Will uranium be the last to fall?
CCJ on false breakout alert
Cameco has been a strong uptrend and one of the leaders of the uranium trade. But the stock is back below its September highs, confirming dual bearish momentum divergences. A break of the uptrend line would be the nail in the coffin for one of the last bright spots within energy.
Lower high at resistance for NexGen Energy
NXE is a strong-looking base long-term, but the stock just made a lower high at the same time CCJ’s breakout was failing. A break of the uptrend line that goes back to May would hurt the case for a breakout happening anytime soon.
Other noteworthy charts
Spotify trying to hold above $160 this time
After a false breakout in the summer, SPOT is back on the right side of $160. A run toward $200 looks possible.
52-week high for ORLY
Auto repair shop ORLY is breaking out of a 5-month base, something I view as a positive for our thematically-related Hot List holding, Copart.
52-week low for Newmont
52-week lows for the world’s largest gold miner are not exactly screaming to me that gold prices want to break out.
Thanks for reading,
Scott
Scott Brown, CMT
Founder, Brown Technical Insights
Essential insights into market trends, technicals, and opportunities


