


Good morning,
The thing I love about this business is it’s dynamic. It’s always changing, whatever you say or think could be catastrophically wrong five minutes later.
The thing I hate about this business is: The same thing.
Yesterday around 7:00 pm ET, I was putting the finishing touches on this report, and the last step of editing it is to send myself a test email. As I was waiting for it to arrive, I quickly checked the front page of the Wall Street Journal and saw this:

OH, COME ON!
Now, luckily, the first third of this report was already going to be focused on the AI trade, but obviously, we’ve got some new information to incorporate.
In the spirit of intellectual honesty and an unbiased view of the chart, I’m going to show you exactly what I had written about Nvidia before this. And the news doesn’t really change what I wrote for any of the other stocks. But we’ll break down a little further how to think about some key levels today.
We’ll also review:
Nine bullish bases
Additional comments on stocks that just missed the Hot List
Hot List updates
and more!
Nvidia: What I wrote before the news broke
Spy-gate plus other misbehaving semis
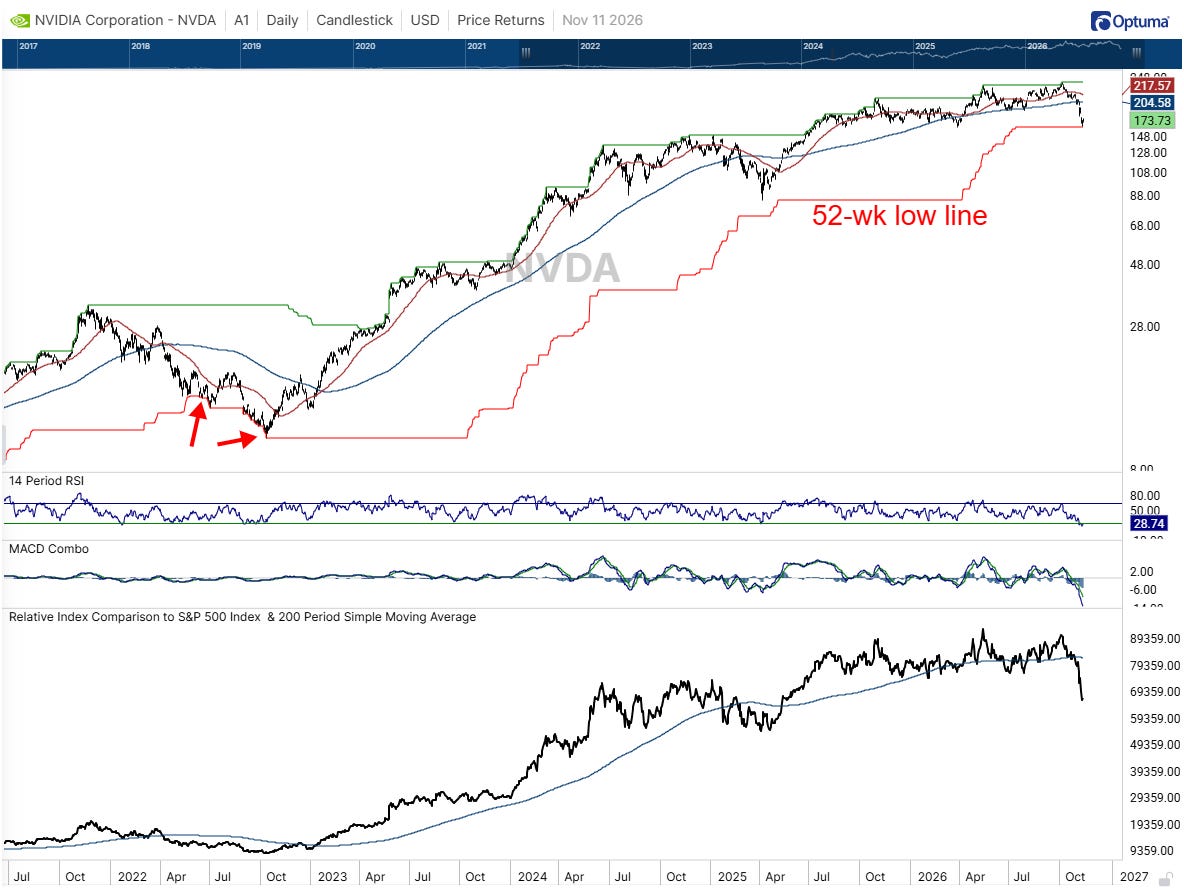
NVDA within a hair of its first 52-week low since 2022
$164.27 is that magic level, which is also its last line of near-term support 👇
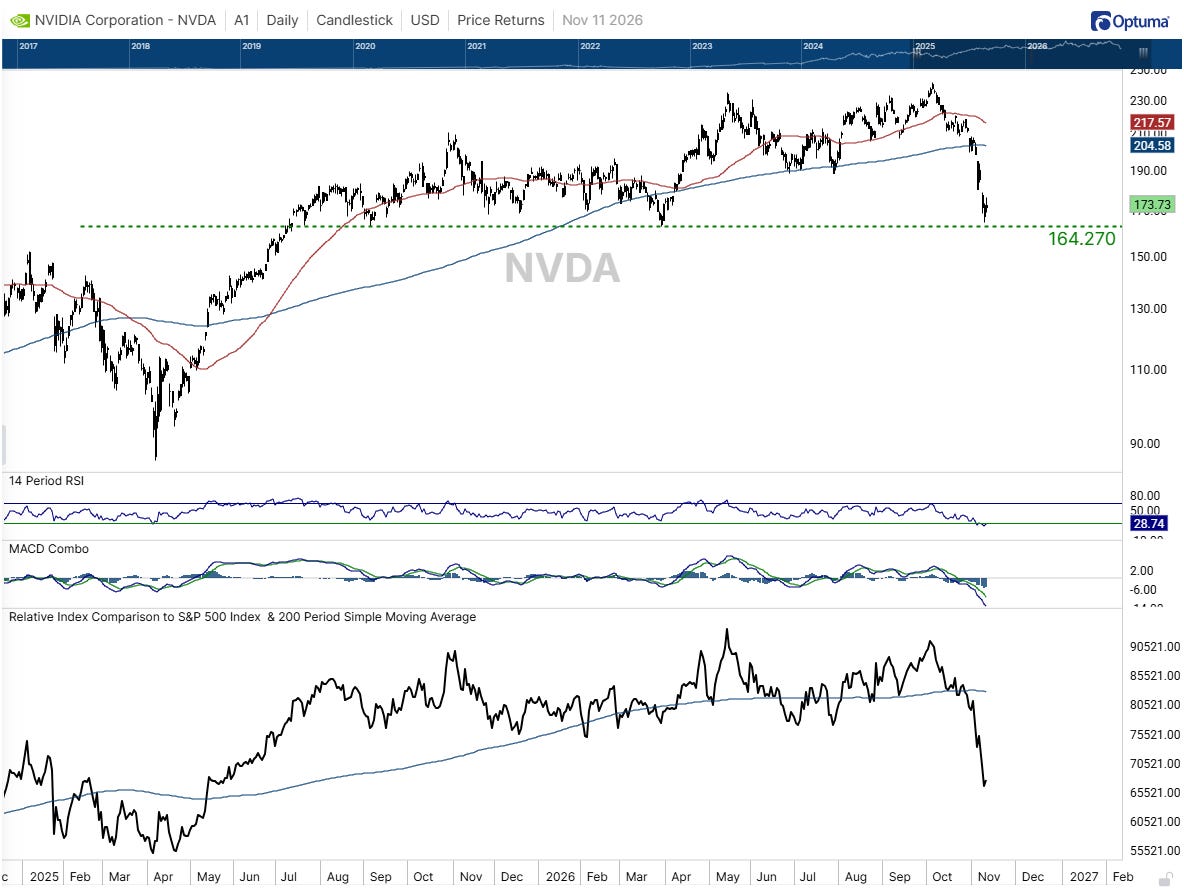
Risk to $140 if it breaks, though I think the more likely next move is a bounce that fails.
Nvidia: What I think now
Basically the same minus the bounce
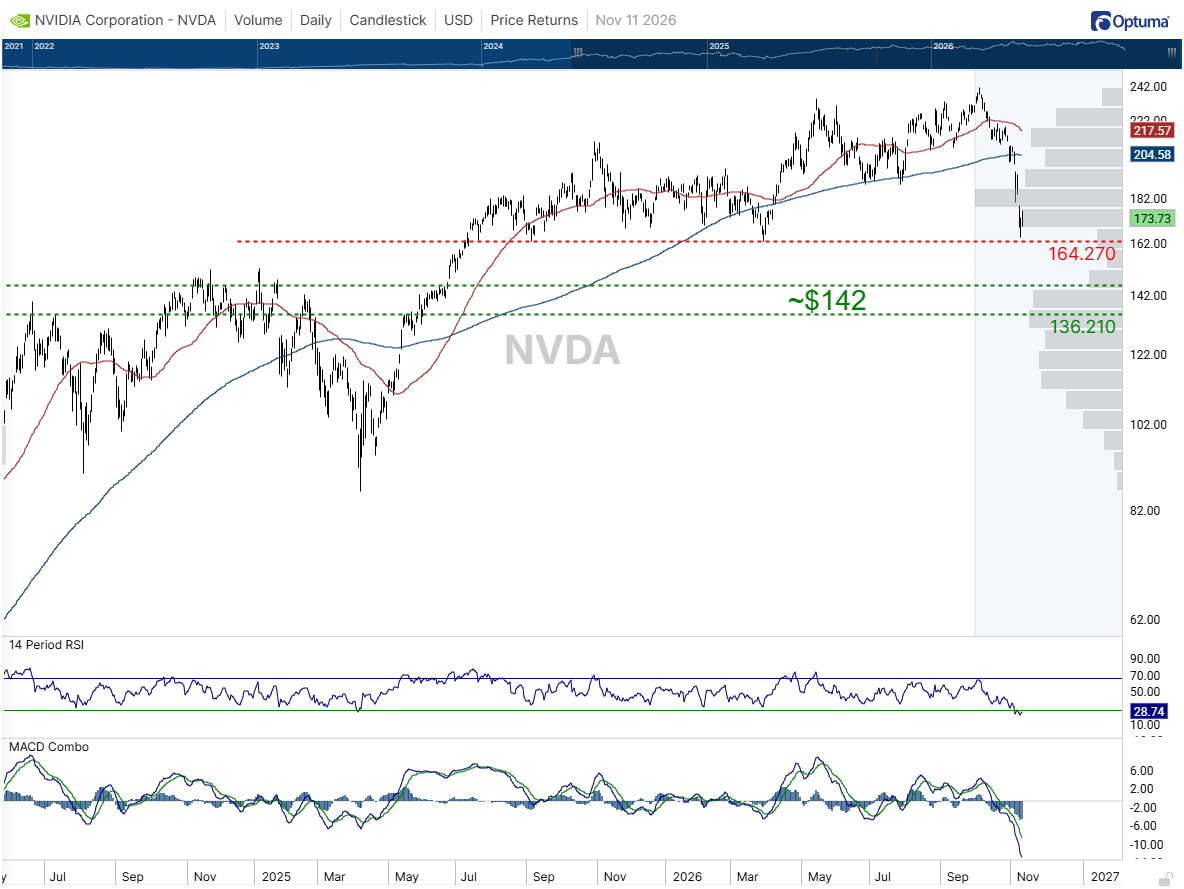
Nvidia is down 7% premarket to ~$161. That would break support, though I’m a little intrigued that it’s so close to the line. Interesting if we close above $164; otherwise, there’s a volume pocket just below that implies a move to the range near $142.
Other top semiconductors
Not buying the Broadcom as a beneficiary trade
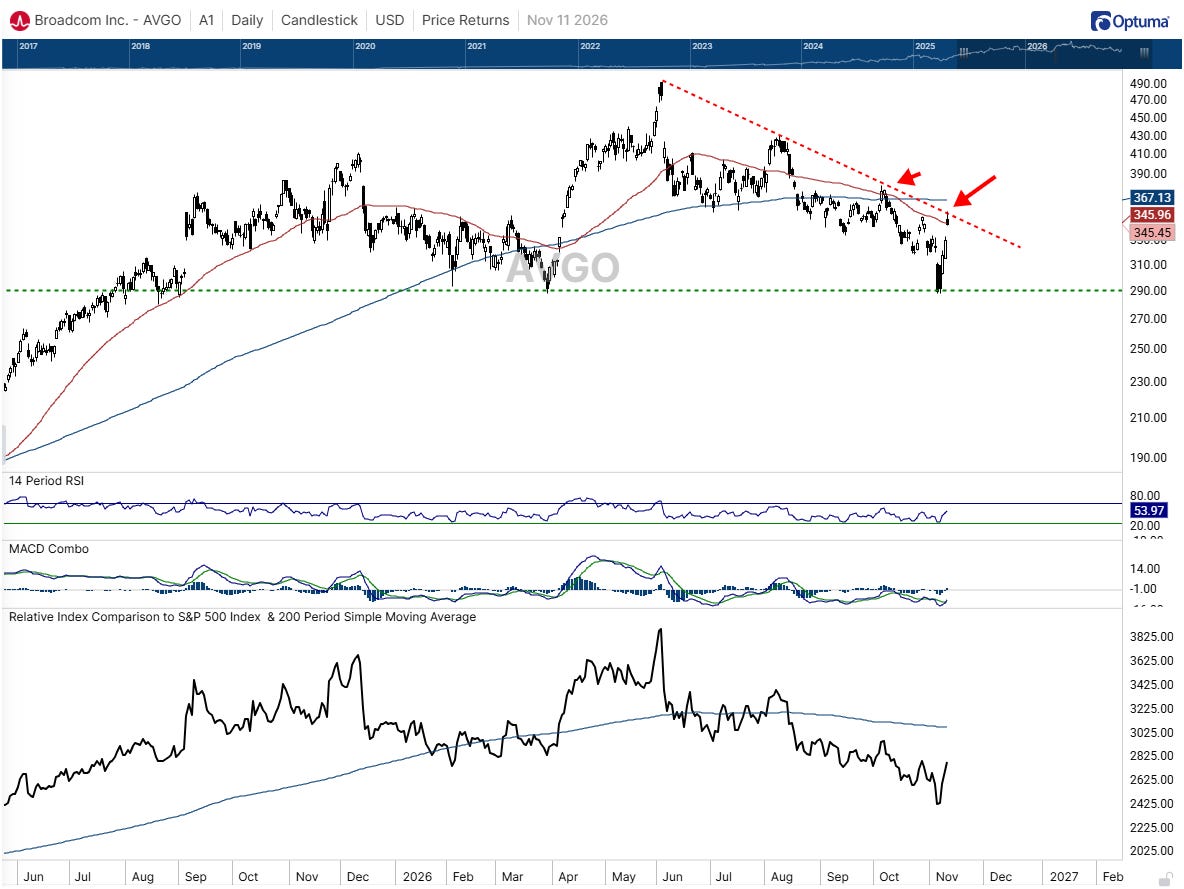
Broadcom was up 4% Wednesday and added an additional 2% after the Jensen news broke last night. I’m not saying it couldn’t be a net positive fundamentally. But the chart looks basically the same as Nvidia, albeit two more days into a bounce, and is now up into a plethora of resistance.
Taiwan Semi is a broken chart
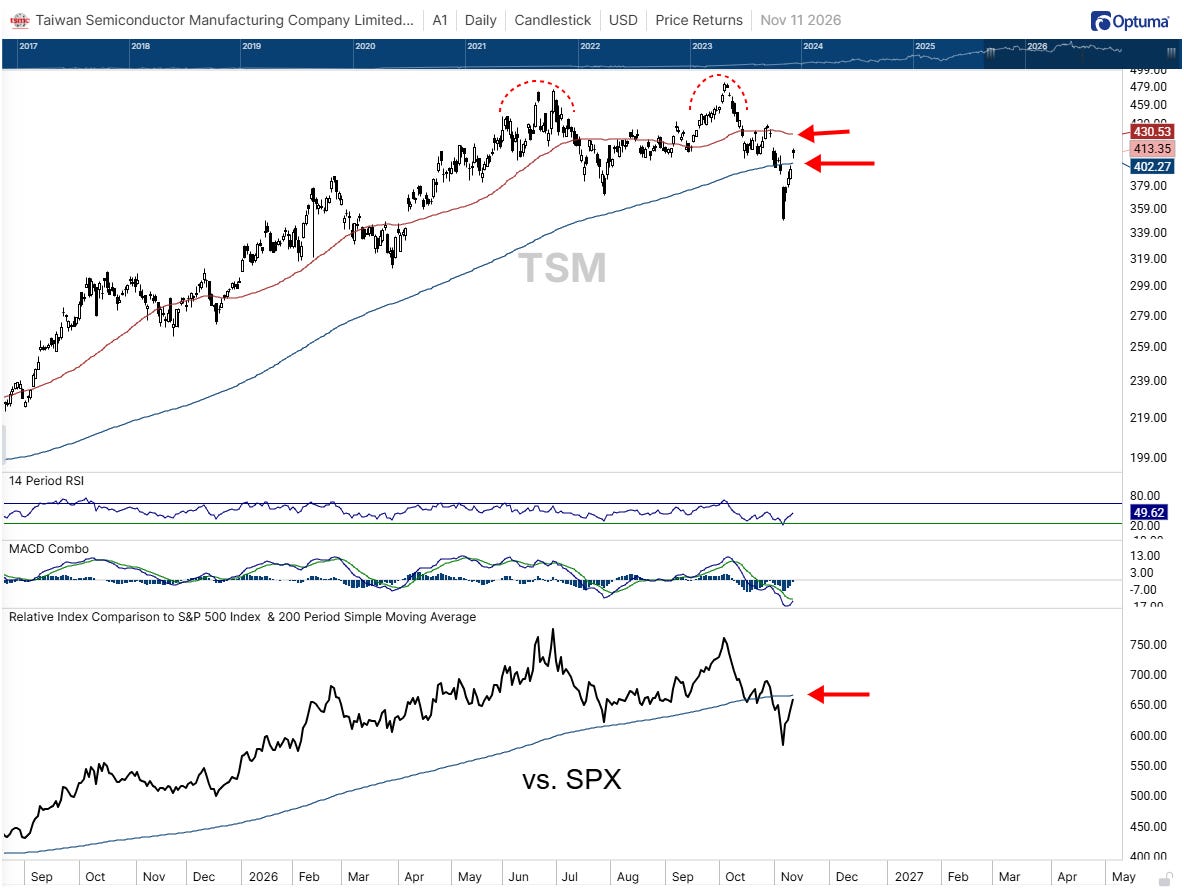
It got back above the 200-day with yesterday’s 4.3% gain, but these completed tops often see snapbacks that go beyond the neckline. I’m a seller of this rally in TSM.
