Stocks: The Good, The Bad, and The Ugly
September 22, 2022
Welcome, to the final publication of the week, Stocks: The Good, The Bad, and The Ugly. I like simple, straightforward analysis (and Western movies) so I hope this theme leaves no questions as to my views about stocks I cover. Every week, paid subscribers will receive this report with analysis on at least 20 individual equities.
However, since this is my first week and I want to make a good impression, let’s do 33! One good, one bad, and one ugly chart within each of the 11 S&P 500 sectors.
A quick note, that “ugly” when it comes to the technicals means there isn’t a trade. These stocks either have no clear trend or find themselves overextended to one side or the other and offer poor risk/reward trades that we want to avoid on both the long and short side.
Lastly, if you have been following along all week, thank you for being here. If you have signed up for a paid membership or are considering one, an extra thank you for your support.
First up, given the volatility today, I think it makes sense to quickly address the S&P 500.
The S&P 500 was rejected decisively at the key 3900 level, posting its lowest daily close since June 30. Two month lows, amid an ongoing bear market and still below the downward sloping 200-day moving average shows the bears remain in full control of the headline tape.
That doesn’t mean there aren’t opportunities on the long side, but right now the name of the game is defense, and my comprehensive review of every stock in the S&P 500 yields far more ugly and bad charts, than good ones.
Technology, The Good: ENPH
ENPH was featured in yesterday’s edition of The Deep Dive, which you can read here. Unfortunately, I featured 5 technology long ideas in that report, and the sector is too weak to find a chart I didn’t already feature. Nevertheless, long and strong if above $275.
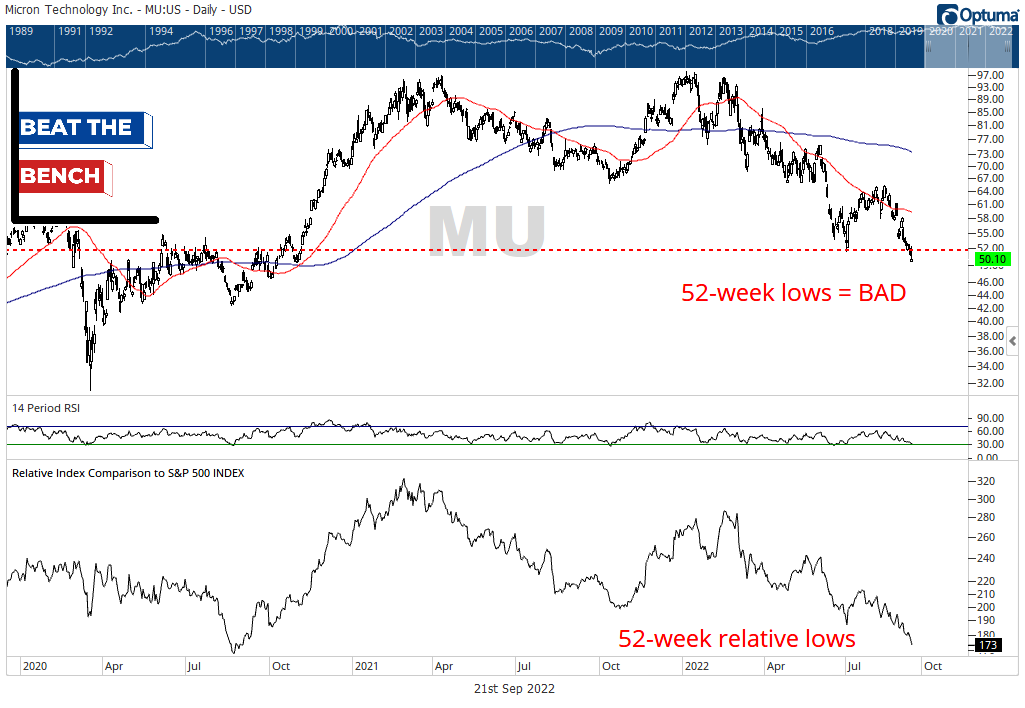
Technology, The Bad: MU
So many to choose from here, but for a true short setup, something that just broke to new lows gives you something to shoot against. A stock hitting 52-week absolute and relative lows, in a weak group is absolutely: BAD.
Technology, The Ugly: IBM
Ugly is a permanent state of mind for IBM stock, but this year has actually led to some relative strength. Nevertheless, the top panel of this chart epitomizes what I mean by: Ugly. A trendless, untradeable mess.
Communication Services, The Good: ???
Sorry, there are no good charts within this sector. A lot of people might point to the relative strength that T-Mobile (TMUS) has shown so far this year, especially juxtaposed to Verizon and AT&T, but trading just below absolute and relative resistance, I hate the entry point. TMUS is just Ugly.
Communication Services, The Bad: VZ
So many to choose from here, but sitting at relative lows and breaking decade-long support near $43, VZ is my choice for Bad within comm services. If below $43, VZ is a short.
Communication Services, The Ugly: FOX
Having no trend has been enough to be a leader within communication services (it just hit 6-month highs vs. XLC), but FOX is going to have to make a decision soon. Either up through its 200-day moving average, or lose trendline support back to the spring of 2020.
Consumer Discretionary, The Good: GPC
I wanted to choose AutoZone because I was there yesterday (my purchases were anything but discretionary), but GPC (the owner of NAPA Auto Parts) is the better chart. $144 is the stop-loss to use for new money, but a chart making multiyear relative highs and sitting just a hair off all-time highs deserves our attention.
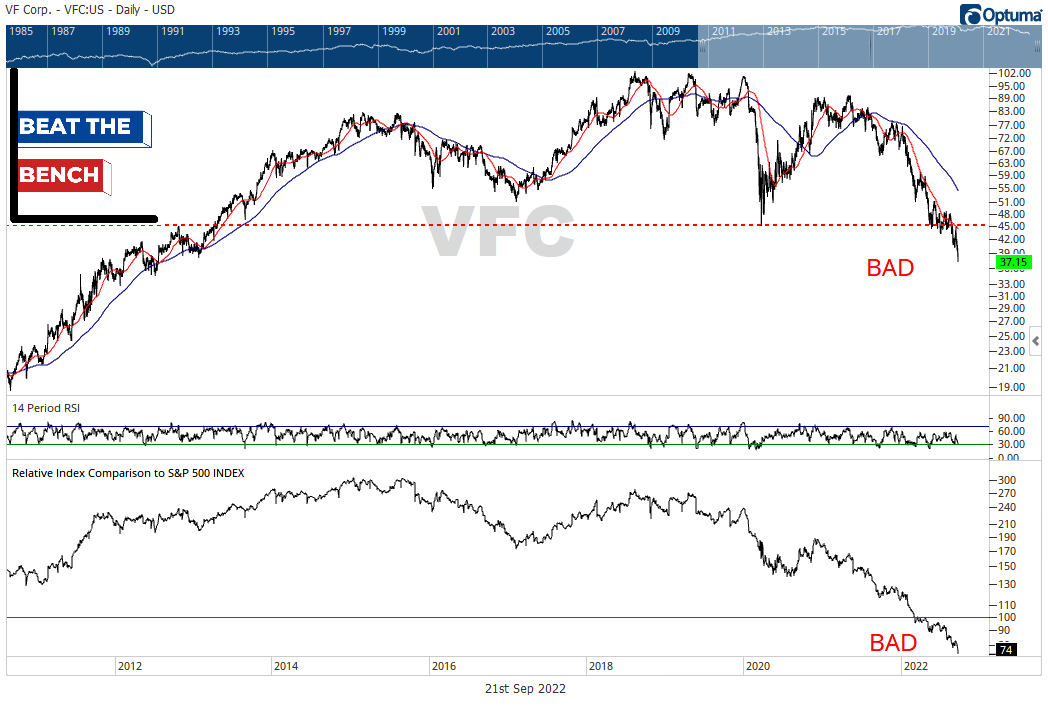
Consumer Discretionary, The Bad: VFC
Lots to choose from in this sector as well, but trading below its Covid-lows is an exclusive club that VFC (the maker of North Face) finds itself in. That level (~$45) is the stop-loss for shorts, on a stock sitting at 52-week absolute and relative lows.
Consumer Discretionary, The Ugly: CCL
The trend in CCL is far too poor for me to like it on the long side, but it would be imprudent to ignore the stand this stock is making at its Covid-lows, and the modest relative strength over the past two months.
Industrials, The Good: RSG
Republic Services recently broke out from 10-month base and is hitting 52-week relative highs. That breakout point ($140) is your stop-loss for new money.
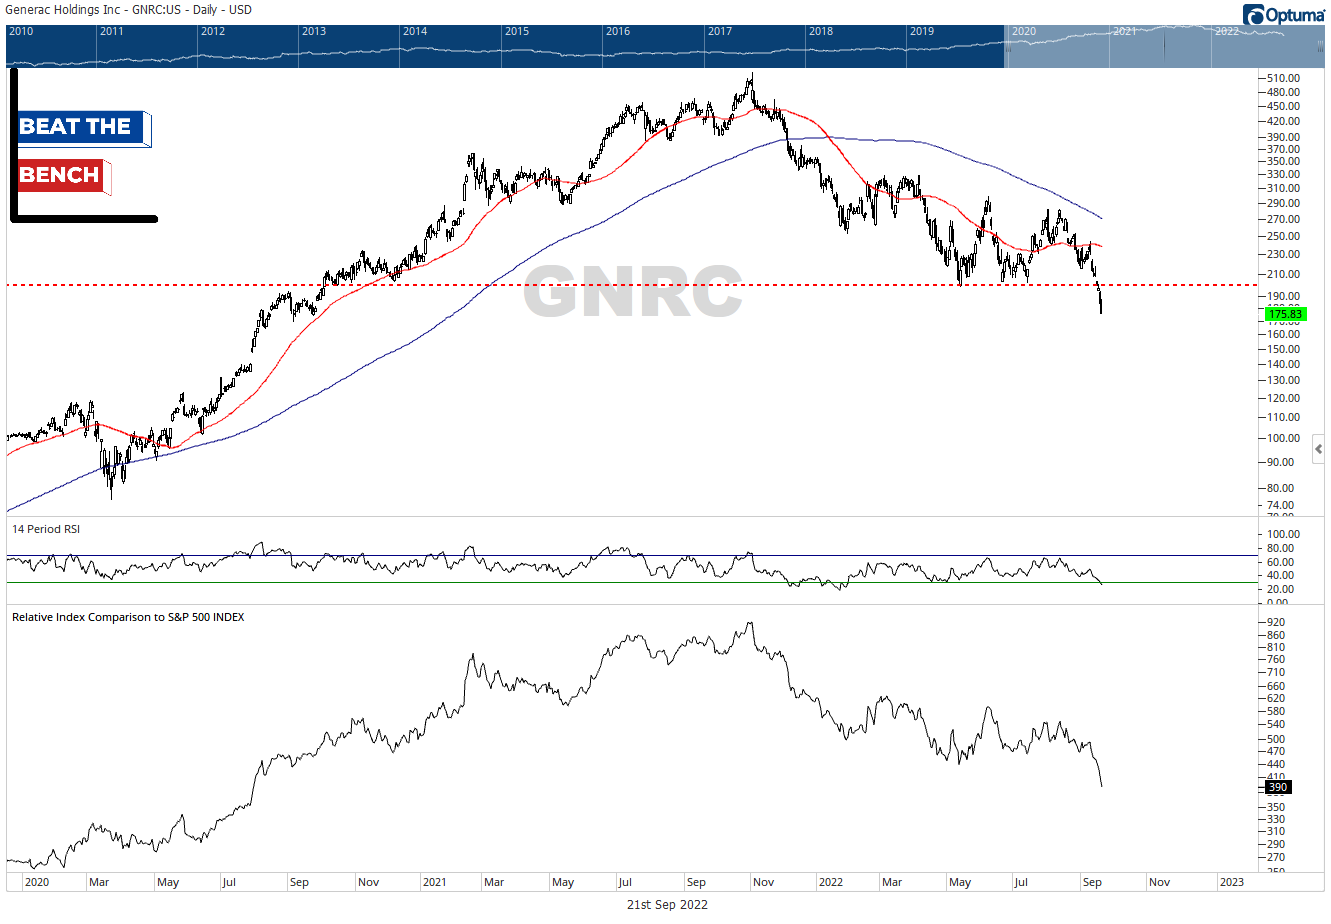
Industrials, The Bad: GNRC
Apparently, nobody wants to buy a generator these days. GNRC is a short below $200, and at the very least a stock to not touch with a 10-foot pole.
Industrials, The Ugly: URI
United Rentals isn’t doing anything special in absolute or relative terms, and doesn’t look likely to add alpha to your portfolio anytime soon.
Materials, The Good: ALB
Hometown stock here. Albemarle is based out of Charlotte, NC and is a frequent feature of articles with titles like “Here’s How to Profit from the EV Revolution!”. I don’t know about all that, but ALB is on the verge of breaking out from 10-month base while hitting 52-week relative highs. It closed at $285 on Wednesday, ideally it can get and stay up above $290.
Materials, The Bad: PKG and SEE
I couldn’t find a good one for comm services so here are two bad materials stocks. PKG is a sell if below $126 and SEE doesn’t have support until $38. On the macro level what are these stocks saying about the outlook for packages and consumer goods? Maybe the same thing as Wal-Mart is hinting at:
Materials, The Ugly: MLM
Martin Marietta Materials bounced strongly off its pre-Covid highs in early July but remains below a downward sloping 200-dma. No relative trend vs. the S&P 500, the next 10% move in this stock is anyone’s guess.
Energy, The Good: DVN
DVN remains a relative leader within energy and has managed to bounce back better than most vs. the S&P 500. Still above a rising 200-dma in absolute terms, if you are determined to buy energy stocks, Devon Energy is worth a look.
Energy, The Bad: BKR
Baker Hughes really tells the story of energy. It still has relative strength vs. the S&P 500, but the absolute chart has completely broken down. If BKR is below $26, I continue to think it works lower.
Energy, The Ugly: PSX
Phillips 66 is still holding its one-year uptrend line, but my overall view of the sector suggests it may not for much longer.
Financials, The Good: MET
MET is hitting 52-week relative highs and continues to build a large base above its pre-Covid highs, despite the bear market. It may take the market to turn around for MET to break out, but if it holds $57, an eventual upward breakout seems like the more likely scenario.
Financials, The Bad: MKTX
Most financials have exhibited some degree of relative strength throughout the summer. MarketAxess has not. Sell rallies if below $250.
Financials, The Ugly: BLK
BlackRock is the single stock most correlated with the S&P 500, and it offered up some clues about the late-summer rally when it managed to hold its May lows. However, like the S&P 500, it was rejected at its 200-day moving average and now looks set for a retest. If you are just here for the macro/big picture stuff, BLK holding above $575-580 it would be an important bullish message for stocks overall.
Healthcare, The Good: CAH
Cardinal Health just broke out of a 3-year base and is hitting 52-week relative highs. New money can use the breakout point of $63/share as a stop loss.
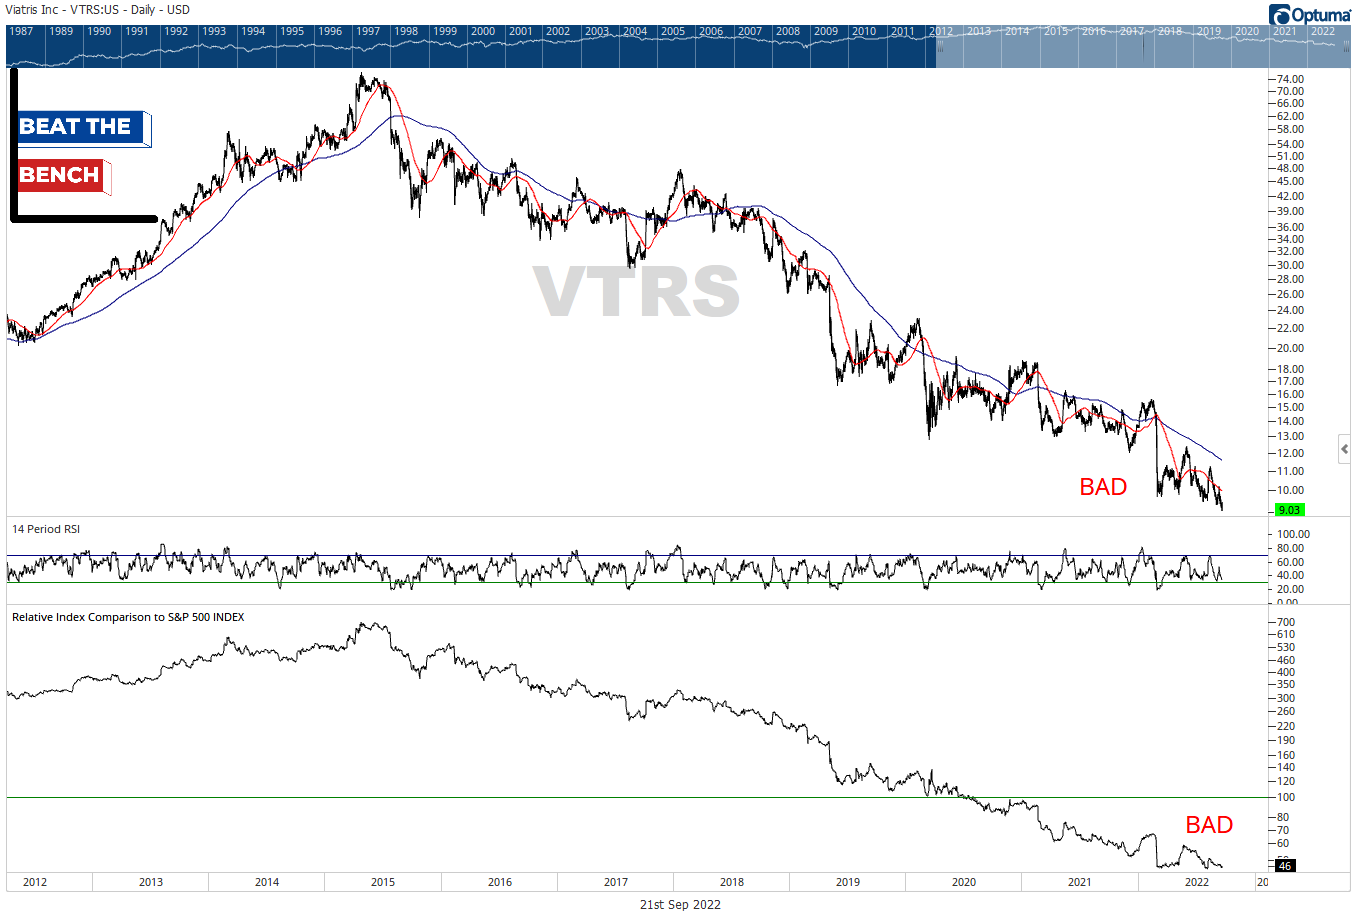
Healthcare, The Bad: VTRS
I don’t know what Viatris does, but I’m guessing they don’t do it very well. Avoid VTRS.
Healthcare, The Ugly: MRNA
My expectation is that Moderna breaks support at $118 and completes an absolutely massive top. But it hasn’t yet, so support must be respected. However, break that neckline and this is going straight into the BAD category.
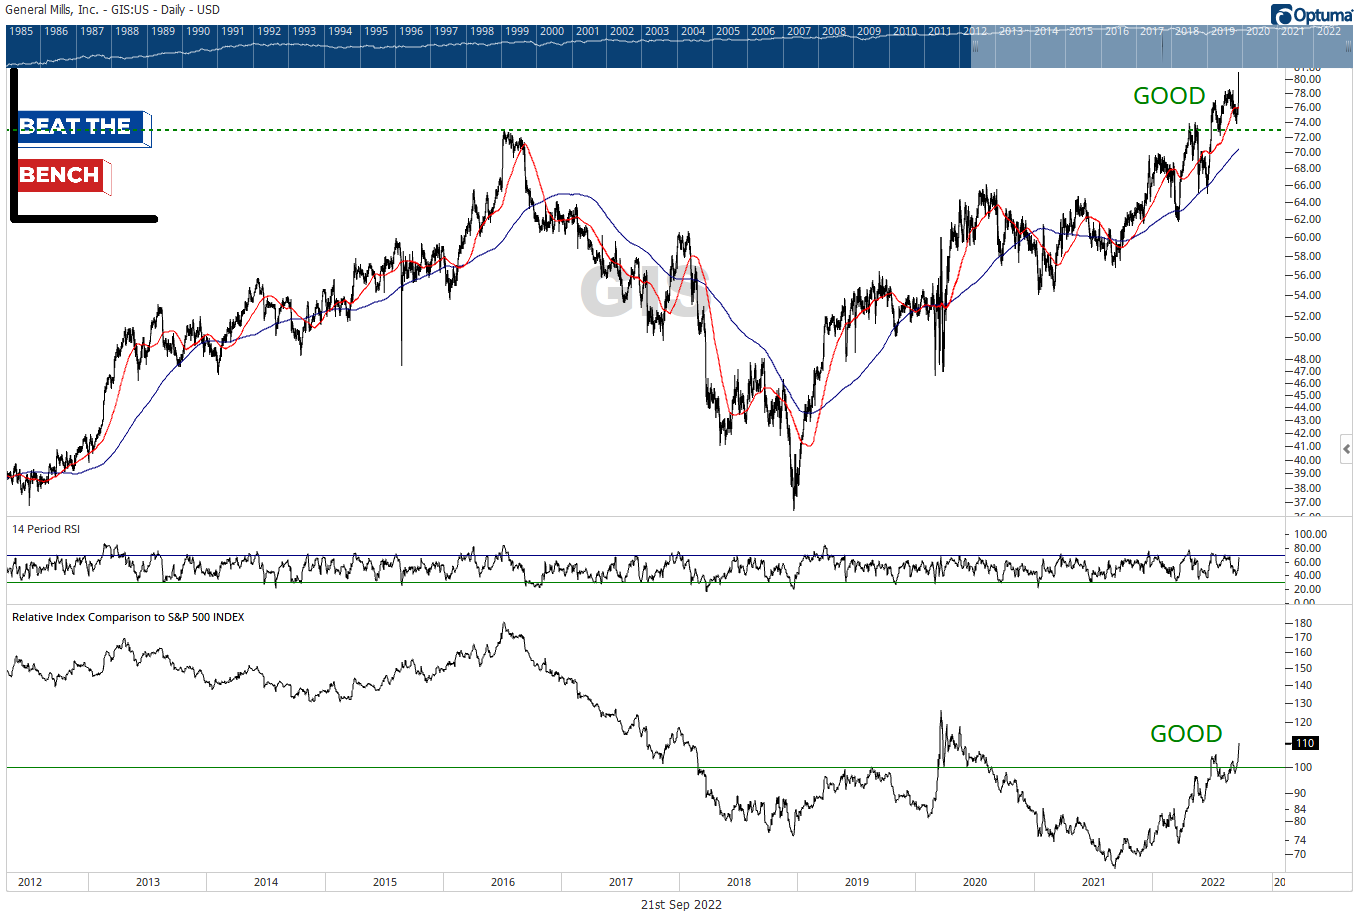
Consumer Staples, The Good: GIS
Six-year breakout for General Mills is now complete. Relative leader and hitting all-time highs today, despite the broad weakness.
Consumer Staples, The Bad: CHD
Church & Dwight has fallen apart since April, breaking major support, and hitting 52-week relative lows. If you are looking for stocks holding up well, this isn’t one of them.
Consumer Staples, The Ugly: SYY
Sysco has exhibited relative strength, but it hasn’t been able to make any upward progress and every time it has hit a fresh high in the past 18 months has been a time to sell. We can do better.
Utilities, The Good: SO
Southern Company has been a consistent leader within the utilities sector so far this year, so it should be no surprise to see it at multi-year relative highs vs. the S&P 500.
Utilities, The Bad: EXC
Exelon hasn’t exhibited any relative strength vs. the broad market since May and is breaking below its 200-day moving average. Recent death cross formation for the chart vs. XLU (not shown).
Utilities, The Ugly: ES
Eversource Energy looks like what people thought their bond funds were supposed to look like. Going nowhere fast, in either direction. 2.9% dividend yield.
Real Estate, The Good: VICI
VICI Properties is on false breakout alert, but is a clear relative leader within real estate.
Real Estate, The Bad: VNO
Total breakdown for Vornado Realty as it loses its Covid-lows and makes 52-week relative lows. Stay away.
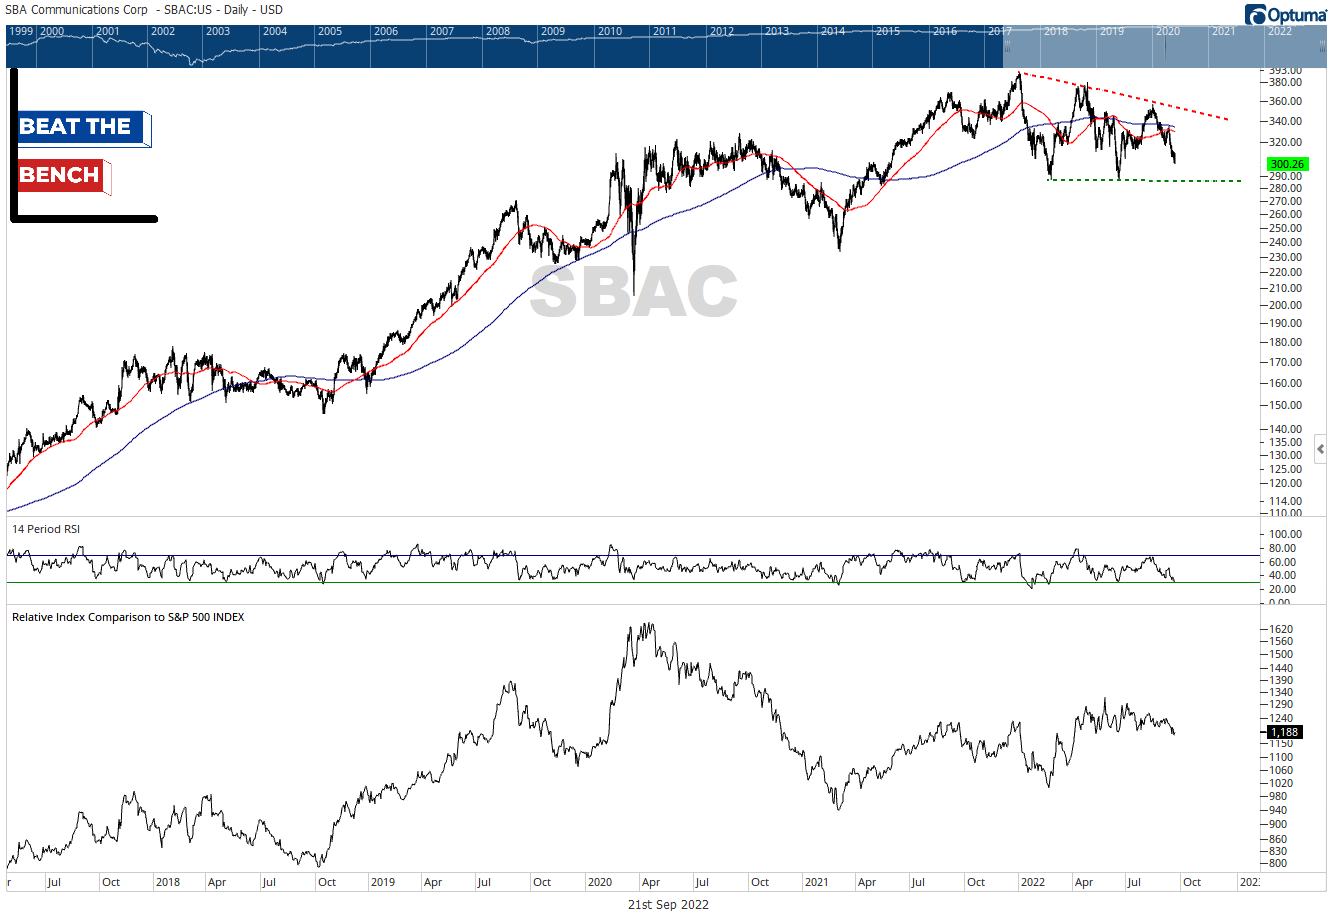
Real Estate, The Ugly: SBAC
All the cell tower REITs have been a trend follower’s nightmare the past few years, and SBAC continues to offer an unattractive chart on both the long and short side. Stuck below a downtrend line since the beginning of the year, but has support that has held since February just 5% below. Not much to see here (or with AMT or CCI).
That’s it for this week! Thank you again for reading, I hope you enjoyed this report. If you know other advisors that would benefit from this individual equity analysis, please share.
Have a chart you want to see featured next week? Throw it in the comments!
Beat the Bench will be back on Monday, with The Monday Morning Playbook and video for paid subscribers. The cost is $79/month or $799 if paying for the full year and there is a 20% discount available for groups of 4 or more.
Scott
Scott Brown, CMT
Founder and Chief Investment Strategist, Beat The Bench LLC


