Stocks: The Good, The Bad and The Ugly
Big bank technicals, Buy List updates and more
Good morning,
Yesterday’s Fed decision and Powell’s press conference looked like it was going to go off without a hitch. Then Janet Yellen opened her stupid mouth again.
After making it clear that the government will evaluate bank rescues on a case-by-case basis (after they have failed of course), the S&P 500 closed down 1.7%, the regional bank-heavy Russell 2000 lost nearly 3% and even the financial-less Nasdaq 100 sank 1.4%.
Yesterday’s action doesn’t change the big-picture sideways range for the S&P 500 but on a tactical basis it leaves us with a lot of ugly candles, and another piece of evidence that risks are mounting to the downside.
While today’s report will attempt to cover some of the most important stocks and themes as I see them, for any stock you may be looking at on your own, yesterday’s intraday highs now likely represent a tactical resistance level to watch.
Today’s report will cover:
Technicals for the largest bank stocks
Broker-dealers that have broken down
Smaller tech names hitting new relative highs
Recent movers on the Concentrated Equity Buy List
Buyable industrials
Materials stocks to avoid
REITs filling up the 52-week low list
and more!
How are those big banks?
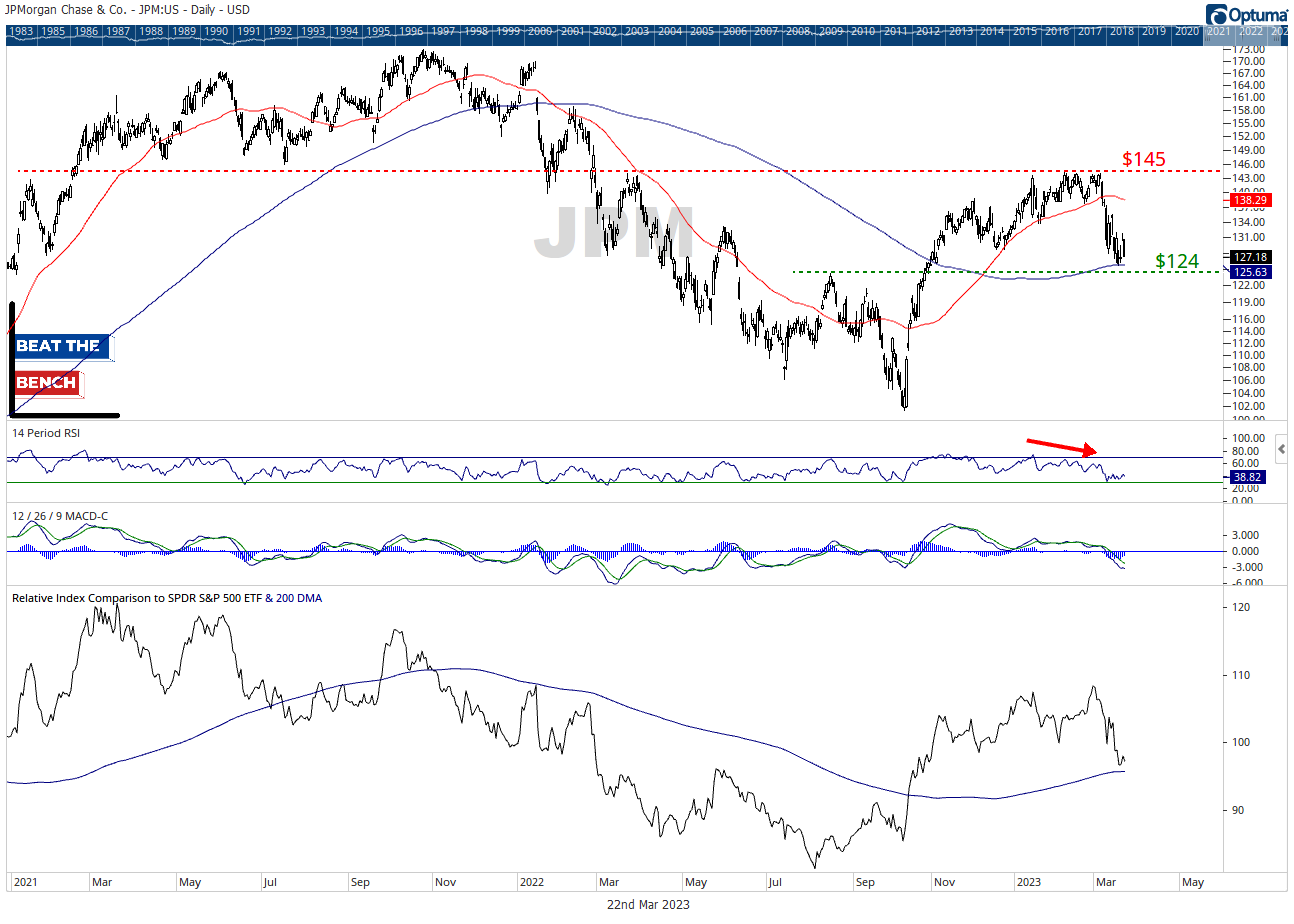
JPM needs to hold $124
JPMorgan has been one of the best stocks within financials, but technically finds itself in no-man’s land. You can see the significance of the $145 level going all the way back to January 2021, and that level remains strong resistance until proven otherwise. For support, we bounced off the 200-DMA on Monday, but have reversed lower the past session and a half. You do not want to be long this name if JPM breaks $124.
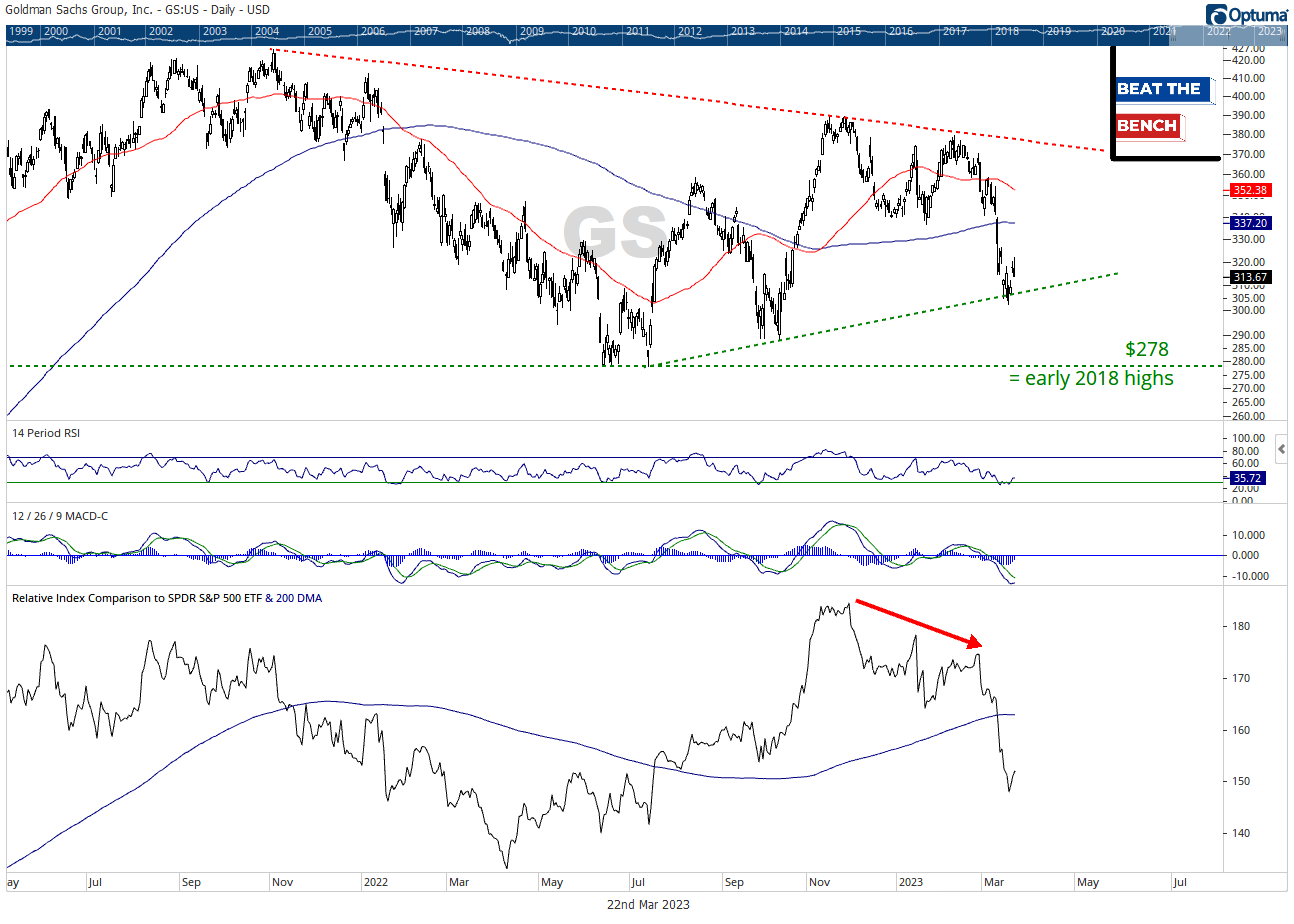
Goldman Sachs bouncing off uptrend line
Goldman Sachs's relative performance didn’t just collapse in March, it topped out back in November, weakening the case for touching this stock. Trying to find support at its uptrend line from the summer lows, but the more important level is $278. Not a stock I would allocate to.
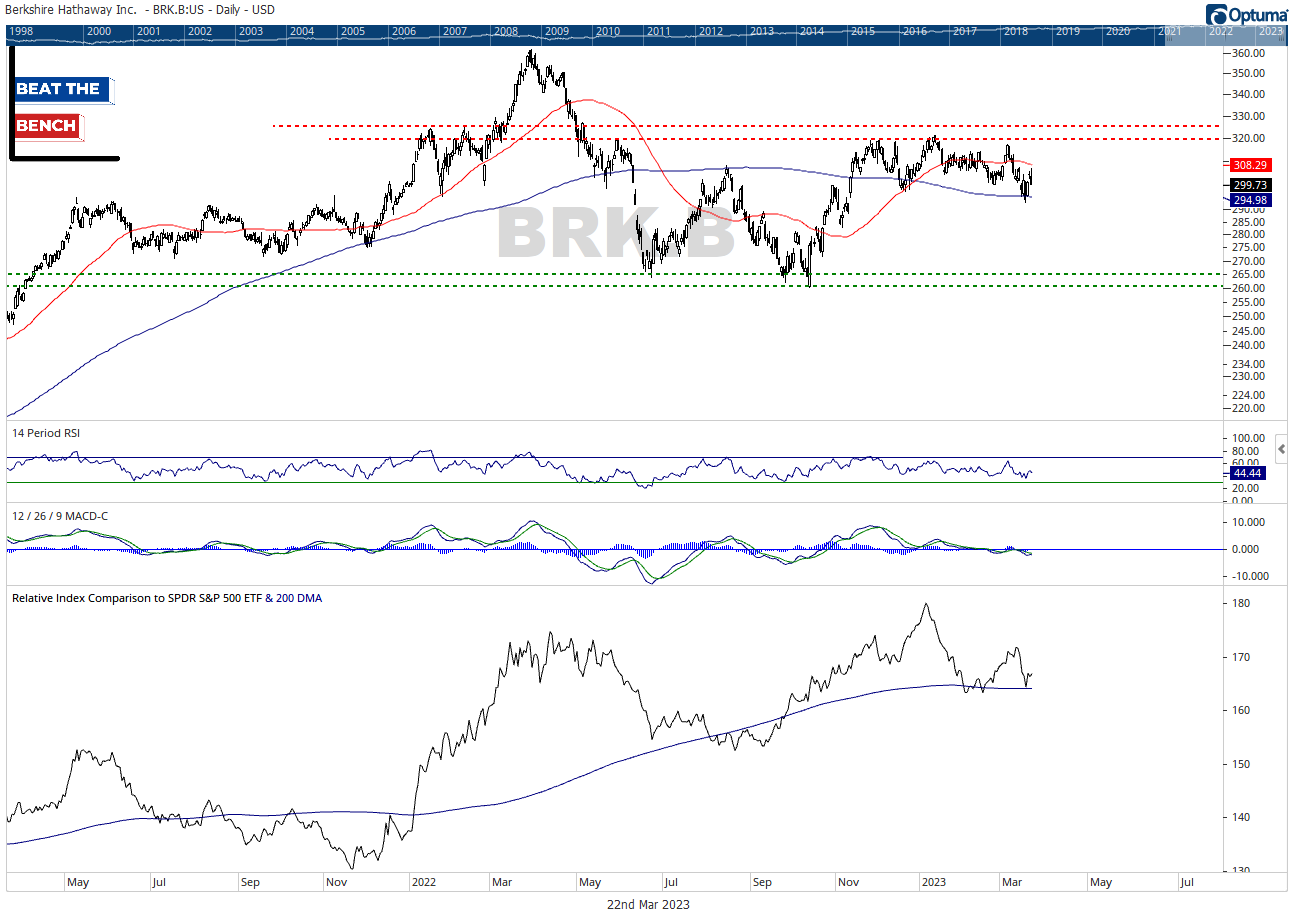
BKR.B trading sideways
Okay, of course, Berkshire isn’t a bank, but it owns a lot of stock and it owns a lot of banks. It shouldn’t be a surprise that it is trading in the same trendless range as the S&P 500 has since May of last year. A move up above $325 would be a huge positive for BRK.B and the market as a whole, while a break of support at $260 would set up the risk of a trip to the pre-Covid highs of $230.
Broken brokers
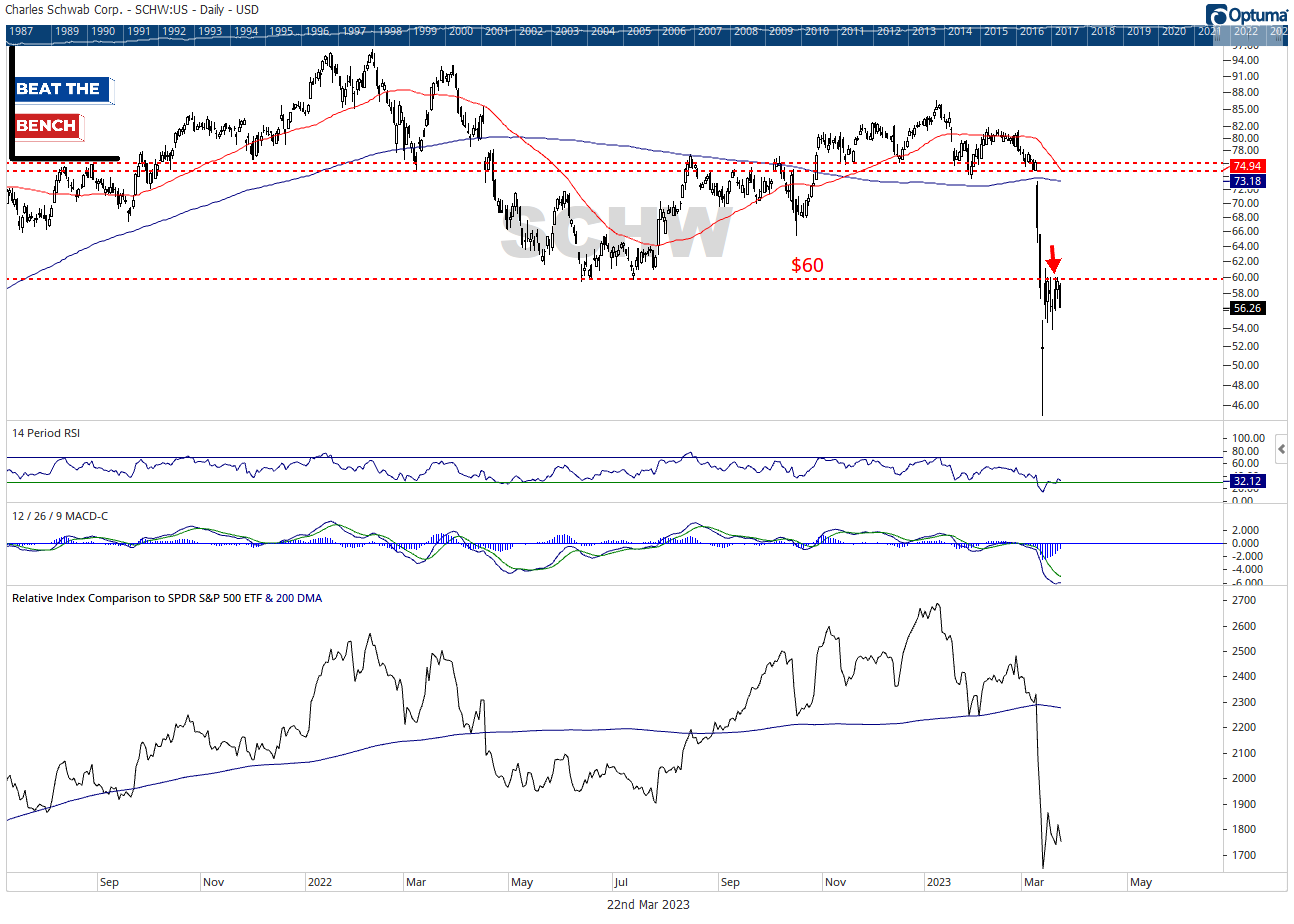
$60 is the key level for SCHW
It is pretty simple for the chart of Charles Schwab. If below the summer lows at $60, the bet has to be lower. If above, it still isn’t a great chart but could trade back up towards $70 without encountering much resistance.


