Stocks: The Good, The Bad and The Ugly
Stocks of the Dow
Good morning,
This week you’re getting 30 charts because we’re checking in on all 30 stocks in the Dow Jones Industrial Average. We’re also getting back to the roots of this publication’s name and rating both the absolute and relative charts of each: Good, Bad, or Ugly.
A quick reminder:
Good is an uptrend we want to buy. In absolute terms (the top panel) I like the prospect of it making money, in relative terms (the bottom panel) I like the prospect of it outperforming the S&P 500
Bad is a downtrend we want to avoid or underweight within portfolios
Ugly means a stock that isn’t trending at all, one in which the technicals don’t lean strongly one way or another, or one that could be set up for a countertrend rally
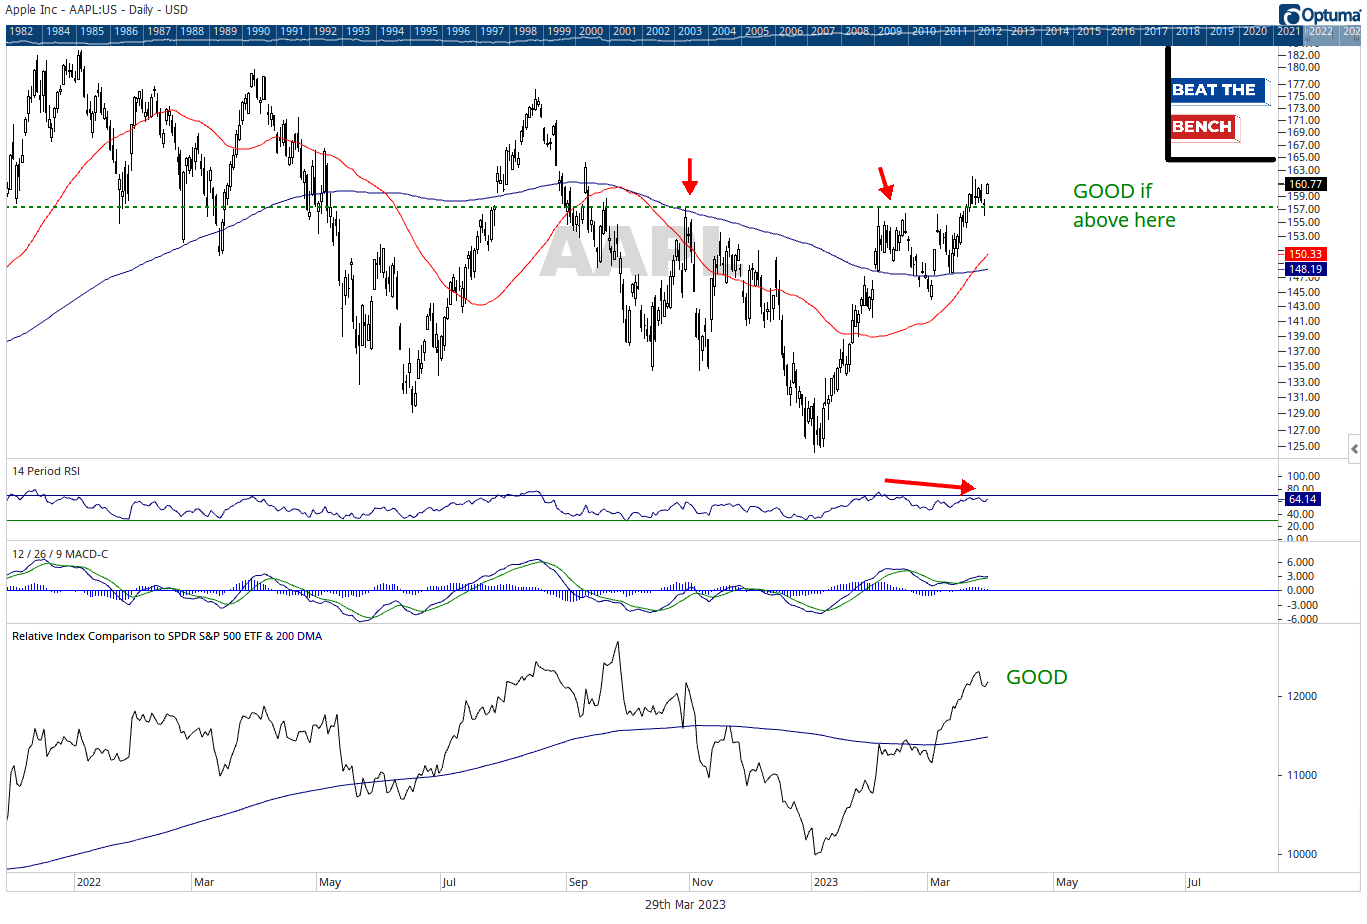
AAPL: +23% YTD
I’ve been skeptical AAPL could clear $157, and the jury is still out on holding, but if we’re above that level, you can’t fight this stock. Relative leader, though due to come in tactically.
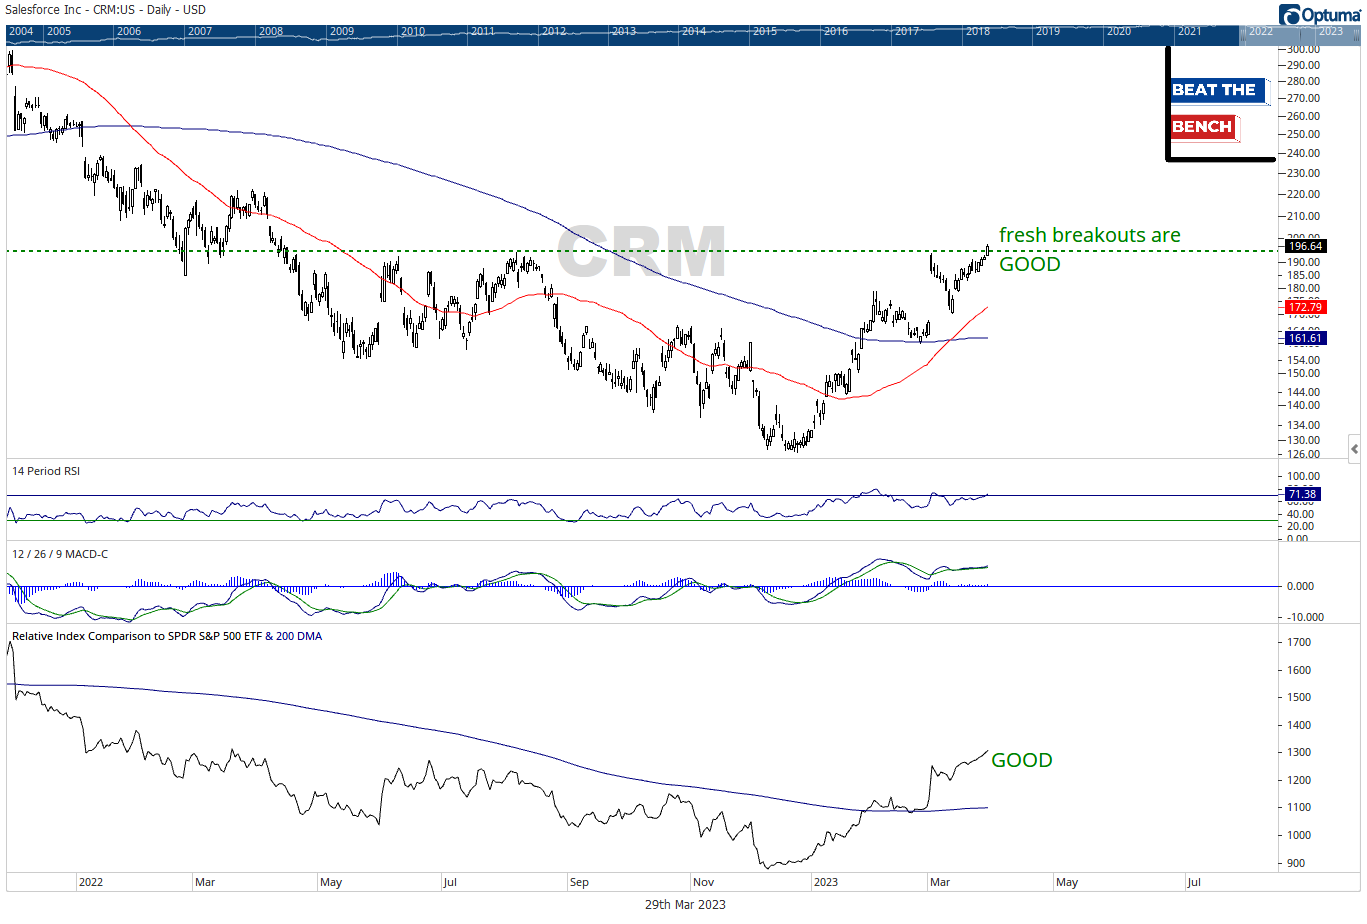
CRM:+19% YTD
Fresh breakout for Salesforce yesterday. This stock has turned a corner and there is nothing in the chart that suggests it can’t continue its relative leadership trend.
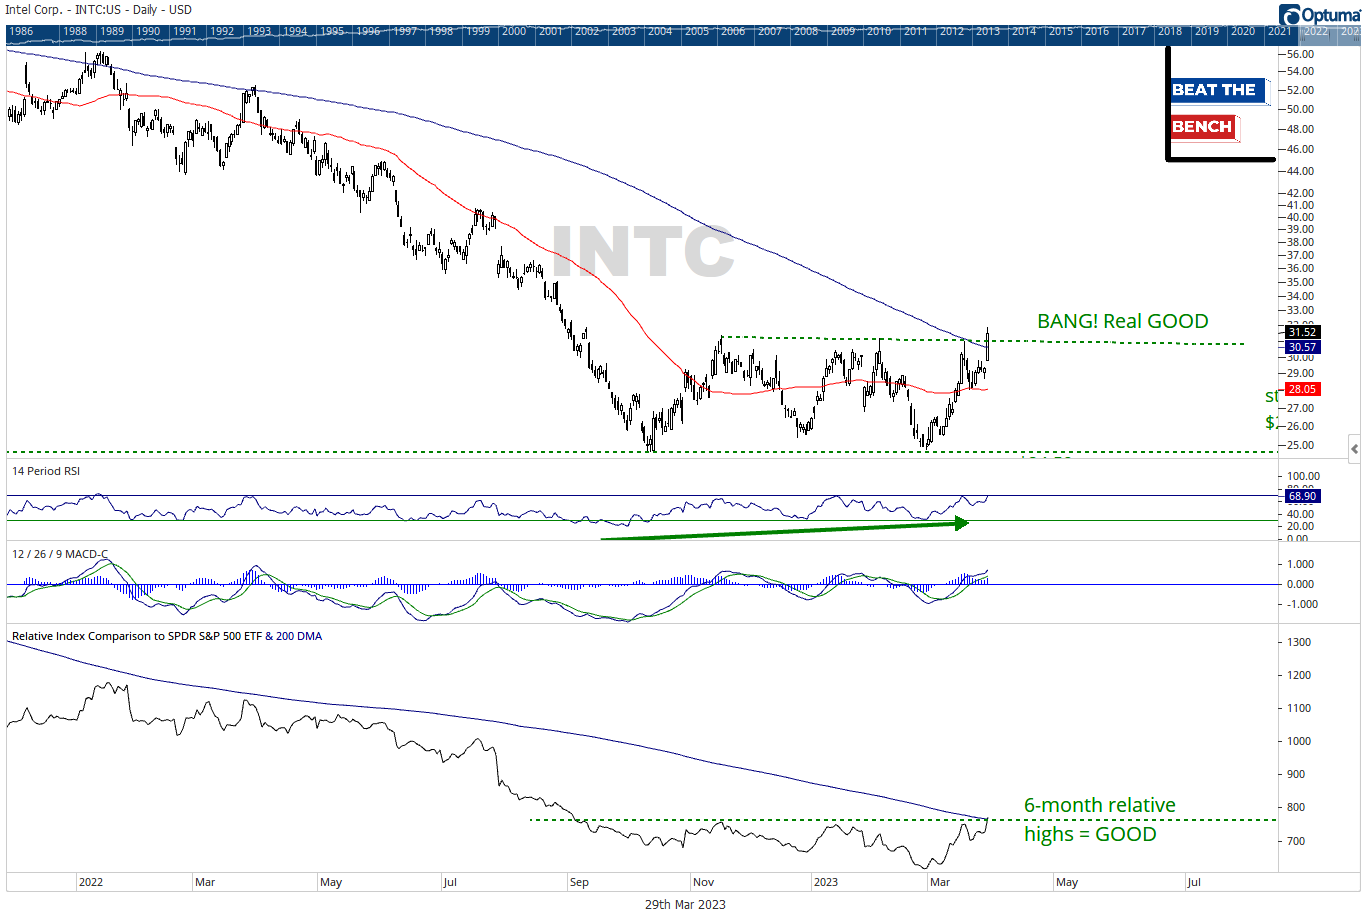
INTC: +17% YTD
Boom! Intel tested my patience in its first month on the Concentrated Equity Buy List, but has bounced back big in March and finally delivered the breakout yesterday with a monster 7.6% gain. Stay long.


