Stocks: The Good, The Bad and The Ugly
Revisiting past calls
Good morning advisors!
This week’s edition of Stocks: The Good, The Bad and The Ugly is going to look back at some charts from past reports and provide updated thinking. We don’t have time to cover them all, so I will focus specifically on stocks that I expressed GOOD or positive thoughts about and have sorted them according to the results. Links are also provided to the previous report where they first appeared.
*Many of the stocks below came from the first edition of this report on September 22, where I provided a Good, Bad and Ugly stock from each sector. The S&P 500 is almost exactly flat since that report (3757.99 vs. 3759.69 at Wednesday’s close) making it a perfect time to check in.
The Good
GPC (featured in the first edition of this report on September 22)
Genuine Parts Company was the “Good” pick within the CD sector for my first report and it has certainly delivered. The stock is up 14% since then, more impressive considering the broad sector is down more than 8%. This stock is now a tactical hold, with statistical extremes in its proximity to both its 50 and 200-day moving averages. Long-term investors can hold and temper near-term expectations, while more active investors can be forgiven for taking a profit.
MET (featured in the first edition of this report on September 22)
MetLife is up 16% since September 22, more than double the financials sector’s 6.6% return. The stock hit a 52-week high on Wednesday, but printed an ugly candle following J-Pow’s presser. $73 is a tight stop for those looking to protect profits, but insurance remains a strong relative leadership group.
CAH (featured in the first edition of this report on September 22)
Cardinal Health is up 12% since it was featured, outperforming the market and its sector. I still really like this base and relative trend, but RSI-14 momentum is negatively diverging on the latest leg up, suggesting there is heightened risk of a near-term pullback.
GILD (first featured on October 20)
Gilead has been one of the best long ideas, as the stock is 20% higher in the two weeks since the report and was never lower. Sure, nobody can predict an earnings reaction, but the technical signs were there. A base had been building for two years, short-term momentum was accelerating, and the relative chart had already broken out. Sometimes this stuff works. Stay long, $74 is first support.
APA (first featured on October 6)
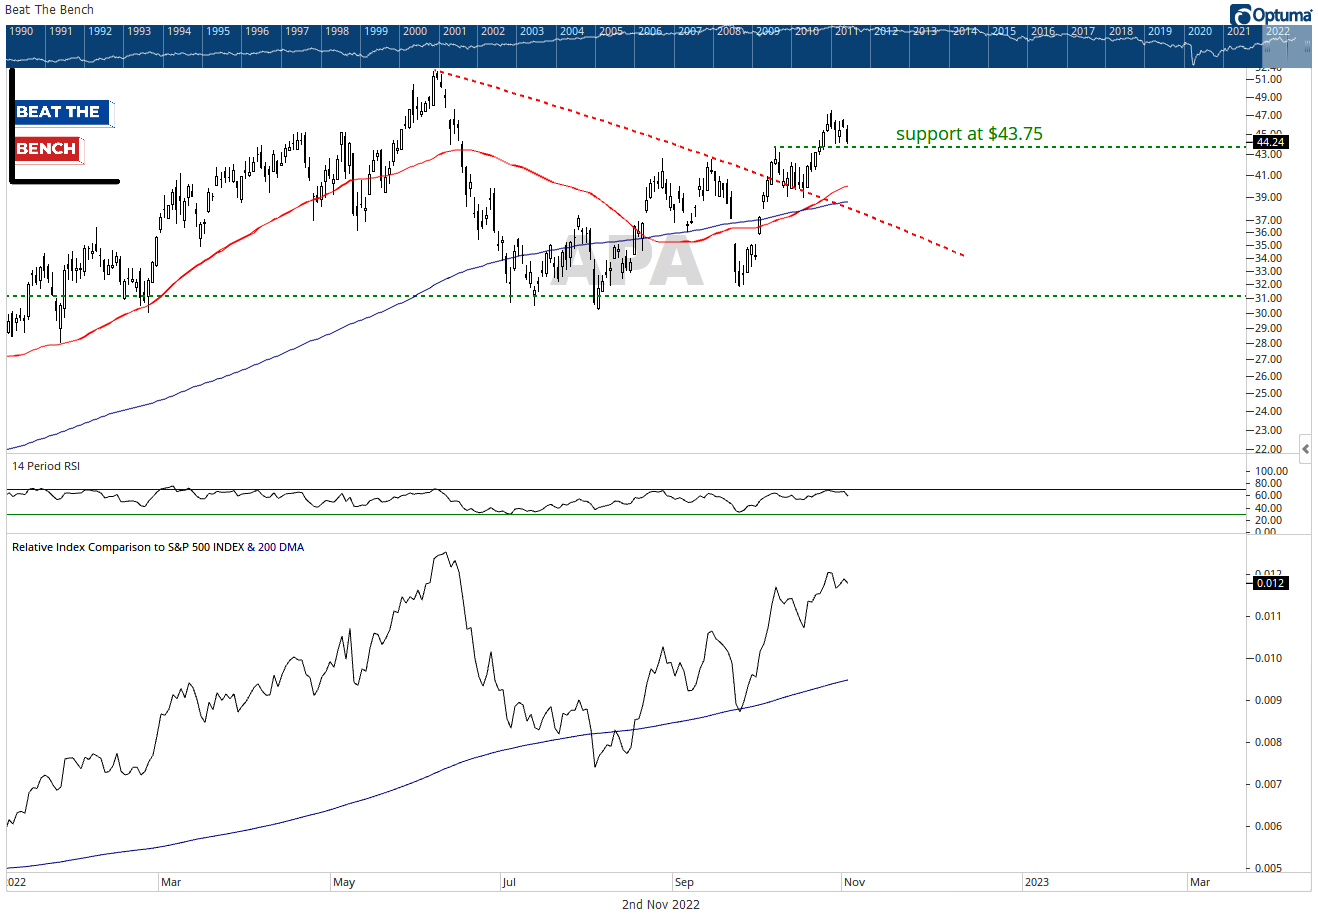
The stock formerly known as Apache broke out from this red downtrend line the day this report was published and the stock is up about 9% since. However, the integrateds appear better positioned to benefit from a sideways oil environment, and a tight stop at $43.75 could be used to protect profits.
IPG (first featured on October 6)
IPG is up more than 8% since October 6, a strong outperformer relative to the comms services sector which is down 7%. This one has played out in textbook fashion and I recommend taking profits now that the stock has moved up into resistance.
VICI (featured in the first edition of this report on September 22)
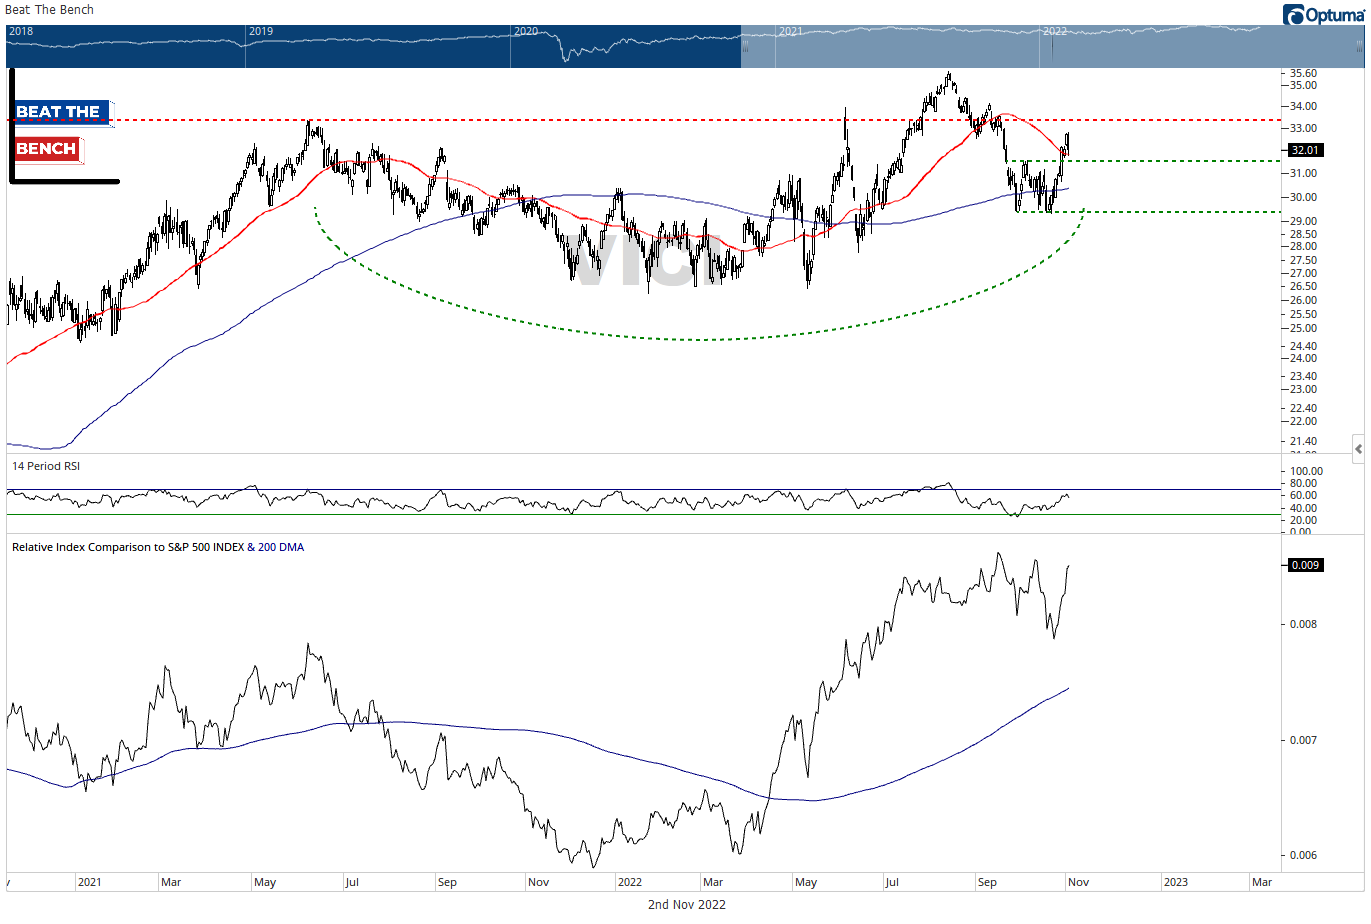
Keeping with the “decent stock in a bad sector” theme, VICI was the “Good” stock for real estate. It is up a measly 1.2% since September 22, but that is better than the S&P 500 (unchanged almost to the point) or the real estate sector (-5.9%), so I’m counting it as a win. This is one of the only REITs you could convince me to own, but I would keep a tight leash on it given my view of the sector. Support at $31.50 followed by $29.30.
GD (first featured on October 13)
October 13 was the day of the market’s huge reversal, so if you got in near the opening price of the day, General Dynamics is up about 13%. It has made new closing and relative highs, though is still short of its intraday high of $255 from all the way back in March. Momentum is slowing and there appear to be a lot of sellers up near this range, but the group and stock remain relative leaders. I think it eventually breaks through even if it may not be this week.
CMI (first featured on October 13)
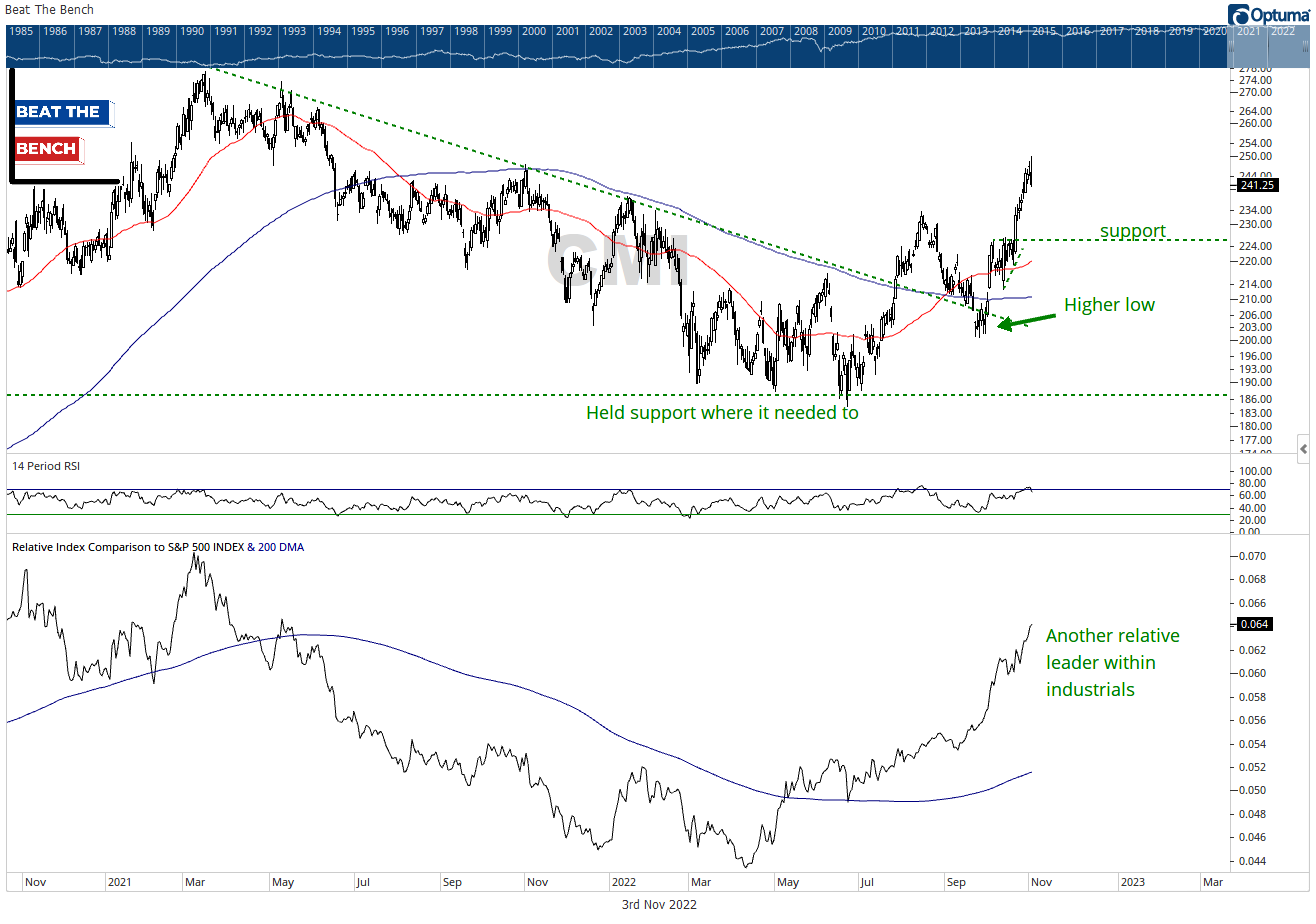
Cummins is up 12% since the October 13 open and hit a 52-week high early on Wednesday. Short-term this is overextended, but $226 is first support followed by the 200-day moving average which is curling upwards.
*It looks like CMI missed earnings this morning and is down about 6% and sitting on first support at $226 (as of 8:10am ET). That level can be used as a stop to protect profits.
MRK (first featured on October 13)
Merck is one of the best looking long-term charts out there due to its large rounding base. The stock has broken out to new all-time highs since being shown and sits near 52-week relative highs. Stay long.
The Bad
SEDG (first featured in The Deep Dive: The Tech Sector)
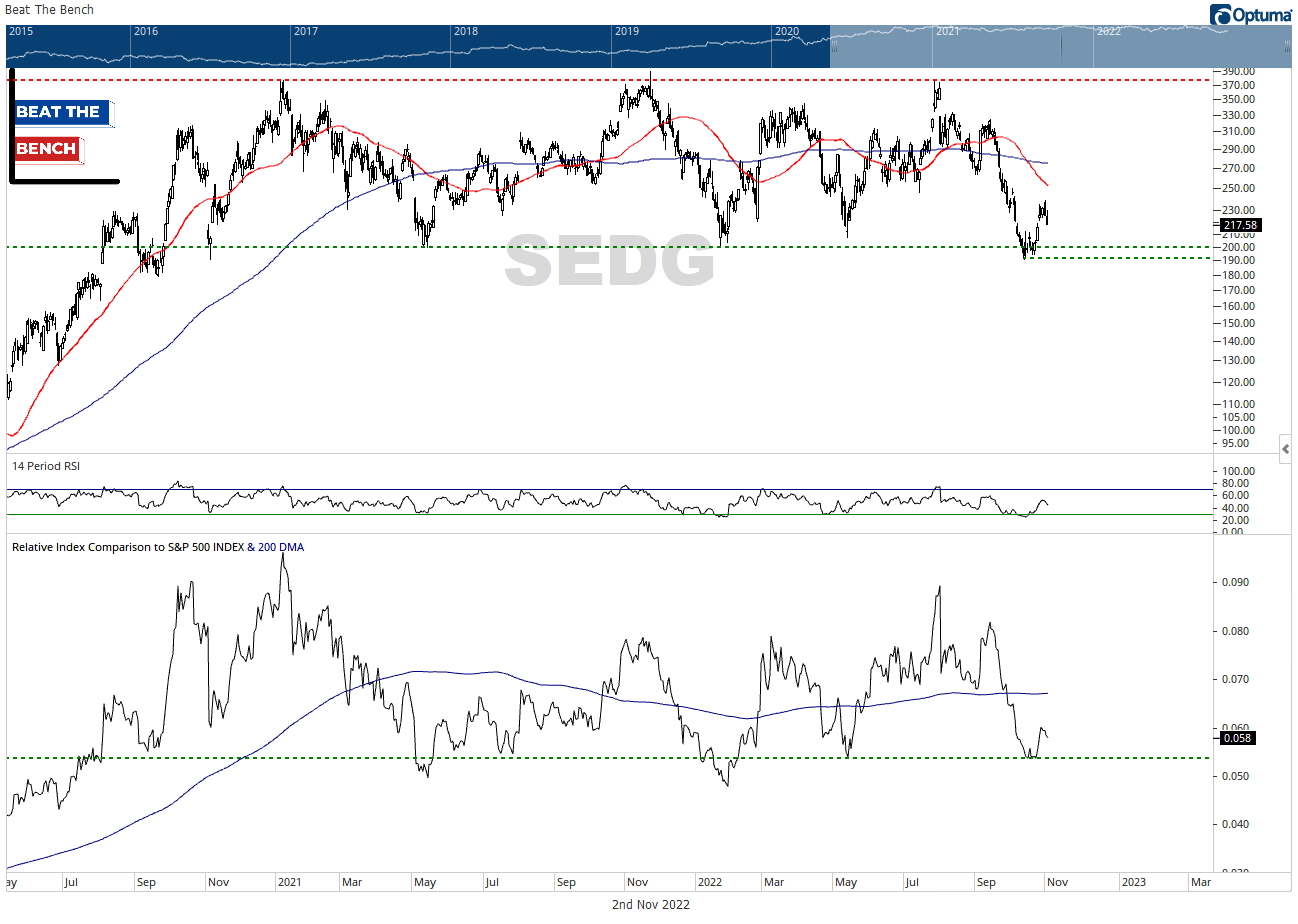
SolarEdge was a long-term enticing chart because of the multi-year rectangle is was moving in despite the ongoing bear market. Technically that thesis is still intact, but the stock is down roughly 17% since it was first highlighted, and hit 52-week lows before popping back above the low-end of support. If you are still long this name, $190 is the line in the sand that would signal considerably more downside risk.
BR (first featured in The Deep Dive: The Tech Sector)
Broadridge Financial Services is down about 12% since being featured, with much of that decline coming on a 7.9% post-earnings drop yesterday. That drop wasn’t enough to break the October 13 intraday low ($135.72) and that should now be viewed as the key tactical level. Nevertheless, unless you have a mandate to own tech this isn’t an attractive enough chart to warrant money.
SO (featured in the first edition of this report on September 22)
Utilities are the worst performing sector since September 22 and none have been good. However, SO has not only underperformed the market, but the sector since then and its bounceback rally appears to be stalling out in recent days.
ON (first featured in The Deep Dive: The Tech Sector)
ON reported earnings on Monday and fell about 9%. The stock has lost its breakout point and is hitting 2-month relative lows. It still looks better than most semiconductor charts, but this is no longer an attractive stock to own.
DHR (first featured on October 6)
Healthcare is up 4% vs. a flat S&P 500 since October 6, but Danaher hasn’t participated at all. The stock is down 8% and has lost its short-term uptrend line. Tactical support now becomes the October 21 intraday low of $235, but the most attractive part of the chart was a potential relative breakout that is no longer on deck with the lower panel back near a flat 200-dma.
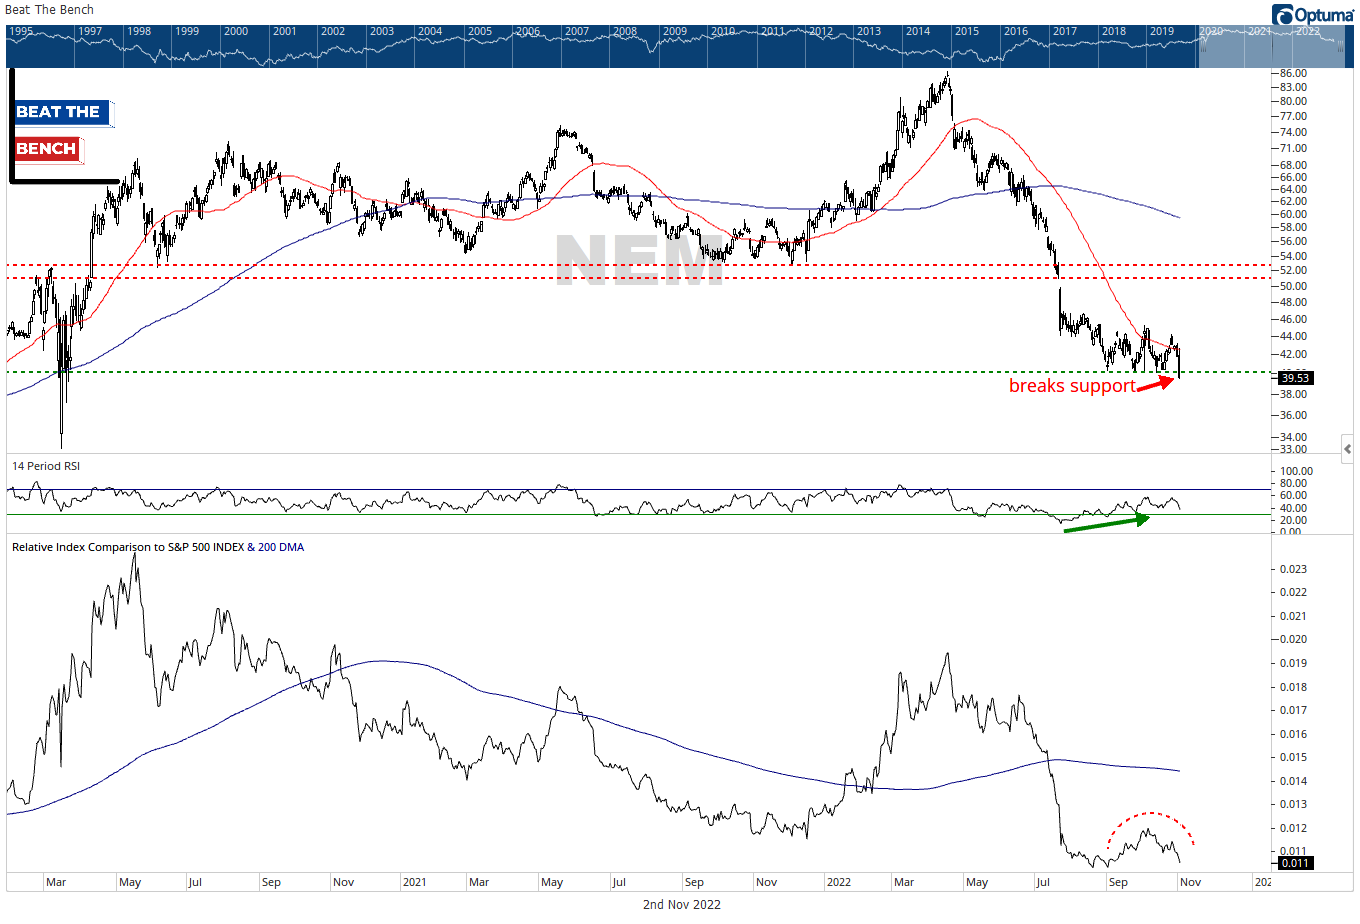
NEM (first featured on October 6)
Newmont Mining was in the UGLY section with a flat return and my bullish trade idea still intact until Wednesday afternoon. Yesterday’s move below support at $40 kills the trade. No reason to own this name.
The Ugly (neutral to mixed results)
DVN (featured in the first edition of this report on September 22)
I started writing this report on Tuesday evening and DVN was firmly in the good section, with a more than 22% return since September 22. Unfortunately, the stock got hammered in trading on Wednesday following a poorly received earnings report and the overall market sell-off. The stock (+6.6% since September 22) has outperformed the market, but has now badly trailed energy’s 17.2% return.
GIS (first featured in the first edition of this report on September 22)
Consumer staples have roughly tracked the market since September 22, up 1% vs. a flat S&P 500. GIS made a new all-time high as recently as Monday and is still a relative leader, but performance since September 22 is actually down 1%. No reason to jump ship on a stock making higher highs and higher lows.
ENPH (first featured in The Deep Dive: The Tech Sector)
ENPH is only down about 5% since it was first highlighted, but it has been on wild ride just to get back there. It immediately fell about 23% and lost the $275 level I highlighted as a stop. It has roared back furiously over the past two weeks, but the risk/reward is less attractive, as momentum appears to be waning and the stock has yet to break back through to new highs. I still believe the $264-275 level is important to hold.
TFC (first featured on October 6)
Truist wasn’t a great trend, but I suggested that perhaps its false breakdown below the summer lows could set it up for an upside rally. Not so. It immediately fell back below that $45 level and is getting rejected at the underside of it. It is only down 2% since October 6, but the KBWB Bank Index is up about 3% in that time.
I enjoy going through these charts because it complements the top-down work I do for the Monday Morning Playbook. Last week, I shared how it was clear that the best performing stocks were tied to goods, services or products that weren’t discretionary.
This week, my takeaway is that if the market bottomed in October, we probably shouldn’t have this many more winners than losers. The stocks showing relative strength in September have mostly continued to outperform, and most of the losers from the first nine months just got worse in October. That isn’t what we typically see around major market turning points and serves as another note of caution amid the ongoing bear market.
Stay active, focus on stocks exhibiting relative strength and I’ll keep bringing the ideas.
Thanks for reading,
Scott
Scott Brown, CMT
Founder and Chief Investment Strategist, Beat The Bench LLC


