The Deep Dive
Year-End Sector Review
Good morning,
For the final Deep Dive of 2022, we’re checking in on all 11 S&P 500 sectors. We’ll see how they’ve fared in the past year, but more importantly what the set-up is going into next year. They are ordered below based on YTD return and I have noted the percent of stocks in each sector above their 200-DMA as a proxy for breadth. Lastly, we looking exclusively at weekly candle charts, to provide a more “big-picture” look with potentially longer-term implications.
Let’s dive in!
*YTD return numbers are as of 12/16, % above 200-DMA are as of 12/15
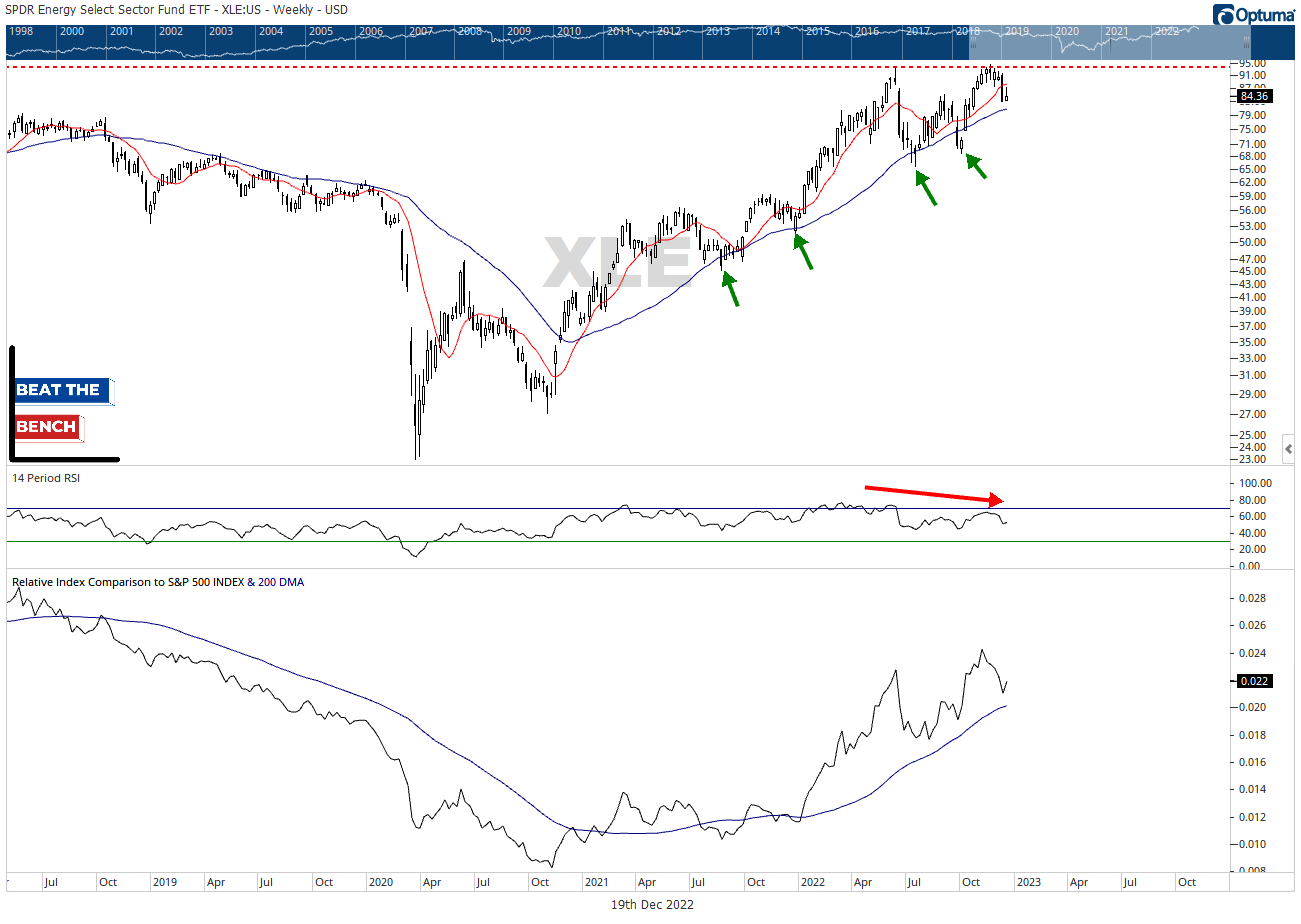
Energy
YTD: +51.4%
Percent of stocks above 200-DMA: 74%
Energy’s relative leadership is still intact, up above a rising 200-DMA in the bottom panel. However, the bigger concern comes in absolute terms, as energy is essentially flat since the summer. In addition, the November attempt to get through those June highs had a significant momentum divergence (middle panel). The key story to watch for 2023 is will resistance at $94 give way, or will support near the 200-DMA (40-week) finally break? History suggests that an outlier of this magnitude may be unsustainable and energy is more likely to catch down, but we will defer to the charts. Tactically neutral.
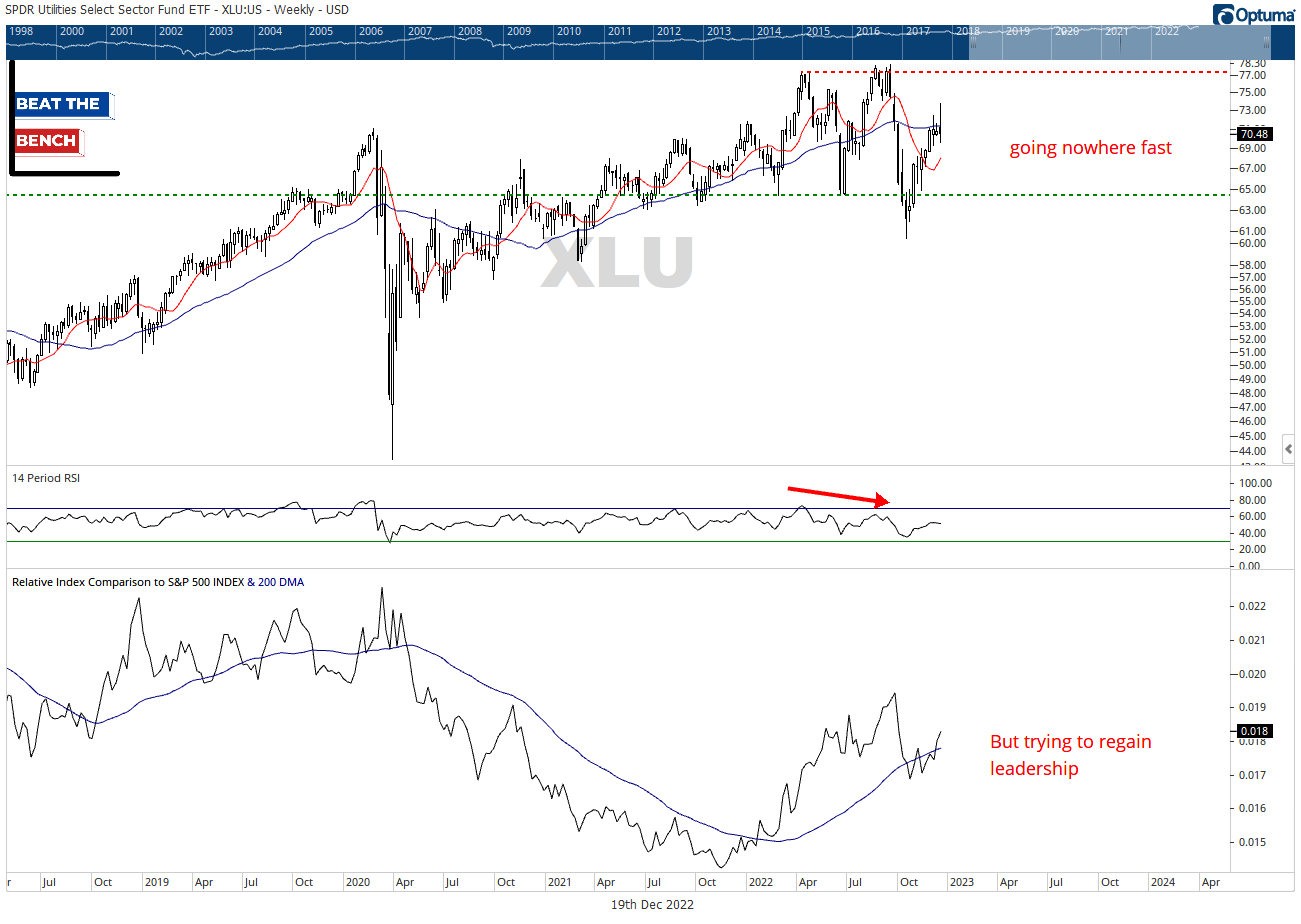
Utilities
YTD: -2.2%
Percent of stocks above 200-DMA: 57%
Utilities are going nowhere fast and have spent the past 3 weeks oscillating around a flat 200-DMA. They are trying to regain leadership after their September/October collapse, but the yield on utilities is just 2.85%. For that payout, and the extra volatility but no clear upside objective, I would rather own high-quality bonds (a 2-year Treasury still yields more than 4%).
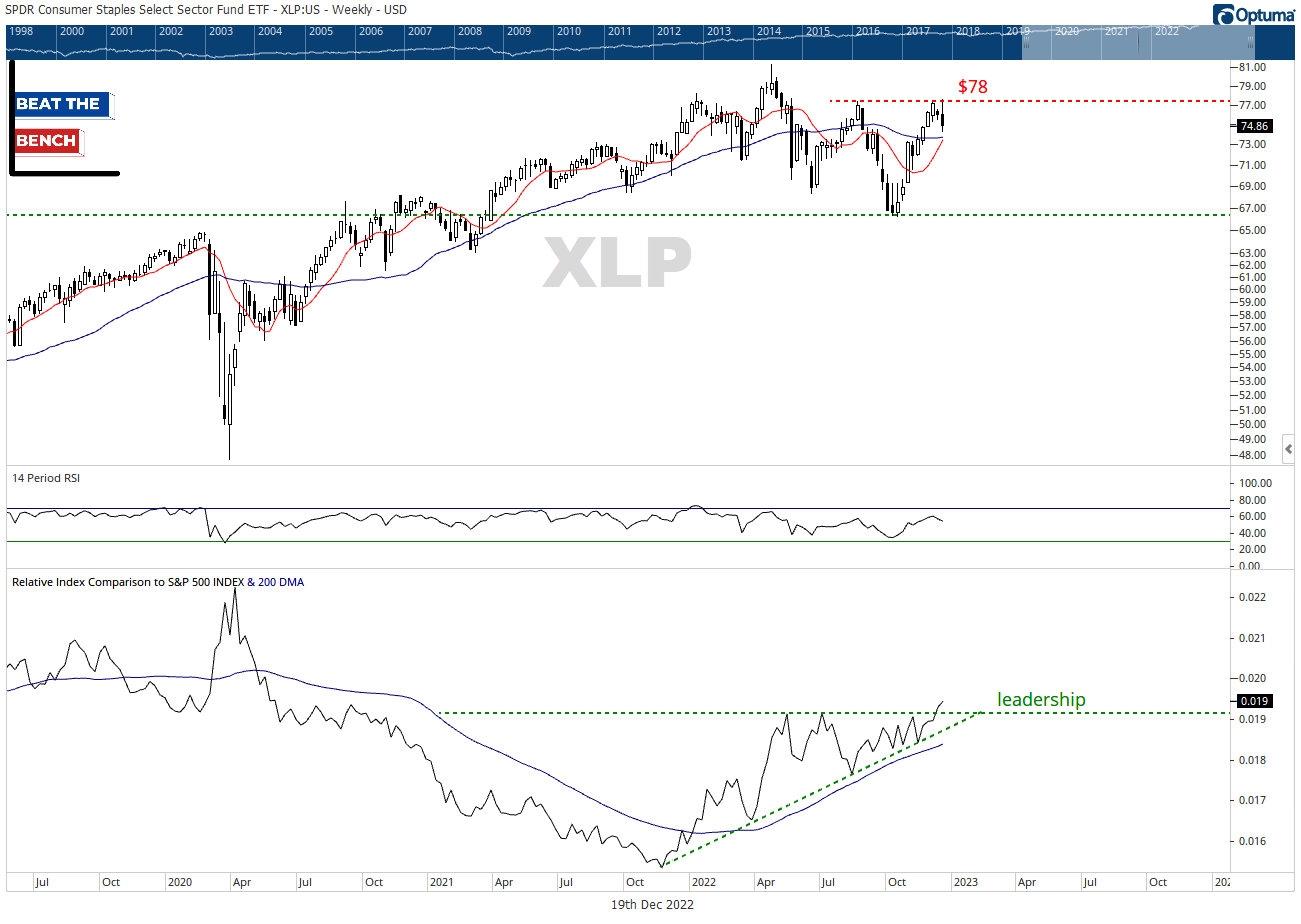
Consumer Staples
YTD: -3.3%
Percent of stocks above 200-DMA: 64%
Consumer staples have arguably the best relative chart right now, breaking out to 52-week relative highs in the past two weeks. XLP has first resistance at $78 and is largely trendless in absolute terms.
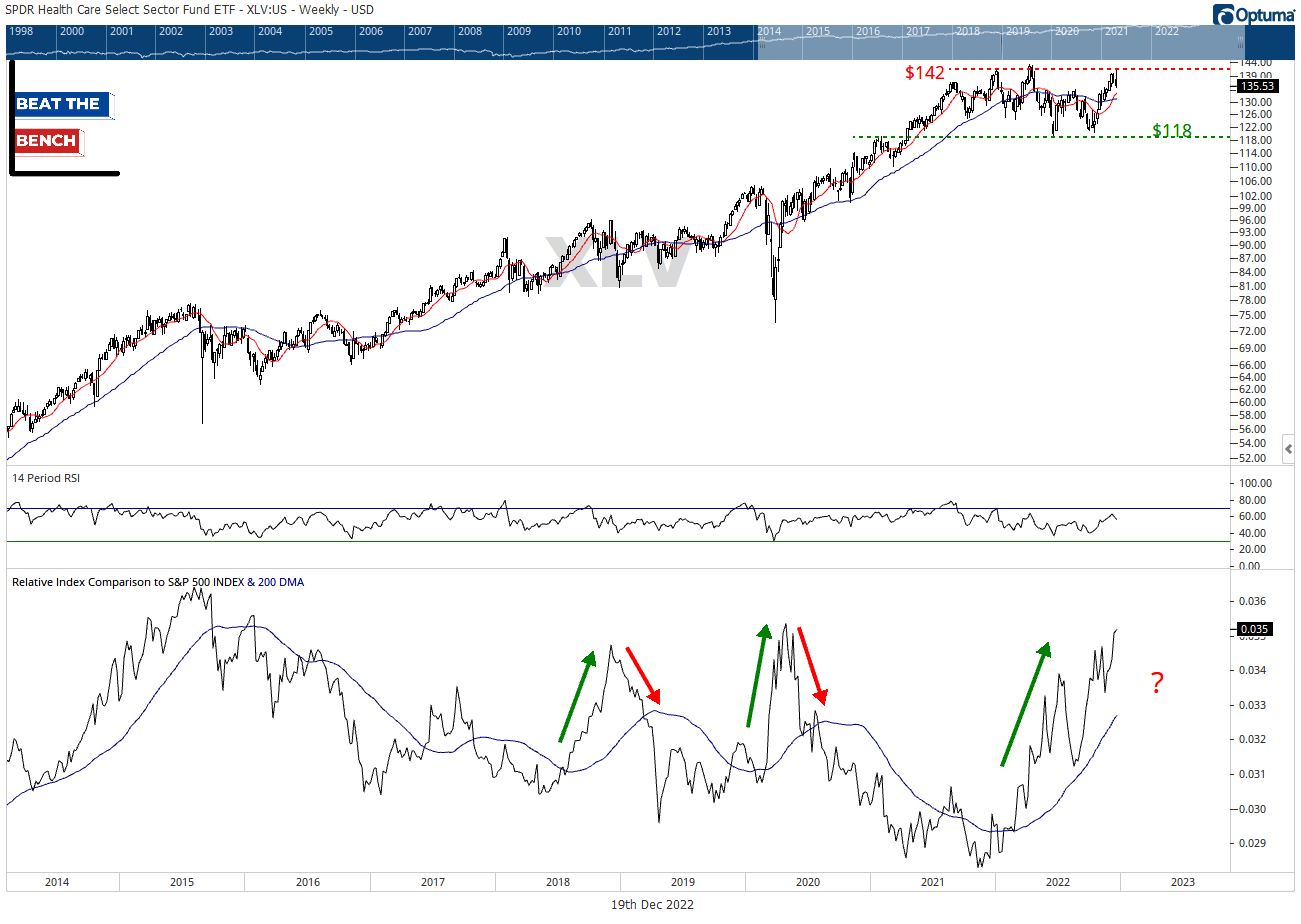
Healthcare
YTD: -4.1%
Percent of stocks above 200-DMA: 64%
The healthcare sector also closed out last week at 52-week relative highs and is an enticing chart from a structural perspective as long as support at $118 remains intact. The risks for 2023 are two-fold. First, the low $140s continue to act as significant resistance for the sector, and healthcare printed yet another ugly reversal there last week. Second, the sector has been a trend follower’s nightmare over the past decade. Almost all runs of outperformance like we have seen over the past year have reversed sharply with little warning. I suspect that the fundamental story of healthcare is to blame, and the consensus is too quick to embrace any run the sector goes on.
Industrials
YTD: -7.7%
Percent of stocks above 200-DMA: 70%
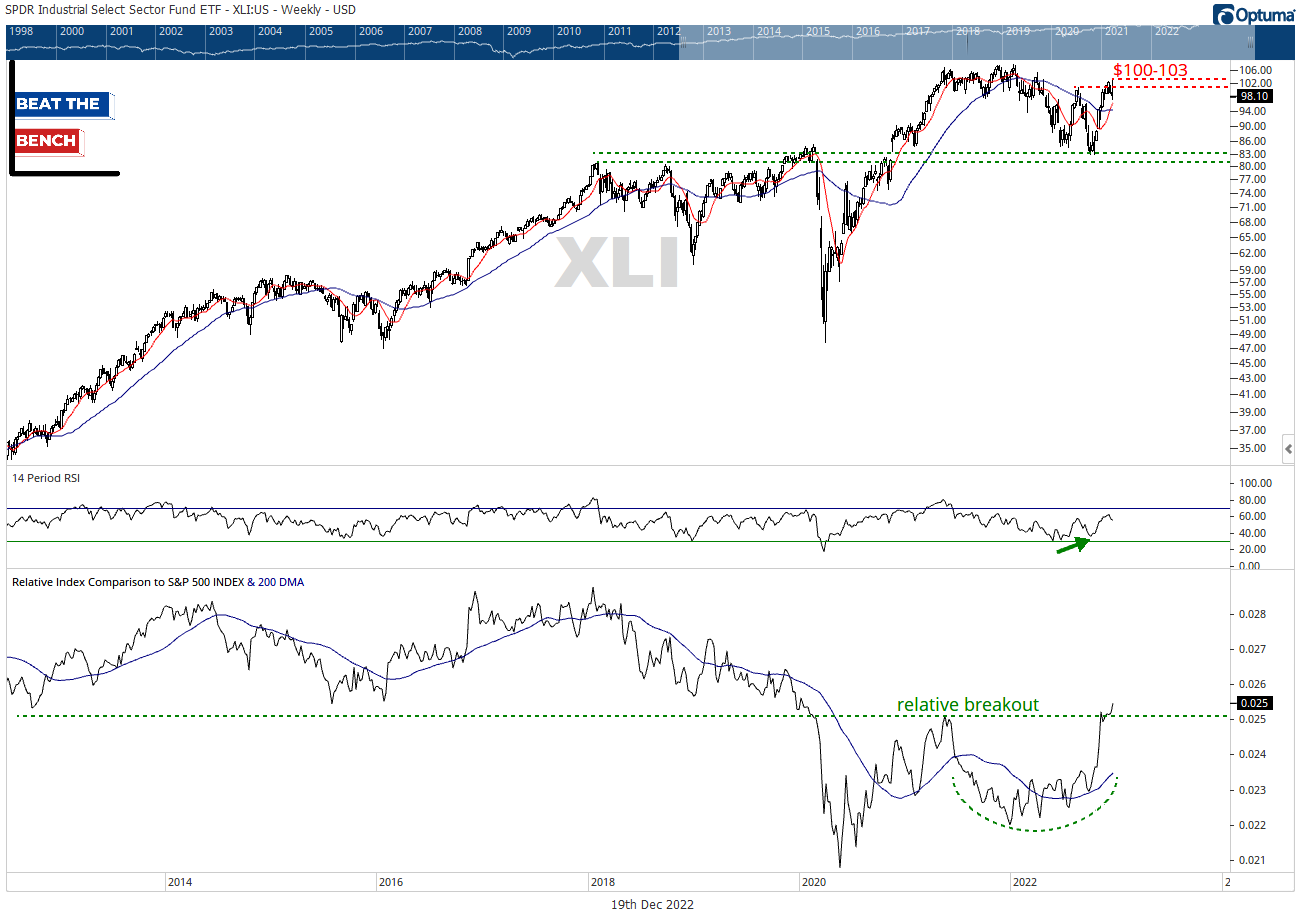
70% of industrial stocks are above their 200-DMA, the most of any sector outside energy and XLI just broke out to fresh highs vs. the S&P 500. We’ve been firmly overweight the sector and pounding the table on the strength coming from aerospace and defense, but that doesn’t mean there aren’t problems. Industrials posted a false breakout above their August highs in recent weeks and closed more than 5% off last week’s highs on Friday. Structurally neutral on the absolute chart, but the bottom end of its range is 15% below Friday’s close, representing a near-term risk for the sector.
Materials
YTD: -13.0%
Percent of stocks above 200-DMA: 46%
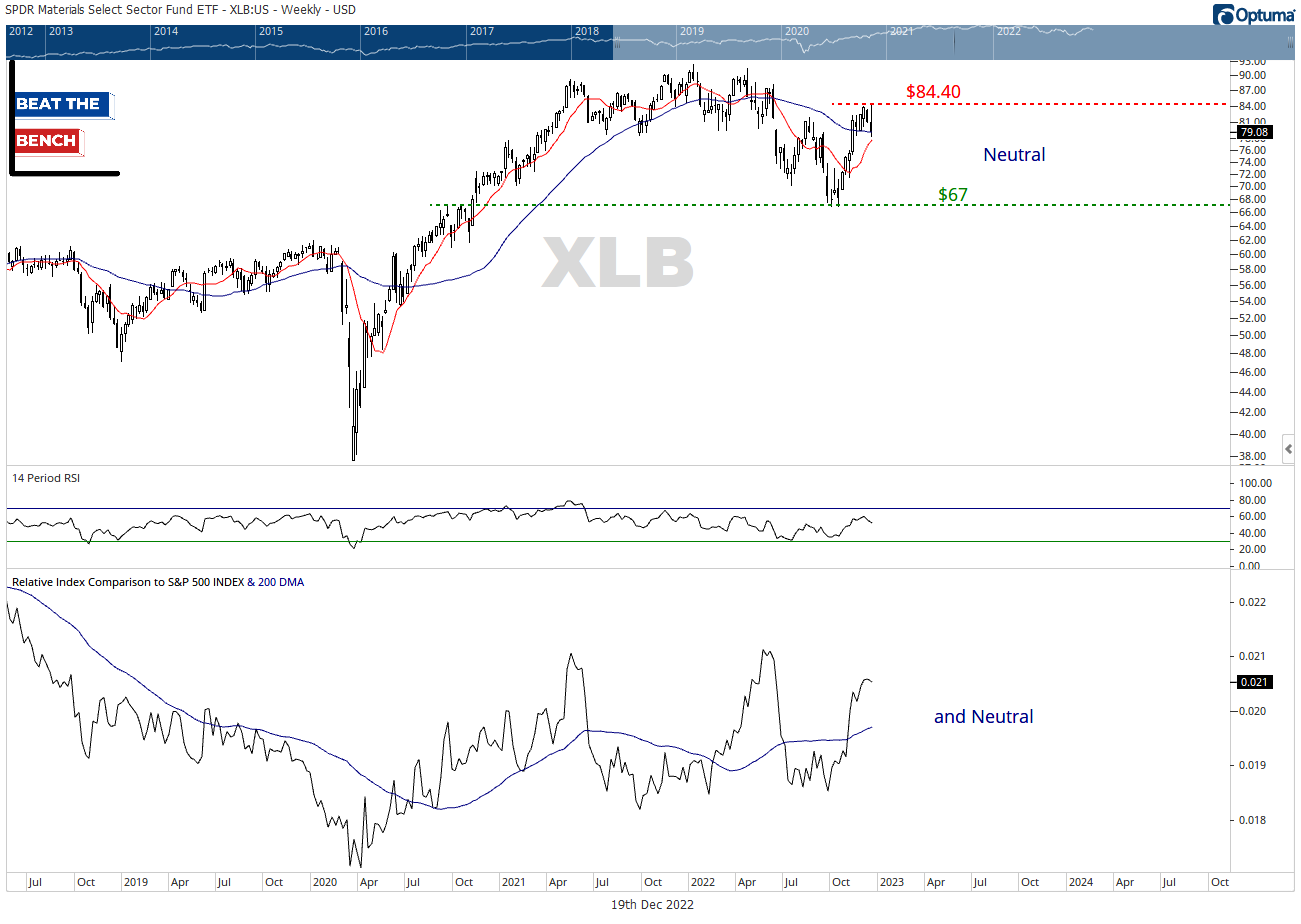
Not much to say about the S&P’s smallest sector. Materials are neutral and range-bound (or in the terminology of our individual equity report: Ugly) in both absolute and relative terms. $84.40 is first resistance on XLB, while key support is found 15% below at $67/share.
Financials
YTD: -14.2%
Percent of stocks above 200-DMA: 51%
Super big-picture here, but one of the most important charts to watch as we head into 2023 is financials. I’ve cited a multitude of charts that historically suggest we are heading into a recession. But if you want one to monitor that says whether we are actually there or not, XLF breaking $30 is your line in the sand. Technically, $29.60 is the October lows, but this level has significance all the way back to the top of the GFC. In relative terms, the chart is trading right with the S&P 500, but I have a negative bias due to my belief that rates are likely to decline in 2023.
Information Technology
YTD: -27.3%
Percent of stocks above 200-DMA: 41%
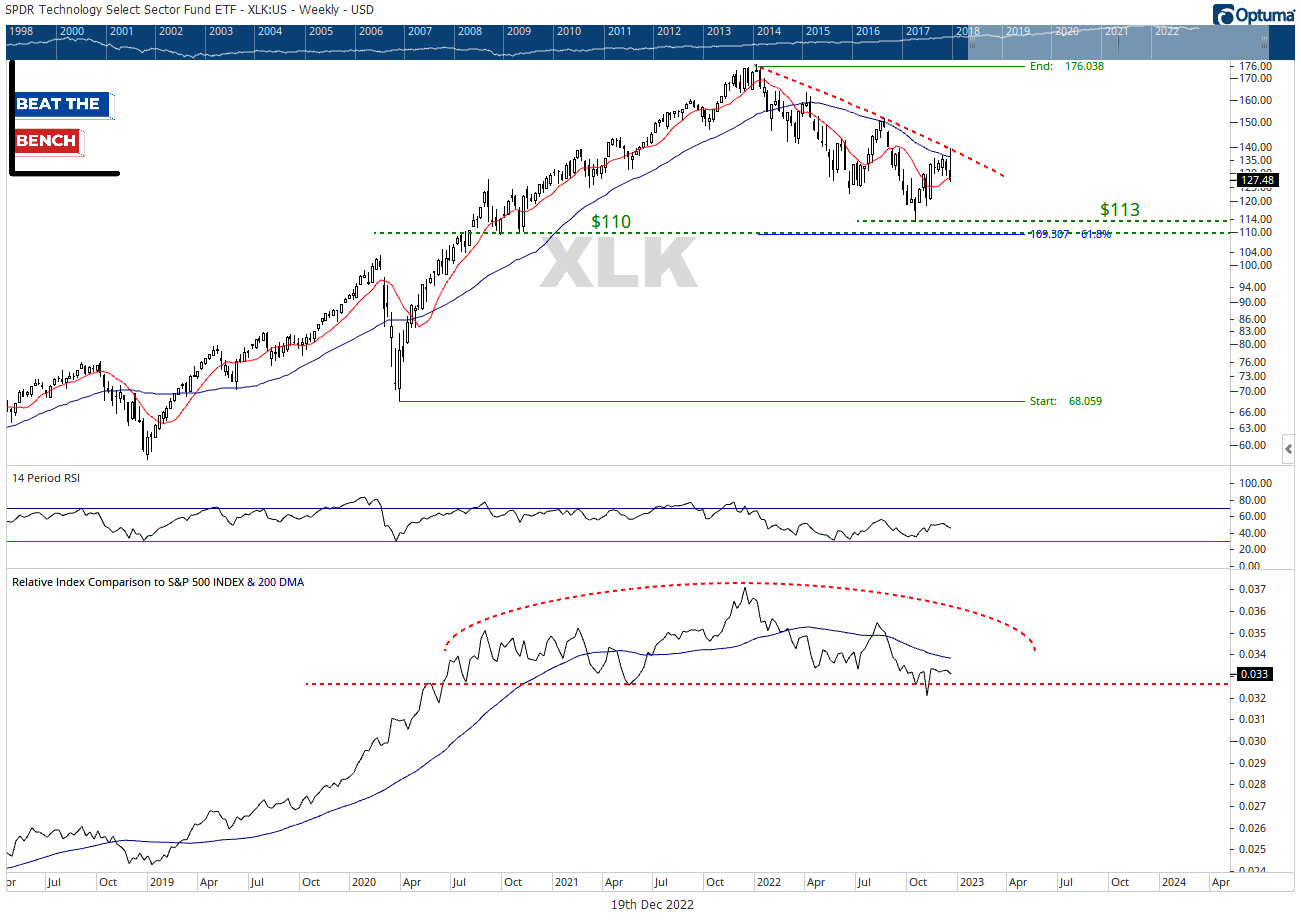
Technology has put in a multiyear top relative to the broad market, and periods of outperformance should be used to reduce exposure. In absolute terms, a downtrend line from the early 2022 highs continues to cap rallies, similar to the S&P 500. First support is the range from $109-113, which is the 61.8% retracement of the post-Covid rally and the October lows.
Real Estate
YTD: -28.0%
Percent of stocks above 200-DMA: 19%
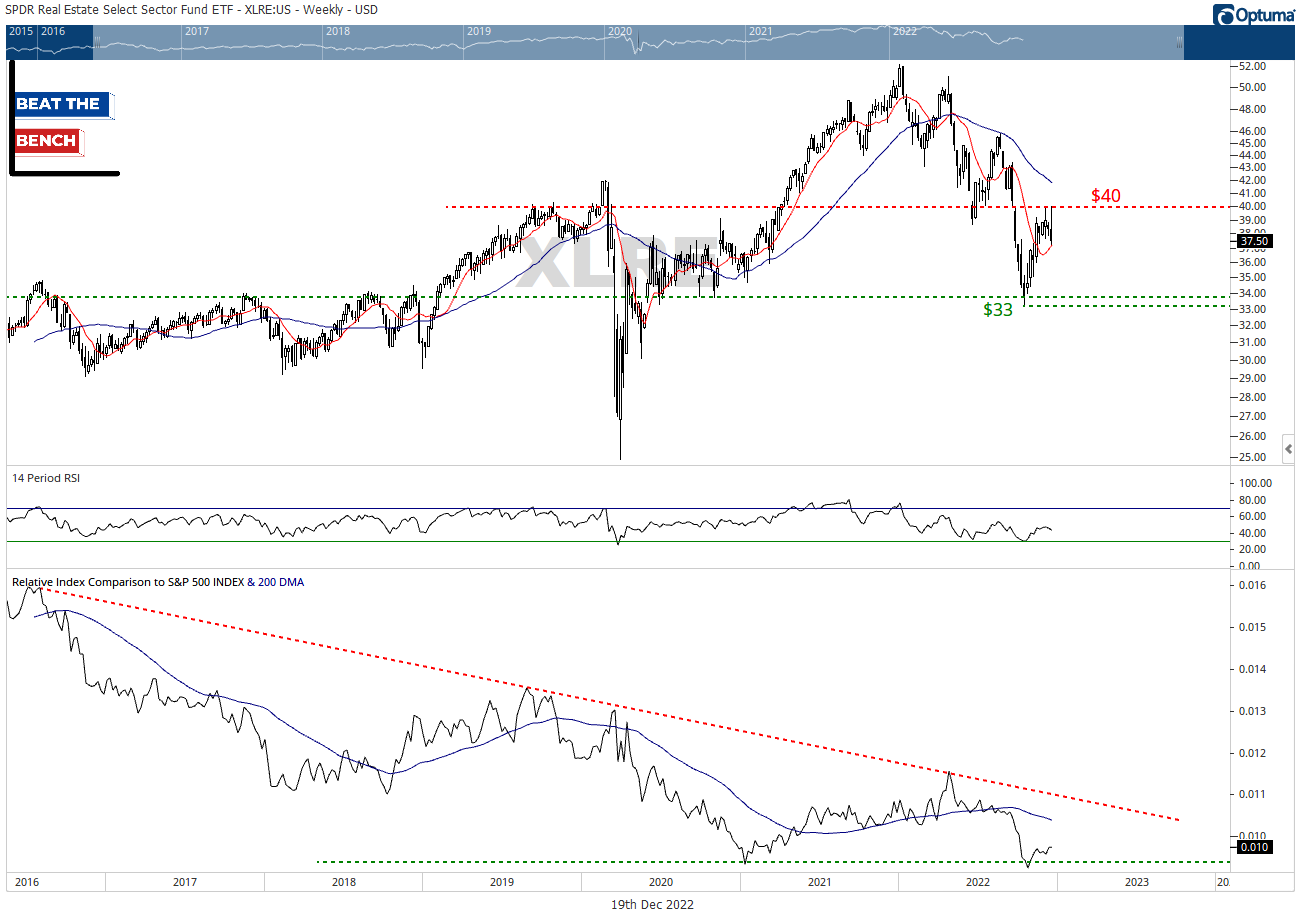
Real Estate was the subject of last week’s Deep Dive, and the significance of the $40 resistance level on XLRE was only strengthened since that report. Key support is back at the October lows near $33/share. The relative chart remains in a downtrend, but I am watching to see if it can stay above the January 2021 lows. Worst breadth of any of the 11 sectors.
Consumer Discretionary
YTD: -35.4%
Percent of stocks above 200-DMA: 54%
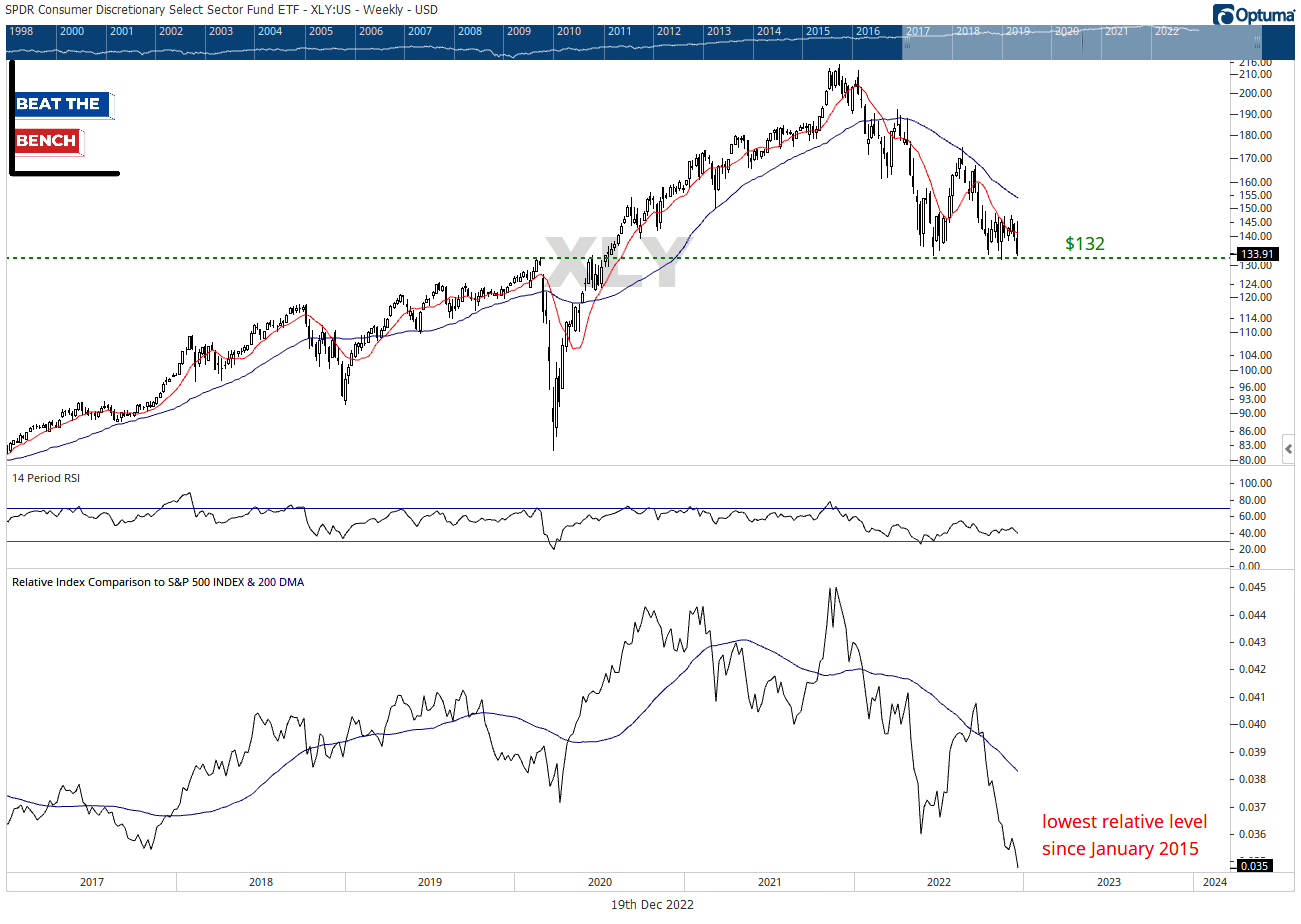
This is the most important sector to watch this week. XLY is again testing clear horizontal support at $132. This is the fourth largest sector, so despite being a clear market laggard, whether or not XLY can hold this week is likely to have important implications for the Santa Claus Rally and the early part of 2023. Between the relative weakness and number of tests we have already had, my gut says it breaks.
Communication Services
YTD: -40.1%
Percent of stocks above 200-DMA: 21%
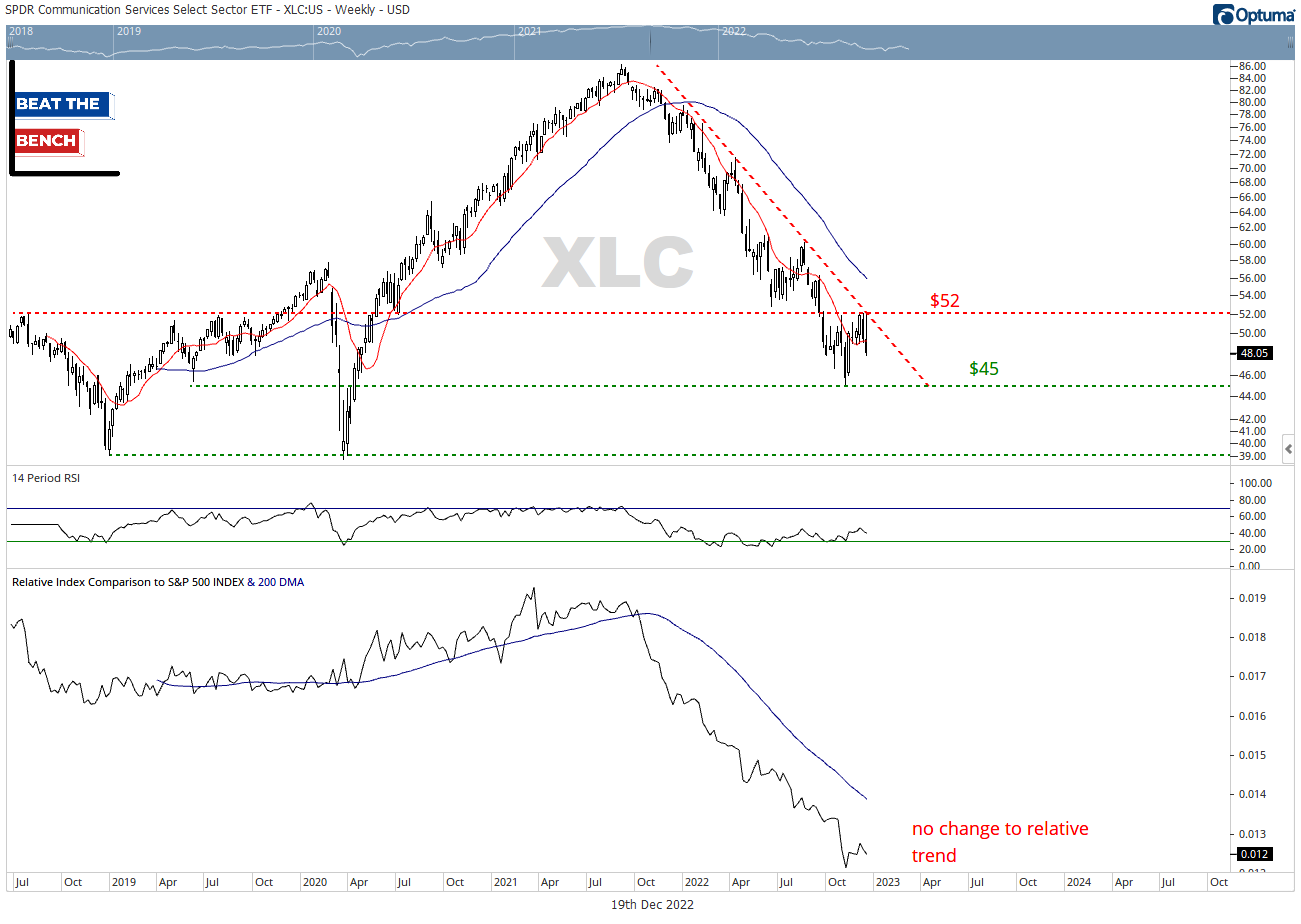
Communication services has been the worst-performing sector YTD and there is little evidence that the trend is set to shift back in its favor. XLC simply cannot be owned without significant basing action if it remains below resistance at $52. If the October lows at $45 cannot hold, the risk becomes another move back to XLC’s all-time lows near $39/share, where it bottomed in December 2018 and March 2020.
A few takeaways
Defense is still leading, growth is still lagging
Many of the leading sectors failed to move through or stay above their August highs. At best they are neutral or sideways, at worst, they have risk back to their October lows
The weakness in communications and real estate is confirmed by their breadth, while improvements to breadth within consumer discretionary have been masked by top weights Amazon and Tesla
For now, our allocations and recommendations are staying the course and remaining cautious. We would expect to see significant changes to market leadership around the turn of a major market low, but so far that has failed to materialize. The leading sectors in 2022 may not be leaders throughout all of 2023, but for now, they are. Continue to favor those with relative momentum and underweight the worst-performing sectors.
Thanks for reading! As a reminder, Beat the Bench is off all of next week for the holidays but will resume the first week of January.
See you in the new year!
Scott
Scott Brown, CMT
Founder and Chief Investment Strategist, Beat The Bench LLC


