The Deep Dive
Revisiting the 10 most important charts for 2023
Good morning,
This week we are revisiting the 10 Most Important Charts for 2023, as first laid out on January 17th. We’ll check in on what trends are intact, what has changed, and what the status of each could mean for the duration of the year.
Let’s dive in!
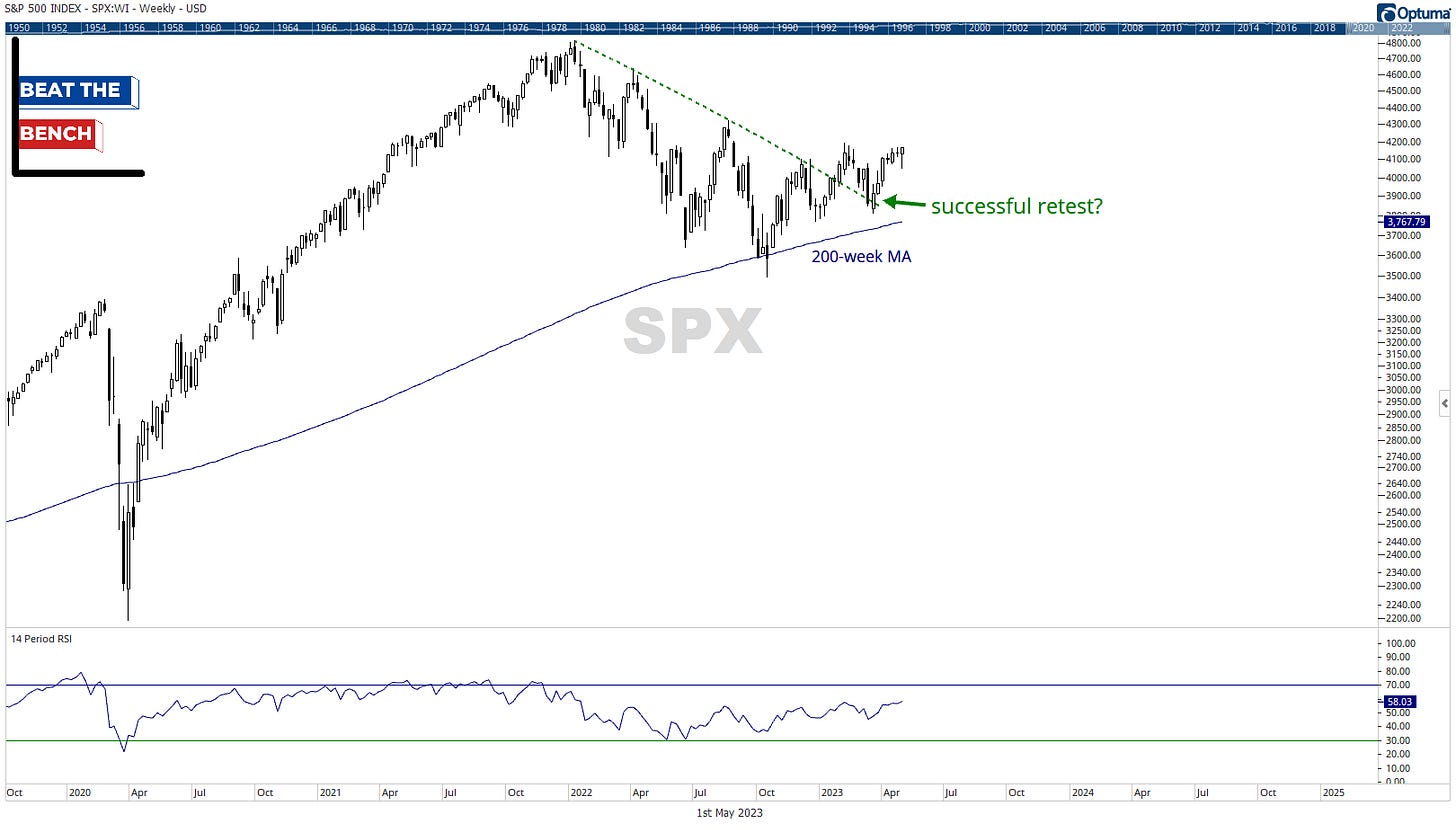
What line wins out on the S&P 500 weekly chart?
Well, we got our answer here. About two weeks after this report, the S&P 500 broke out above its 2022 downtrend line. While it suffered a sharp pullback in February that took it below the breakout point, you could argue it staged a successful retest of that line back in mid-March. The more important takeaway though, is that the 200-week moving average held as support, something that has historically separated secular bull markets from secular bear markets.
Year 3 of the Presidential Cycle is the strongest
I would argue this has been one of the most critical fundamental reasons for the S&P 500’s sustained progress this year. As I mentioned, you do not want to underestimate the policy response from elected officials who wish to be reelected, and this has been front and center with the regional bank crisis. At +8% YTD, the S&P 500 is tracking to an even better than average Year 3 return.


