The Deep Dive
Epicenter Stocks
There is a scene in the great HBO show Silicon Valley, where venture capitalist and member of the “3 comma” club, Russ Hanneman berates the young core of Pied Piper for trying to generate revenue. “It’s not about how much you earn, it’s about how much you’re worth,” he says. “And who’s worth the most? Companies that lose money.”
You can watch the full clip above (language warning required), but perhaps no 70 seconds could so embody the investing mindset of many investors in the years leading up to February 2021. Unfortunately, for those investors, many of the companies that operated this way are now in 80-90% drawdowns that have been underway for more than 18 months.
The ETFs, stocks, and cryptocurrencies we are exploring this week are this bear market’s epicenter stocks. The stocks that are the face of both the way up, and the way down. It was technology stocks in 2000, financials in 2008, and the travel stocks in early 2020. Today, we are going to explore the technical wreckage and see what history suggests the future holds for software, biotech, solar, crypto, and other assets at the epicenter of the market’s drawdown.
*The “max drawdown” quoted throughout this report, is how much each stock/ETF/cryptocurrency fell from its 2-year high to its low point, whether that low is now or sometime a few months back.
The ETFs
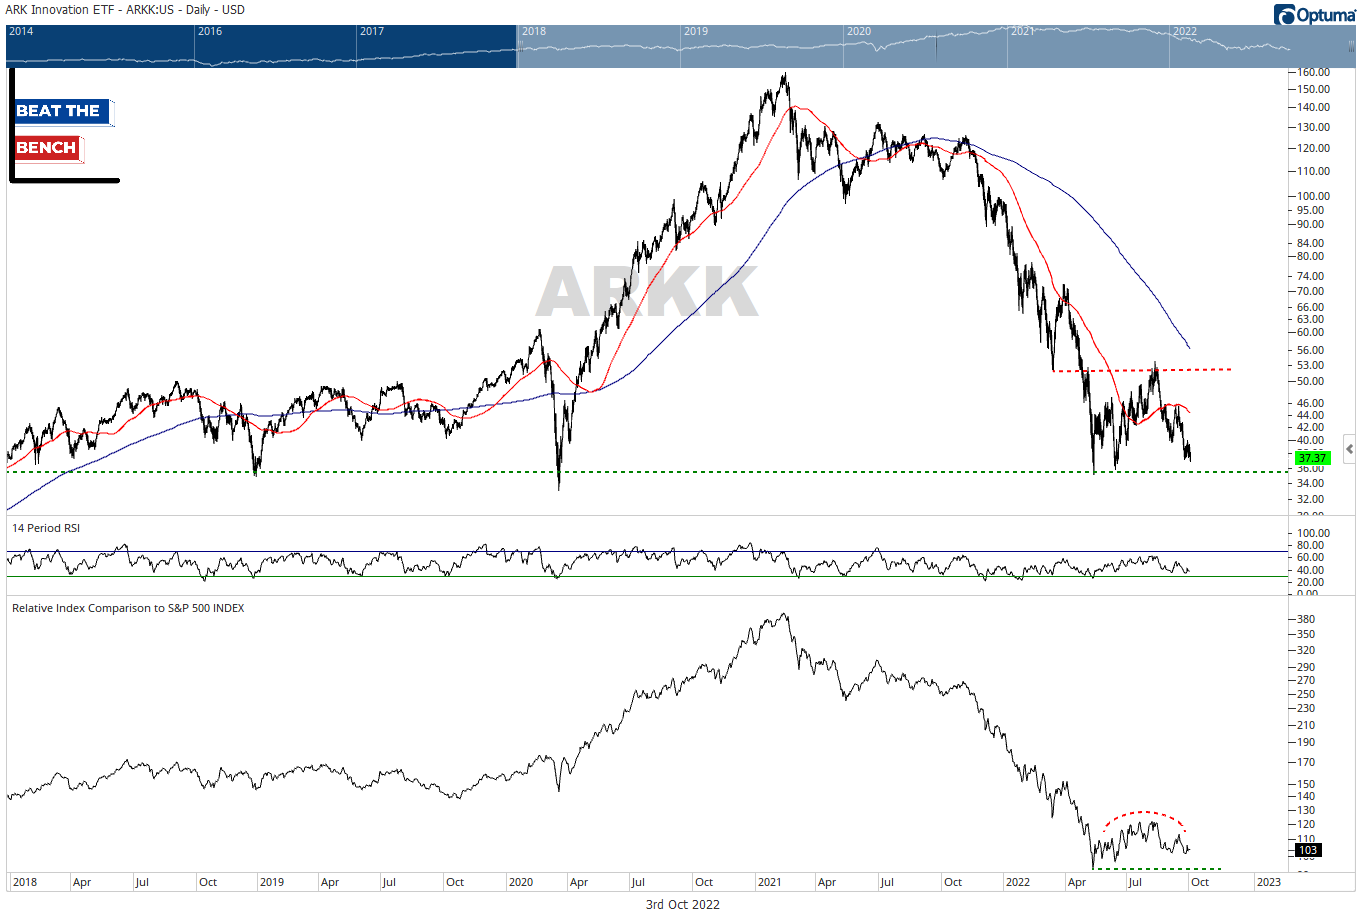
ARKK (78% max drawdown). I’ve written about this one extensively before, and it is one of my favorite proxies for what I call “speculative growth”. The fact that it didn’t make new lows in June has been one of this year’s most important developments. As I will show at the end of the report, I question if it can “lead” long-term, but if ARKK remains above $35, my base case is that we are in the midst of a bottoming process.
IPO (65% max drawdown). The Renaissance IPO ETF holds the largest, most-liquid, newly listed companies, and I genuinely wonder if they will have to change their rules to accommodate the lack of new supply. $26 is the key level here, but the pattern and overall future direction is likely similar to ARKK.
XBI (65% max drawdown). This is an equally-weighted biotech ETF and it has a pretty clear inverse H&S pattern that is trying to play out here. However, it isn’t pattern until the neckline near $96 is broken and that is a long way off. It has shown more relative strength than ARKK or IPO and individual stock analysis confirms signs of life at the top and bottom of the industry.
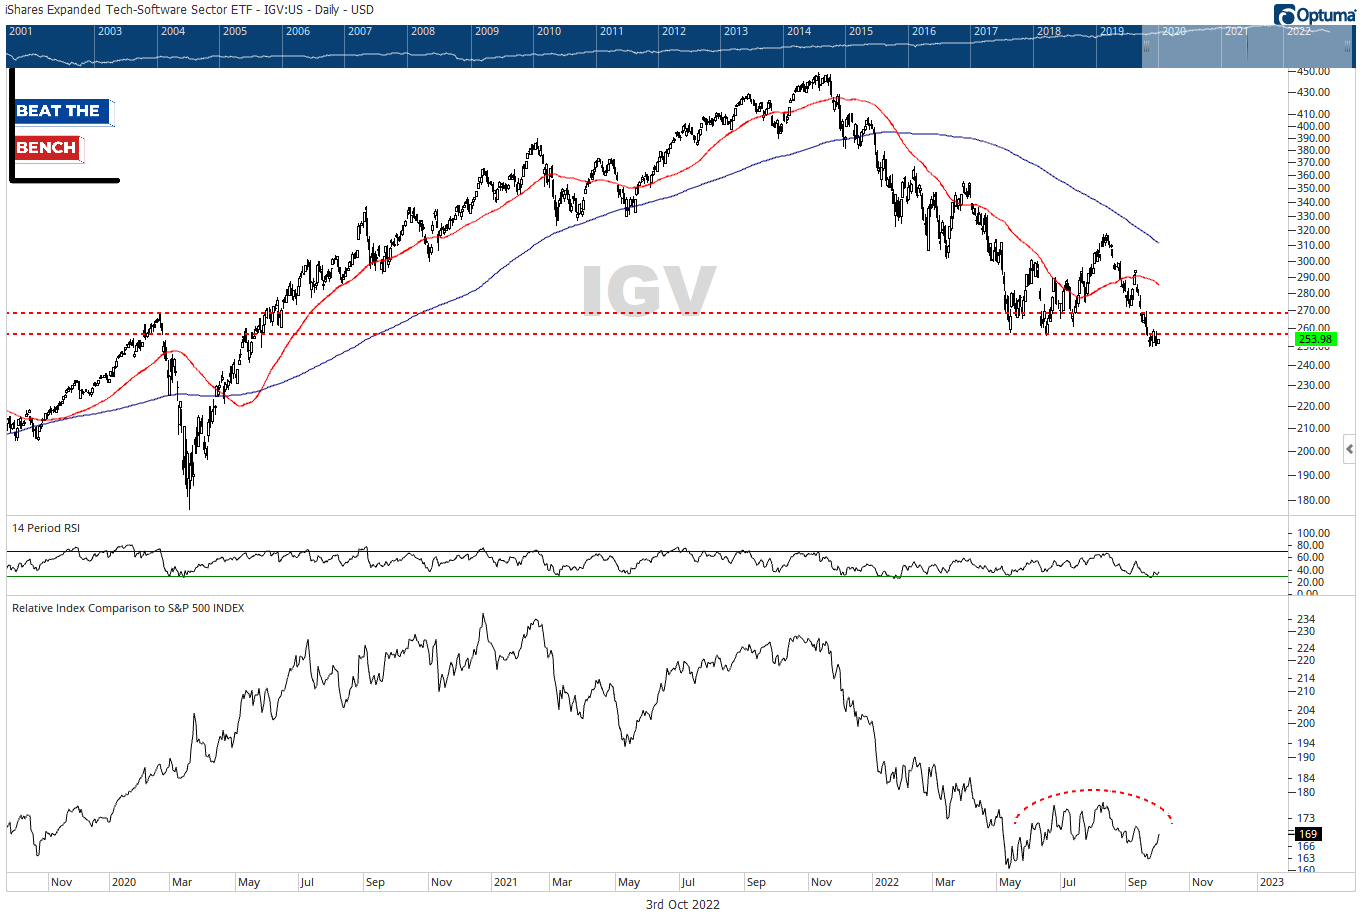
IGV (44% max drawdown). The iShares Expanded Tech-Software ETF broke below major support last week, and if below $268 it is hard to not think this works lower. However, large-caps dominate the top of this ETF and the pattern is most similar to the broad S&P 500. If both can reclaim the June lows, it could be a quick trip back to the 200-dma.
TAN (max drawdown 56%). Solar stocks were the first group in my work to bottom, with the first leg of that double-bottom pattern taking place in February. The chart really fits my definition of “Ugly” sitting right on a flat 200-dma, but recently hit 52-week relative highs. Individual equities ENPH and SEDG were highlighted in a report a few weeks back.
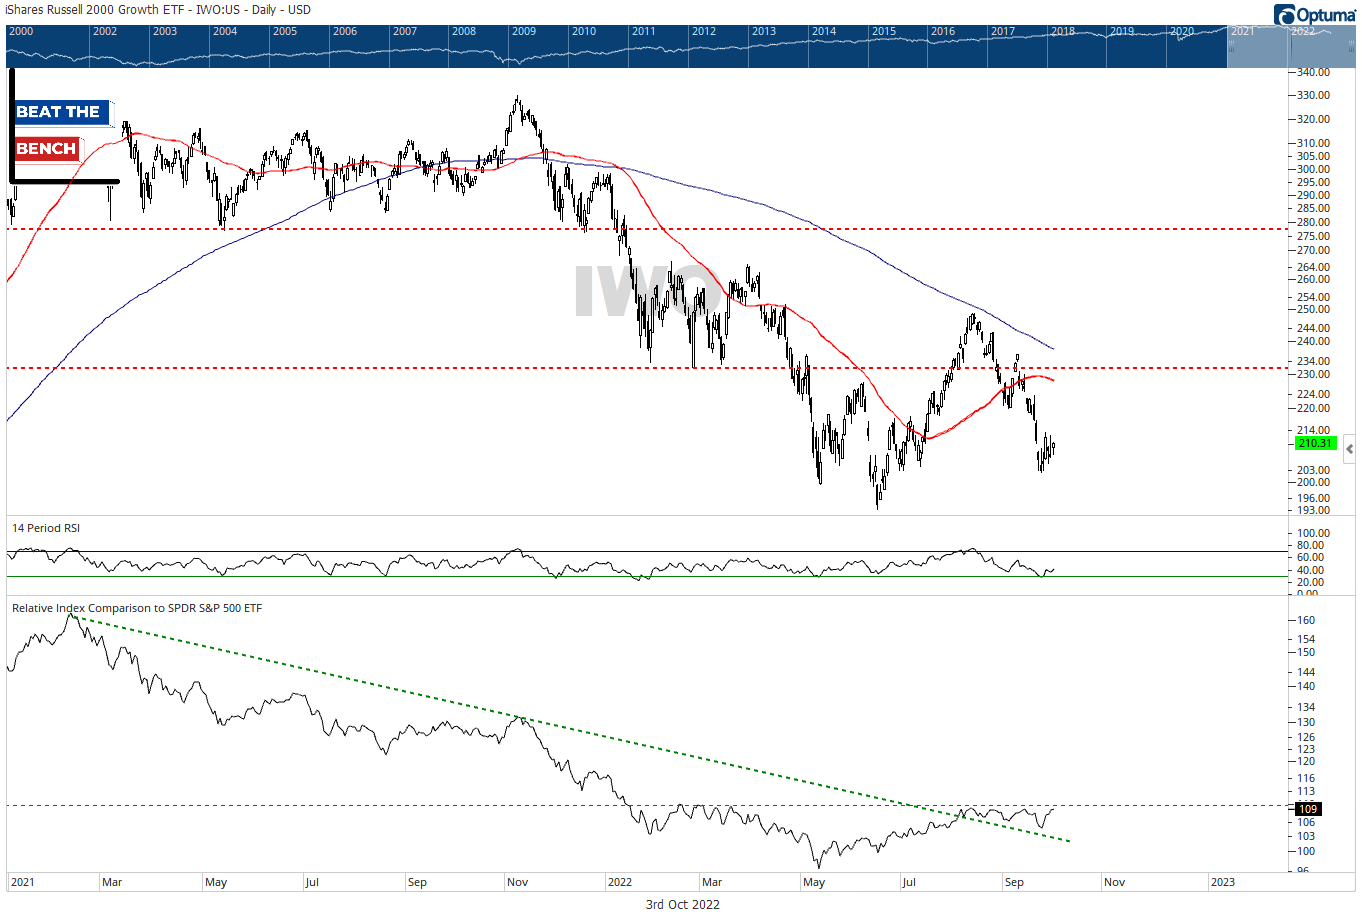
IWO (max drawdown 43%). I show small-cap growth because it is the traditional part of the Morningstar Style Box most affected by these epicenter stocks. The Russell index specifically, was worse hit because it does not screen for earnings like S&P and some other providers. This is still a rough chart below the downward sloping 200-dma, but it looks to be on the verge of breaking out to YTD highs vs. the S&P 500. This is not something I would expect to be happening if the world was ending.
The Cryptos


