Good morning!
This week’s Deep Dive is all about seasonality. Tomorrow’s session marks the last in the ever-popular Santa Claus Rally, while today kicks off another indicator with a strong track record, The January Barometer. We’ll also use today to explore the January Effect and what returns look like after a down year.
Things like seasonality don’t trump price trends in my work, but that doesn’t mean it isn’t important. As is often said:
Those who don’t learn history are doomed to repeat it
Let’s dive in!
S&P 500 +0.43% with two days to go in Santa Claus Rally
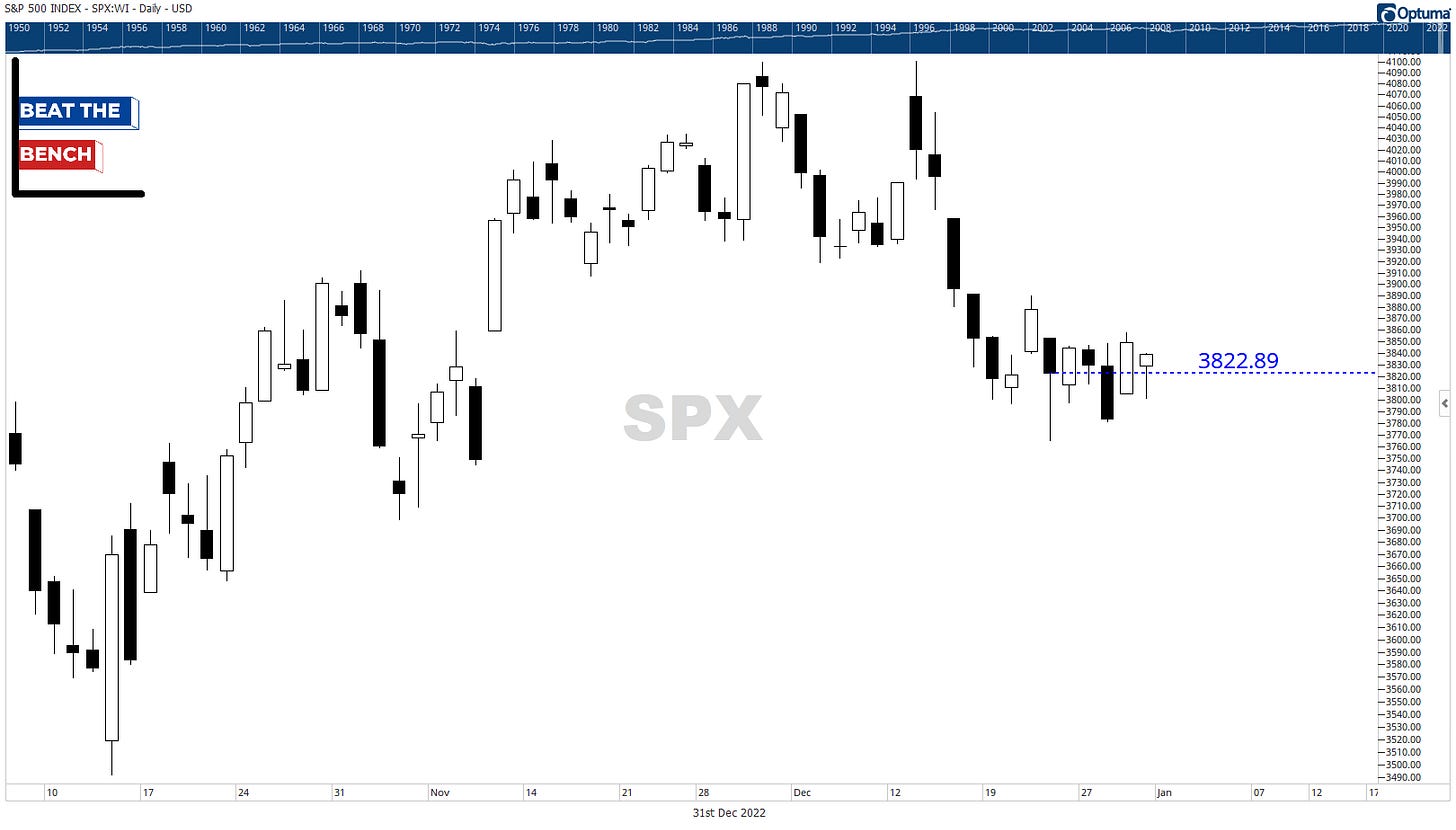
The S&P 500 closed at 3822.89 on December 22. That is your line in the sand for whether Santa delivers or not. With two days to go in the 7-day period, the S&P 500 is up 0.43%. Remember, this is an indicator more than a trading strategy, and if the S&P 500 does end lower during the SCR, it could mean more trouble in 2023.
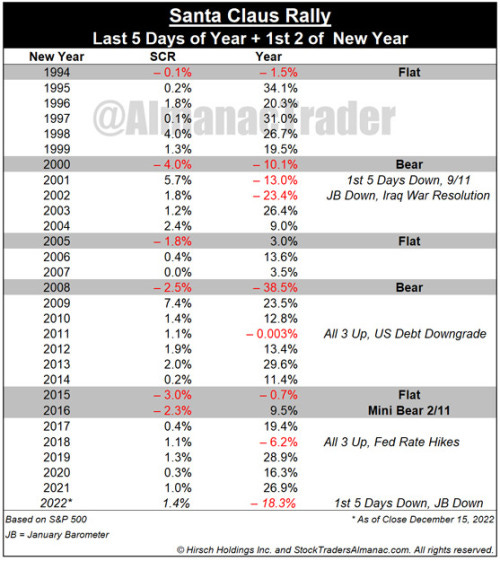
“If Santa Claus Should Fail to Call, Bears May Come to Broad and Wall.” (from Jeff Hirsch of the Stock Trader’s Almanac)
The above chart comes straight from the source, Jeff Hirsch, editor in Chief of the Stock Trader’s Almanac. As is always the case, seasonality isn’t just about blindly following historical patterns, but also taking signals from what does and doesn’t work. The Santa Claus Rally will give us our first historical clue about what 2023 might hold. If stocks cannot rally in this period, it tends to be a sign of weakness that is followed by more rough times. You can read his full blog post HERE.
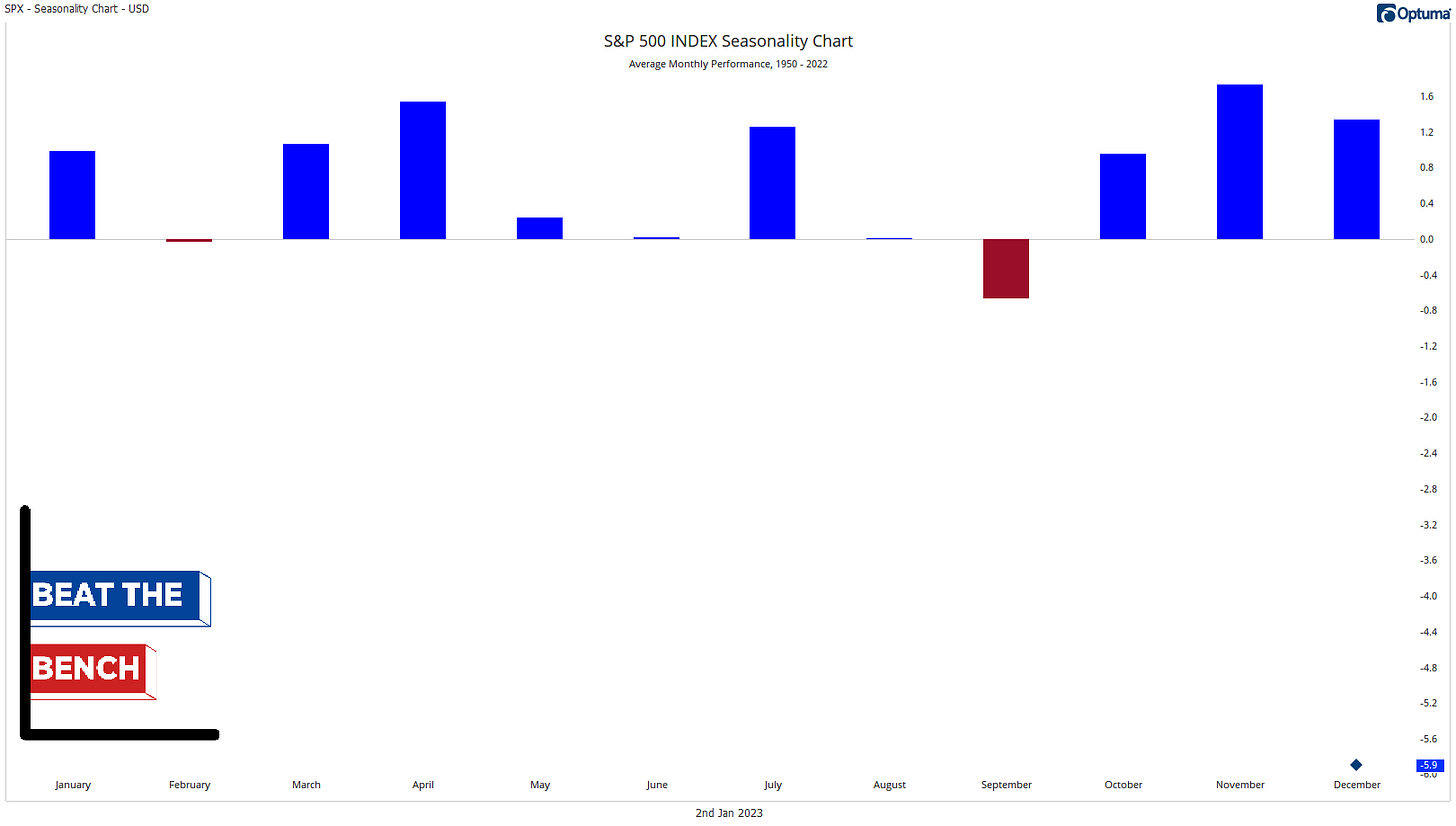
January Seasonality
Going back to 1950, January has been the fifth-best month of the calendar year, up 0.99% on average. It has been higher 57.5% of the time.
The January Barometer
Keep reading with a 7-day free trial
Subscribe to Brown Technical Insights to keep reading this post and get 7 days of free access to the full post archives.


