The Deep Dive
Good morning!
This week we’re doing a review of the fixed income market, specifically where I see value and how I believe certain investors should be positioned. Now, for investors looking for a complete 60/40 portfolio, where the fixed income is the ballast to a traditional equity sleeve, we have the Beat the 60/40 ETF model, which was updated yesterday.
However, I think in today’s environment, where there is value in fixed income depends a lot on what your goals are. Are you trying to generate income, hiding out from equity volatility, or simply trying to outperform the Agg?
This report will break down:
Beat the Bench’s base case for interest rates
Where are the most attractive areas within fixed income for certain types of investors
and ETFs that can be used to profit
Let’s dive in!
Fixed income market outlook
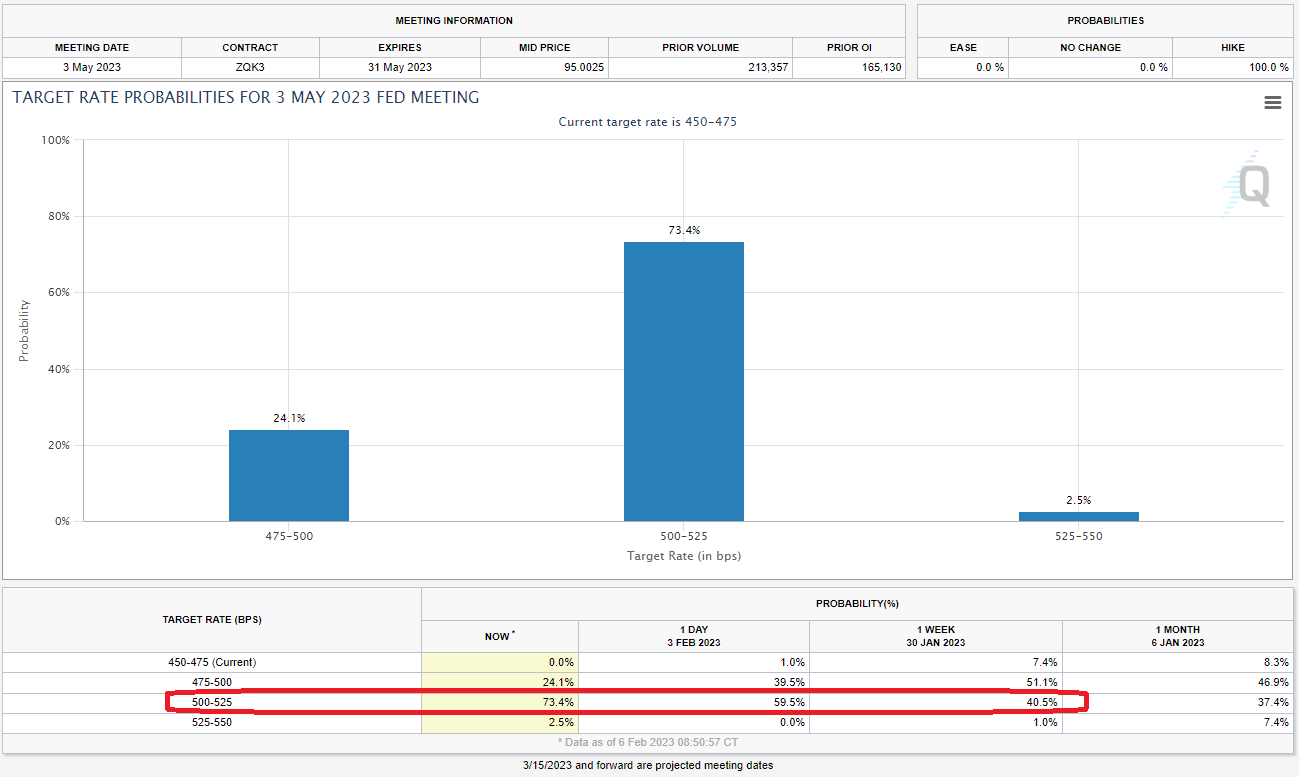
May hike looks more likely
Before last Friday’s jobs report, Fed fund futures were priced for a 25 basis point hike in March to be the final of the tightening cycle. However, since that report, the odds of an additional hike at the May meeting have risen to over 75%.
Don’t count on a cut
You hear a lot about how “the market is pricing in cuts” later this year, but I want to quickly call out what that means. While odds for the next month or two will give you a pretty accurate gauge of what is likely to happen, the farther out you go, the more what you are seeing is an “average expected rate” of a wide range of possibilities. Could be 4 cuts if the Fed breaks something, could be none. Recently, none is looking more likely, as the market’s “base case” for a cut has been pushed out to the December meeting.
The Flippening says we’ve seen the cycle highs for most tenors
The 2-year yield has jumped approximately 30 basis points in the past few days as investors have priced in the possibility of an additional hike. However, it remains below that of the Fed funds rate and 3-month T-bill yield, which the above chart shows. Once this inversion at the short end of the curve happens, it signals that the Fed’s tightening cycle is close to done. And that means the top is in for rates across the curve.
10-year yield has been glued to 3.5%
I believe the 10-year yield made its cycle highs near 4.2% back in October. But that doesn’t mean that it will even be a straight line lower, or even that there is more near-term downside for rates tactically. 10s have been glued to 3.5% over the past month, but are responding to the 200-DMA as support. A rise to as high as 3.9% looks possible, but if it occurred I believe would be an opportunity to extend duration.
Long-term support is a wild card
Keep reading with a 7-day free trial
Subscribe to Brown Technical Insights to keep reading this post and get 7 days of free access to the full post archives.


