
The Deep Dive
Tech and Growth


Good morning,
This week’s Deep Dive is taking a closer look at all things growth and technology, especially The Big 7.
Those stocks (Apple, Microsoft, Amazon, Alphabet, Nvidia, Tesla, and Meta) all underperformed the S&P 500 in 2022, amplifying its negative return. However, six of the seven are outperforming to start 2023, with only Microsoft not up at least 10%.
So is this just rotation back into the losers following tax loss selling, or is there a more sustainable trend change here?
I’m cautiously optimistic we have seen the lows for many of these stocks. The reaction to Microsoft’s earnings report last week was telling, as the company was widely criticized by analysts, but the stock shrugged off the report, rose throughout the day, and broke out the next. Nvidia has completed a significant bottoming process and Amazon is finding support in a range it traded in for more than 2 years.
However, from a leadership standpoint, I remain highly skeptical that growth stocks as a whole are where we should be focused. I’ll change my mind if the trend changes, but the intermediate-term trend is little changed by the last three weeks.
Today’s report will review
Absolute and relative improvement for key groups
The technical set-up for The Big 7
Why knowing what you own is key to selecting ETFs
Relative style trends
and more!
Earnings coming later this week (courtesy of @ewhispers)

Roughly 1/3 of the S&P 500 market cap reports this week, and while there are notable companies from across the sector spectrum, it is the biggest week because of mega-cap tech. META reports Wednesday after the bell, while Thursday sees Amazon, Apple, and Alphabet announce after the close. Just those 4 stocks account for more than 16% of the S&P 500.
Technical improvement across the board
The bottom looks to be in for 2022’s worst sector

Communication services was the worst performing sector last year but is in the lead to start 2023 with a more than 14% gain. XLC completed a textbook inverse head and shoulders pattern that gives a measured target of roughly $60. The relative chart doesn’t give the green light for betting on outperformance but does suggest its worst days are behind it.
Discretionary testing its 200-DMA

The SPDR Consumer Discretionary ETF ran right up into its 200-DMA last Friday and sold off to start this week. $132 is important support after a false breakdown below that level in December. Relative to the S&P 500 this is a lagging sector, but that is almost exclusively due to the Amazon and Tesla impact. The equal-weight version of this sector bottomed in June and is at 11-month relative highs vs. the S&P 500.
Negative bias toward tech

Until XLK can clear its December highs at $139.33, it is prudent to be skeptical of this rally. The sector remains below a downward-sloping 200-DMA relative to the S&P 500.
Golden cross for equally-weighted technology
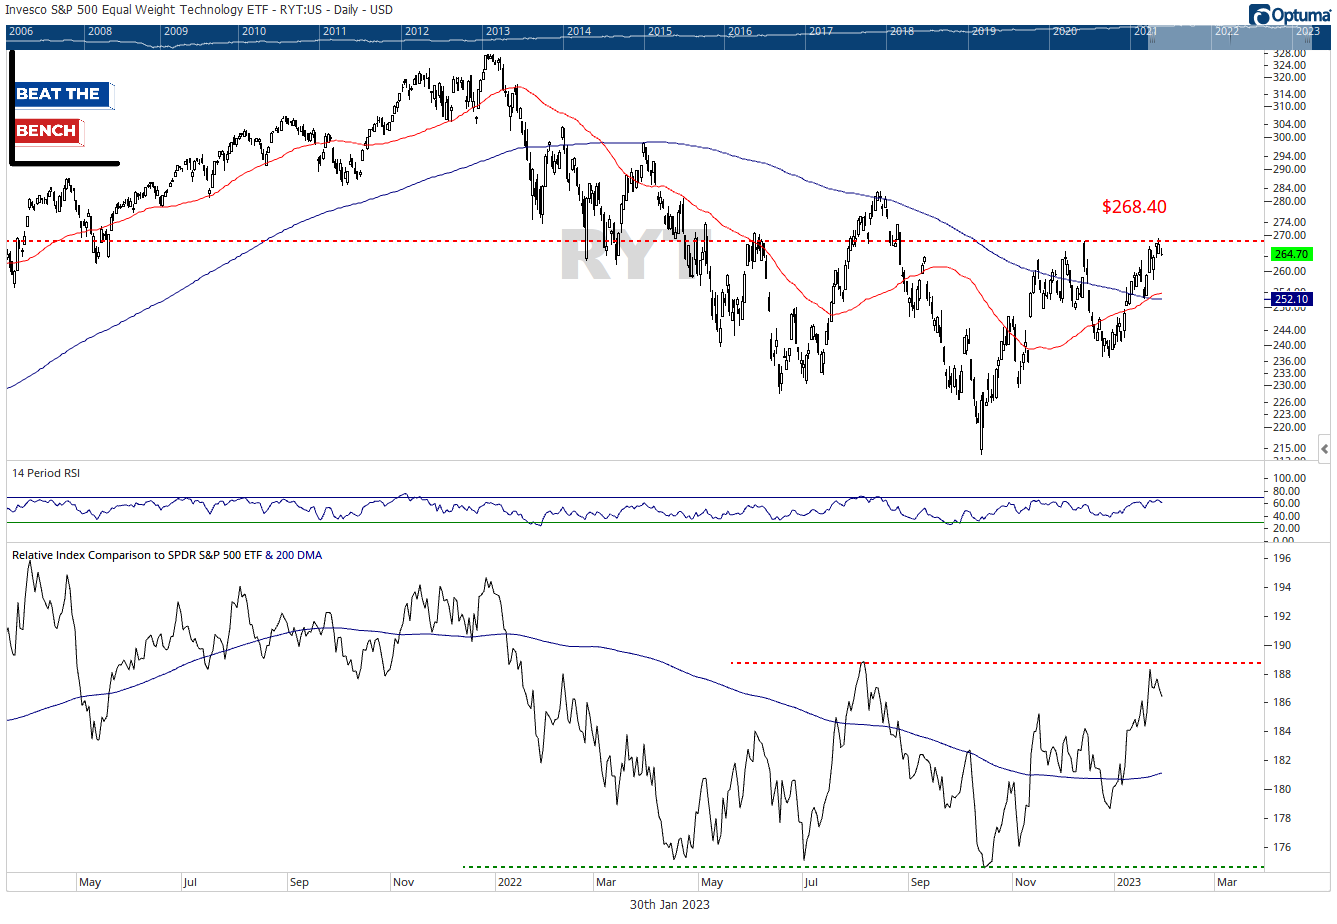
RYT’s 50-DMA crossed up above its 200-DMA last week, but looking at the chart you certainly can’t call this an uptrend. Removing the impact of the top weights helps, but at best this is neutral in absolute terms and relative to the S&P 500.
