The Deep Dive
The Real Estate Sector
Good morning,
This week, we’re taking a closer look at the real estate sector. Real estate is the second smallest sector in the S&P 500 at just 2.8%, ahead of only materials, but offers interesting macro signals given its importance to the economy. Despite often being labeled as defensive due to its high income payments, in true market downturns, real estate is often anything but. This has proved to be the case once again and through the end of last week, the S&P 500 Real Estate Sector was down 26.1% YTD, trailing the S&P 500’s 17.5% drop by nearly 9%.
So is the underperformance an opportunity, or just getting started? Let’s dive in!
The Bull Case
Peak mortgage rates? Now down 75 bps from the highs
The average 30-year mortgage rate in the US bottomed at 2.65% in January 2021. After that, it posted its most dramatic rise since the early 1980s, topping out at over 7% before pulling back to current levels near 6.3%. We’ll save you the mortgage math examples, but the housing market has understandably come to a standstill.
However, markets trade on relative changes, and we are of the mind that 7.08% will be the peak for this rate for quite some time. That should provide some relief to REITs.
*The way-too-early reaction to this morning’s CPI print is extremely bullish for stocks and bonds and helps to confirm this view. Stocks are soaring at the open and the 10-year yield is below support at 3.5%. However, we need to see 10s end the week below 3.5% to say the bond rally continues.
Bullish divergence on the weekly relative chart
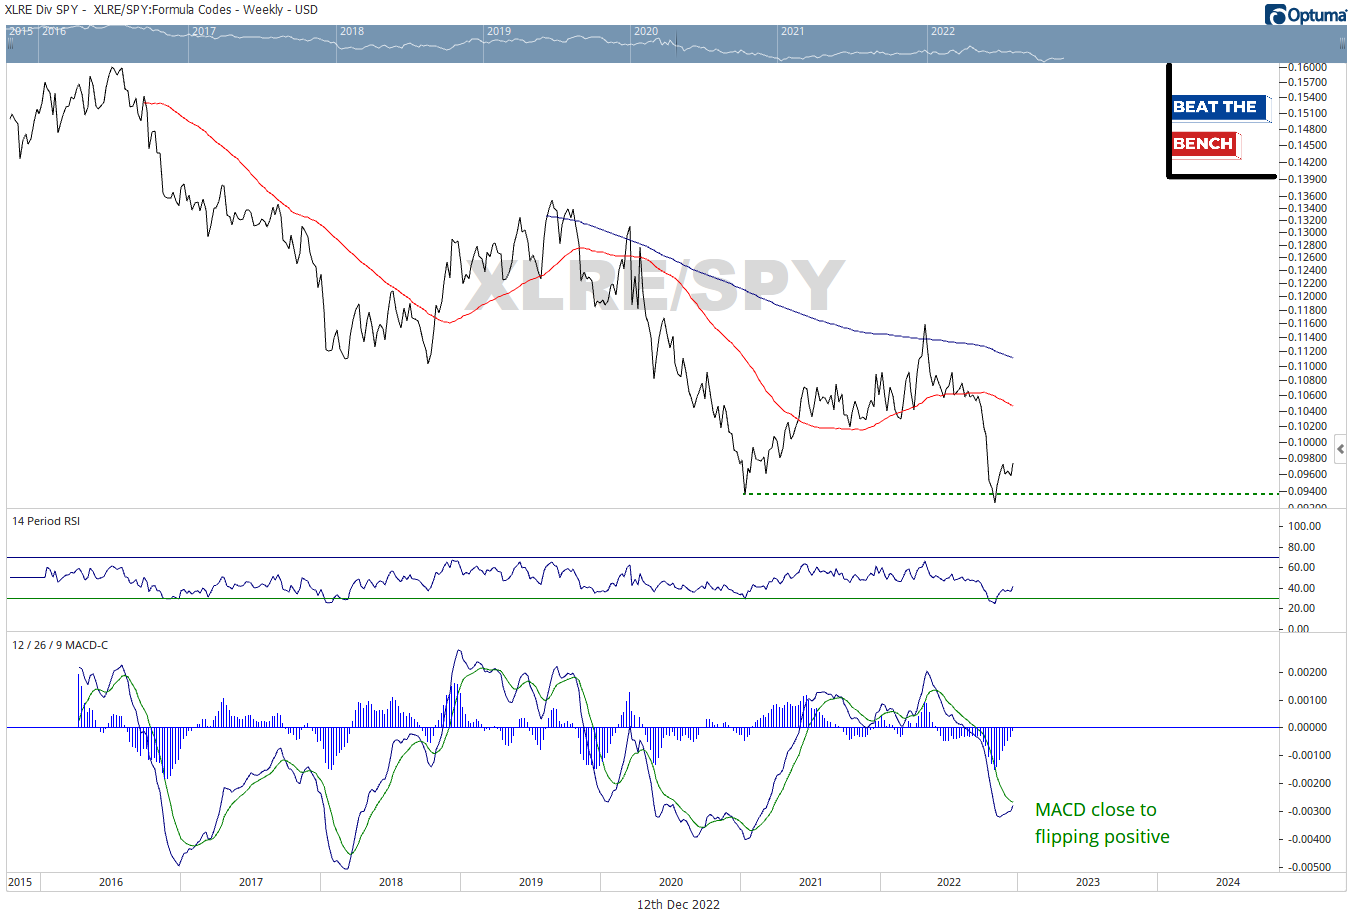
Despite the YTD underperformance, there are some positives on the weekly relative chart of real estate. After a brief dip below its January 2021 relative lows, real estate has outperformed the S&P 500 by more than 5%. And it is no coincidence that the recent relative low coincided with the late-October peak in longer-term interest rates. In addition, the weekly MACD on our chart is close to flipping positive from less oversold conditions than 2021, suggesting more relative upside for REITs.
Are homebuilders trying to tell us something?
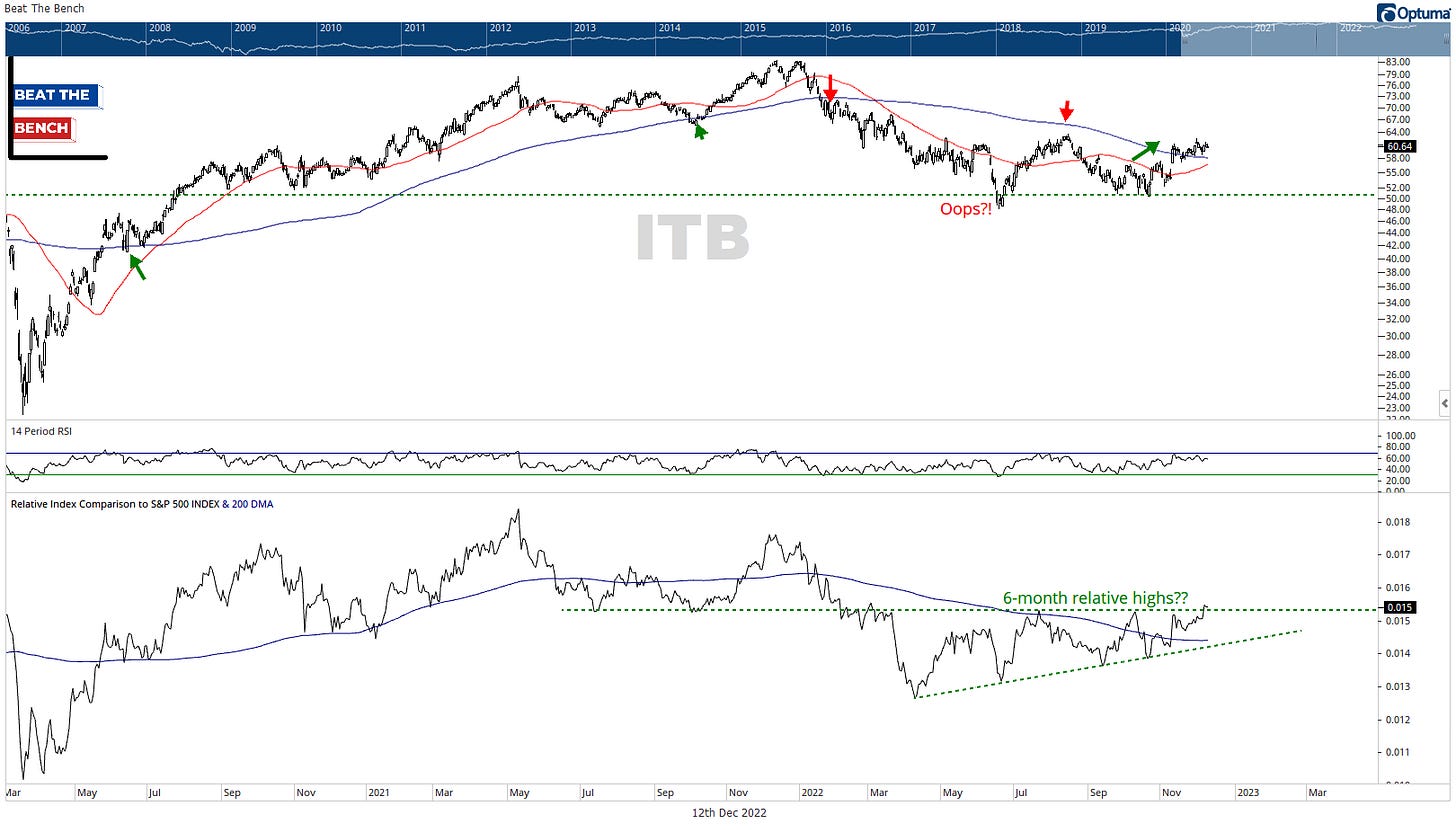
While they are different markets and different stocks, one would expect REITs and home construction stocks to sport a heavy correlation. Not recently though. ITB, the iShares US Home Construction ETF just broke out to 6-month relative highs last week and finds itself on the right side of a 200-day moving average that has been a key pivot point over the past few years.


