
The Deep Dive
Foreign Stocks


Good morning,
In yesterday’s Playbook, I shared some bullish charts on Japanese equities, and previous weeks have seen us look at Europe and China. So for today’s Deep Dive, I thought it would be prudent to put together a comprehensive overview of the international equity landscape.
Both of the Beat the Bench ETF models sport small allocations to VEU: The World ex-US ETF, so inherently the models are making a bet that international equities outperform some portion of the US equity market. And in fact, they are. VEU has outperformed the S&P 500 YTD (+8.9% vs. +7.7%) and is outperforming 8 of the 11 S&P 500 sectors.
Today’s report will review:
The technicals for EAFE and Emerging Markets
Key countries and components of those groups
Relative strength of key geographies
and more!
Let’s dive in!
EAFE
EFA: MSCI EAFE ETF

Foreign developed markets as a whole are pausing just above their February highs, in contrast to the S&P 500 which is pausing just below its February high point. Relative to the US, EAFE remains in an uptrend and just off 3-month highs.
Europe
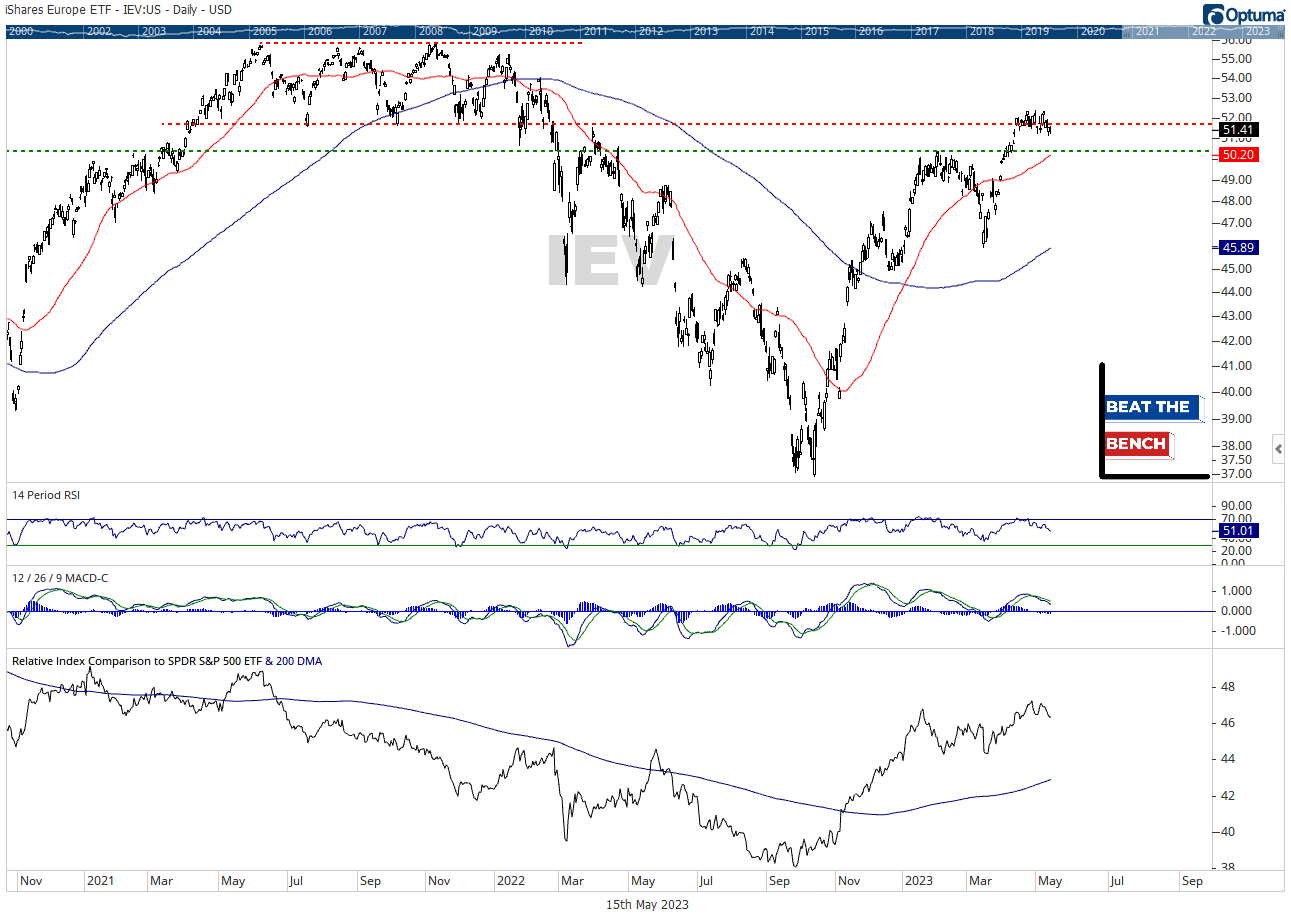
Europe is the largest region within EAFE, representing about 50% of exposure if just looking at the mainland, and 65% of EAFE if you include the United Kingdom, which our proxy (ticker: IEV) does. IEV is above its February highs and leading vs. the S&P 500, but is arguably failing here at $52, where the breakdown in 2022 began. This bears watching, but no cause for alarm if we’re above $50.
Japan

Japan is the largest individual country within EAFE and for an apples-to-apples comparison we’re looking at EWJ: The iShares Japan ETF. EWJ just broke out of an inverse head and shoulders pattern that targets $71/share. That may be a bit lofty near-term, but after clearing the pre-Covid highs just above current levels, there is little to call resistance until $65. Relative to the S&P 500, Japan is holding above a rising 200-DMA.
In yesterday’s Playbook, we reviewed other Japan charts, which can be viewed here including:
