
The Deep Dive
Healthcare


Good morning,
This week we’re doing a deep dive into the healthcare sector. Healthcare’s dramatic fall was the original inspiration for this chart, which showed that all sectors, whether cyclical or defensive, are usually dramatically higher five months from a major bear market low.
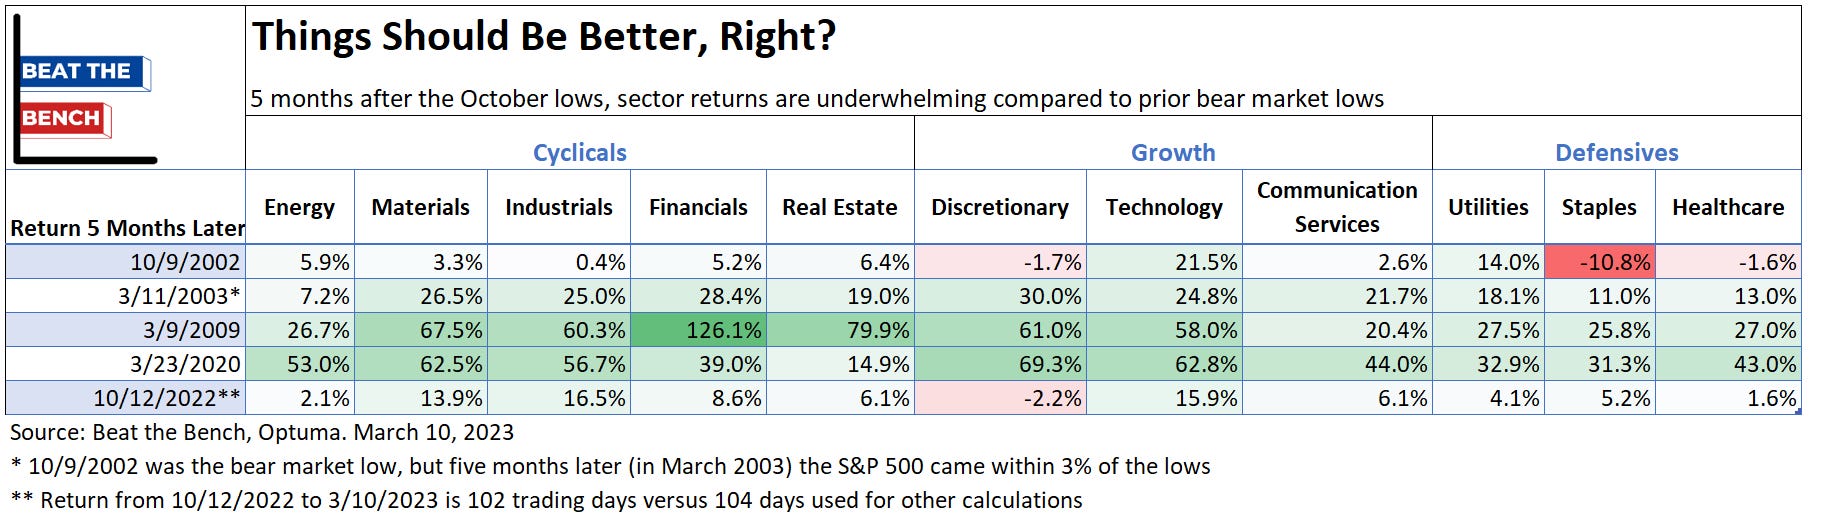
As it stands now, healthcare is just 6% above its closing low from 2022 (which was technically made back in May) and trailing the S&P 500 return by nearly 10% YTD. However, even if the sector isn’t leading, at a 15% weighting it is the second largest sector in the S&P 500 and a diverse sector worth a closer look.
This week we will look at
The absolute and relative technicals of XLV
Market internals and sentiment
Key ETF sub-groups
and leaders and laggards at the individual equity level
Let’s dive in!
Top Down
Big picture: Rangebound despite recent decline
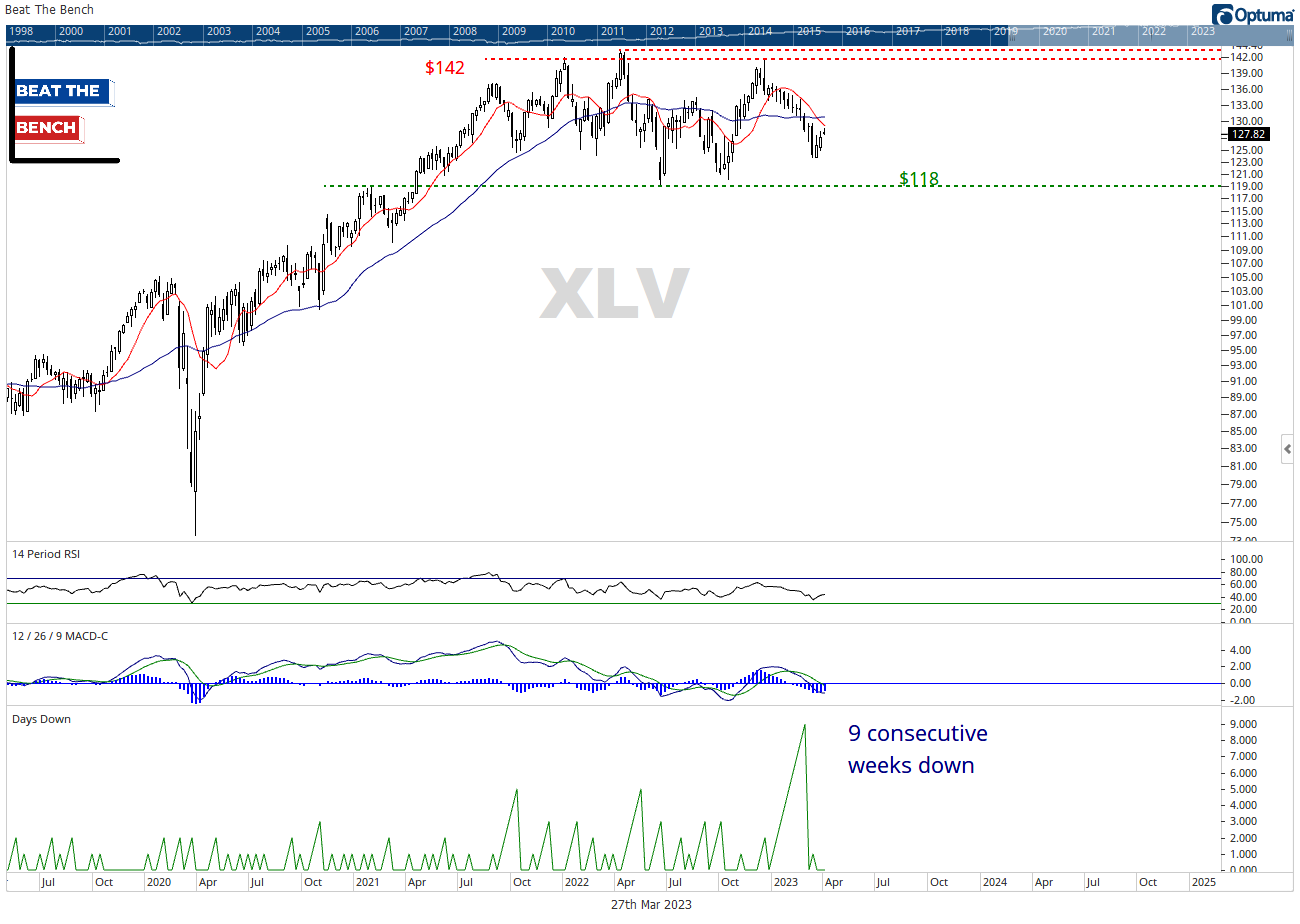
Healthcare has been going nowhere fast since way before it was cool. This is despite a recent 9-week losing streak that was by far the longest in the history of the XLV ETF, including the 3 prior bear markets. The 18% range has support near $118 and resistance just above $140/share. From a structural perspective, this looks more like a base than a top, but the very important pharma chart we will see later makes me a bit worried. No reason to be too wedded to a view until the range breaks.
Tactical view: Testing downtrend channel resistance
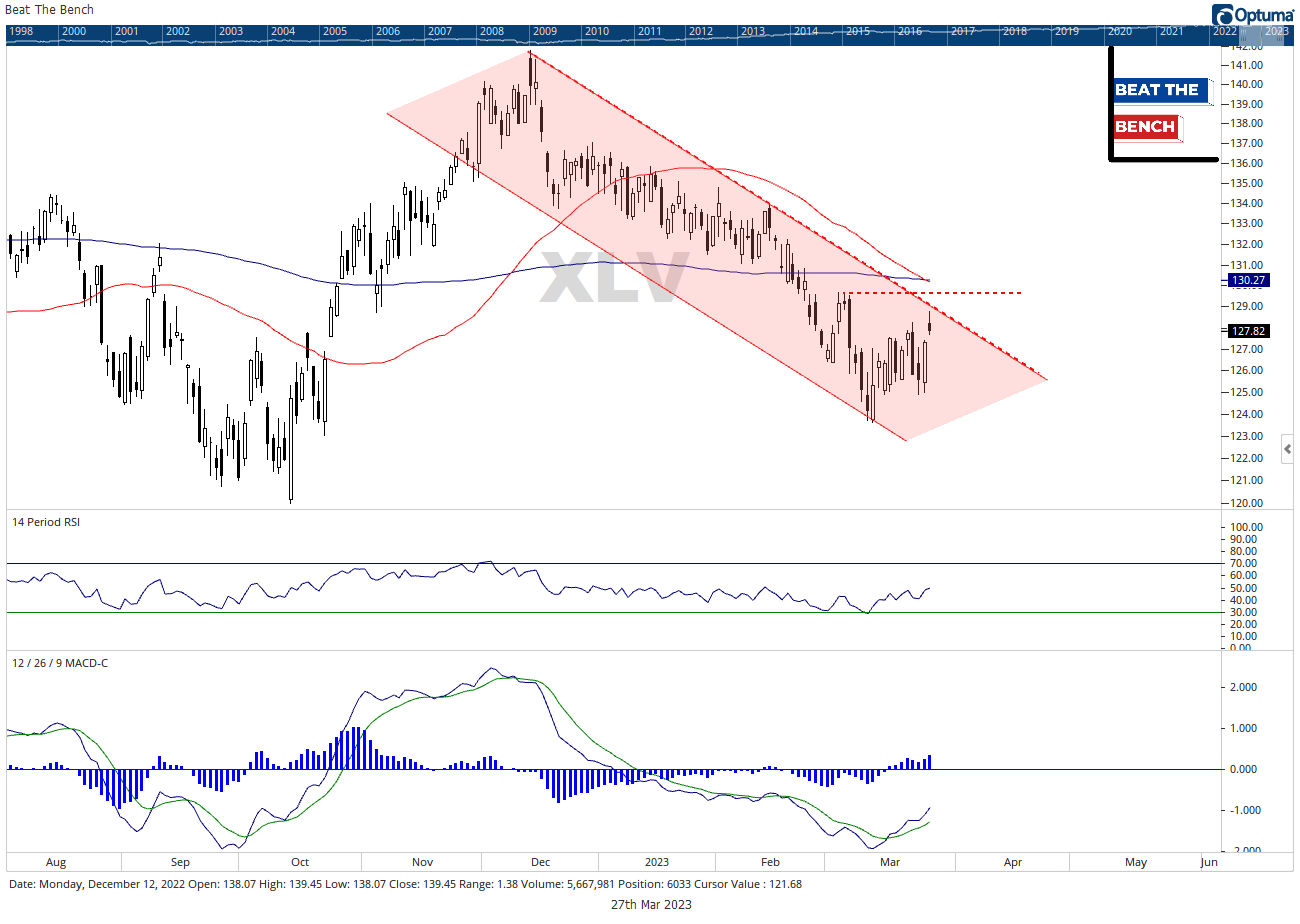
On a more short-term basis, XLV’s daily momentum is turning up from extreme oversold conditions but has significant resistance in the 2% above Monday’s close. The next 2% higher would require overcoming:
Monday’s intraday high
Downtrend channel resistance
The 50-DMA
The 200-DMA
All in all, that makes it a tough place to consider adding here.
