The Deep Dive
The Bear Case
Good morning,
Welcome to Part II of a quick series where we explore the market’s directional bias exclusively from one side (you can read The Bull Case here). Today, it’s the bears’ turn, so put on your Dr. Doom hat and let’s see how strong the argument is that equities could move significantly lower from current levels.
Trends trend
S&P 500 and “the line everyone sees”
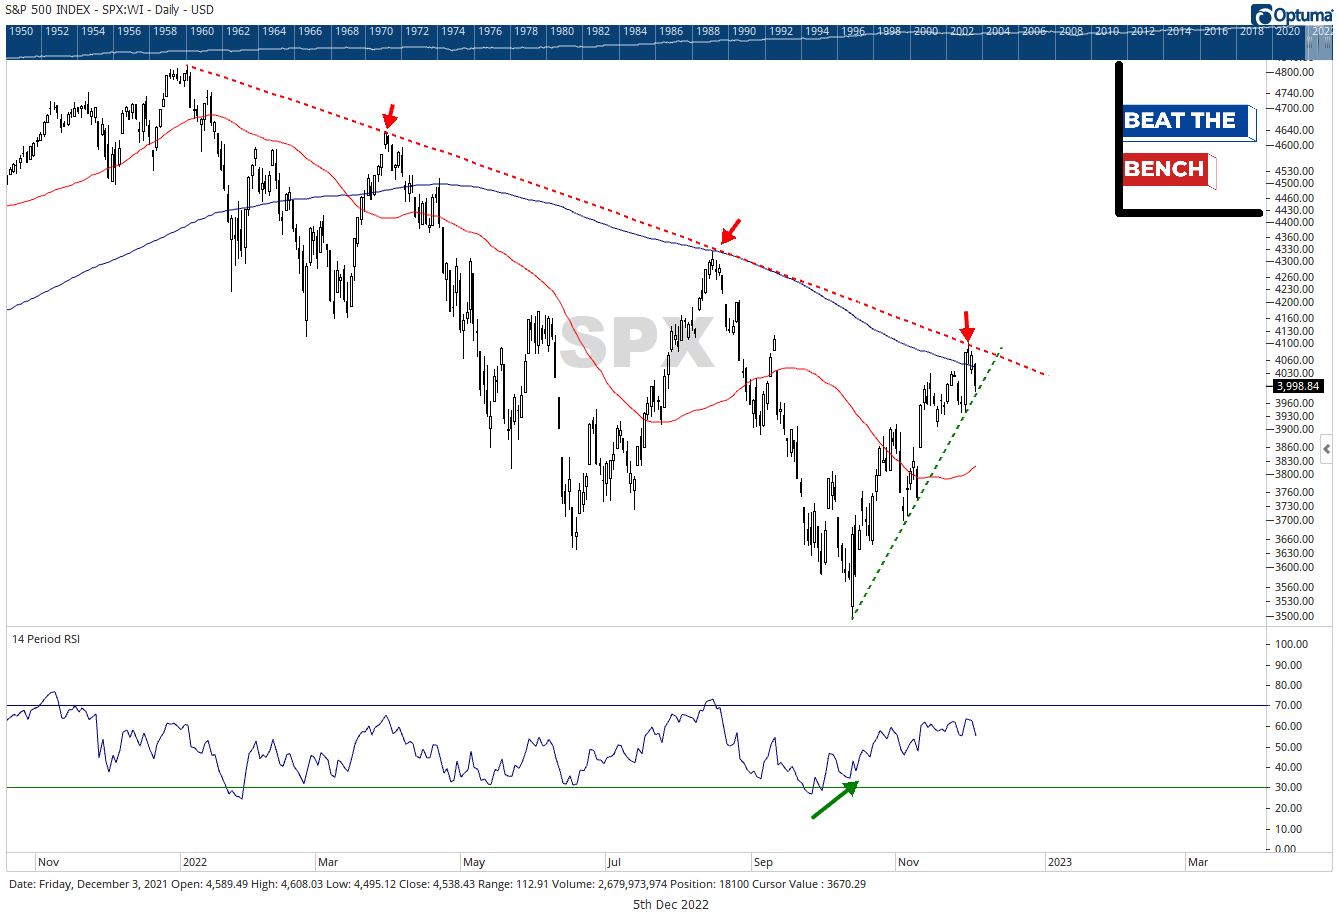
The S&P 500 is in a downtrend. There are no two ways about it. We have a clearly defined series of lower highs and lower lows throughout 2022, and until that pattern is broken, the bear market is ongoing. The S&P 500 ran right into the downtrend line connecting those peaks last Thursday and has so far been unable to overcome it. The bulls have the shorter green uptrend line from the October lows, but one of these two is going to have to break this week.
Defense is still in the driver’s seat
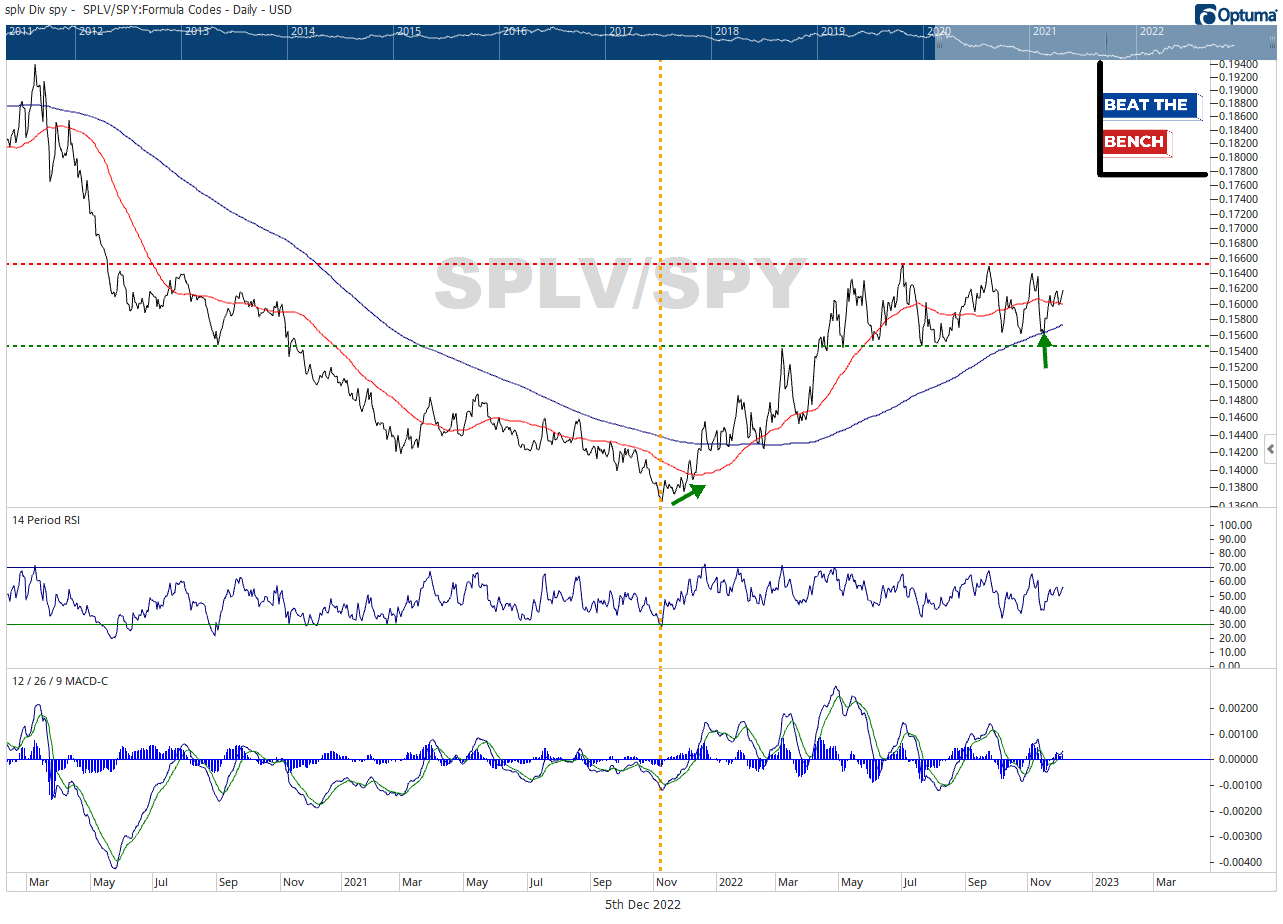
Low vol outperformance was one of our first clues that 2022 was starting off on shaky ground. The SPLV:SPY ratio bottomed in early November, meaning defensive stocks led the final two months of 2021 even as the market continued to make new highs. This risk-on/risk-off signal is still above a rising 200-dma but hasn’t gone anywhere in more than six months. A break upward would be a big risk-off signal for equities.
The Dow has been the best index, but short-term caution is warranted
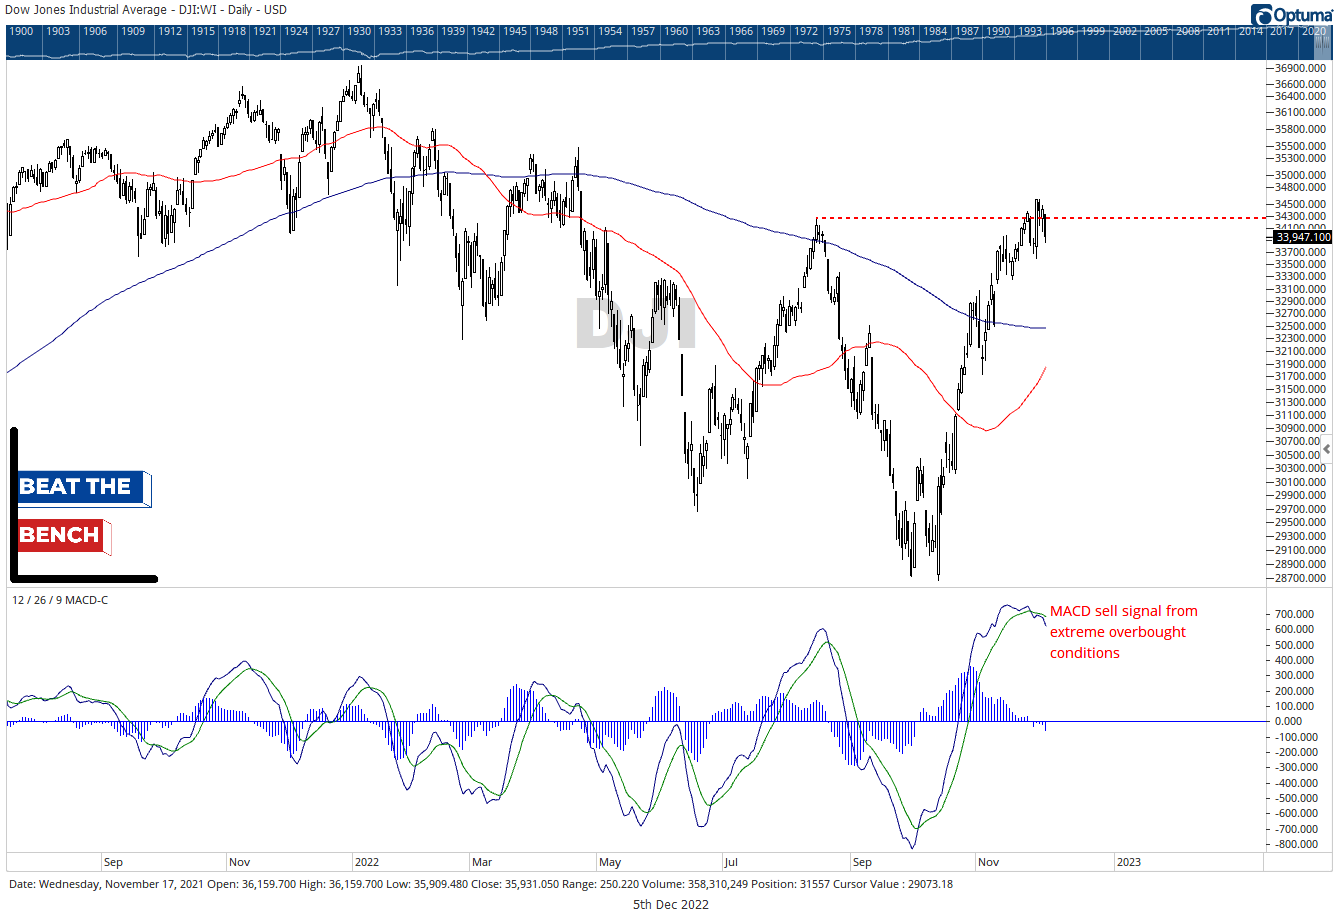
The Dow Jones Industrial Average has benefitted tremendously from its defensive/value lean relative to the S&P 500 and Nasdaq. However, its 20% rally from the lows is showing some signs of exhaustion, as a MACD sell signal was triggered last week following extreme overbought conditions. Other indexes are close to triggering the same signal, one of the biggest reasons why we are not yet closing the underweight to stocks in the balanced asset allocation. Lastly, it should be noted that the Dow Transportation Average never reached its August highs.
Stocks now way more expensive vs. bonds
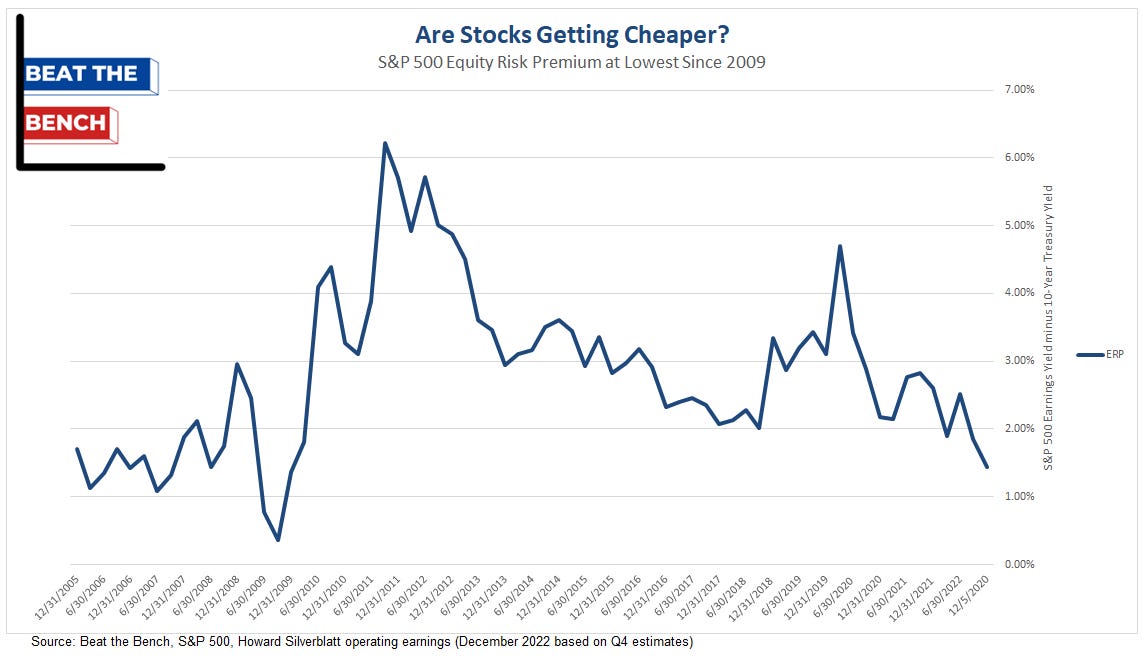
We don’t do a lot of fundamentals and valuation work here at Beat the Bench, but we do like simple analysis and relative value. Enter: The Earnings Risk Premium or ERP which is simply the earnings yield of the S&P 500 minus the 10-year Treasury yield. The premium you are getting paid to take on stock risk is now at its lowest level since 2009, whether you use Q3 TTM earnings (already in the book) or projected Q4 earnings (which our graph shows).
Dollar still above breakout point


