
The Deep Dive
Materials


Good morning,
This Tuesday we’re doing a Deep Dive into the materials sector. Despite falling slightly with the broader market, materials have been the second-best-performing sector over the last two weeks. Structurally, the sector is the smallest of the 11 sectors, coming in at just 2.5% of the S&P 500, but boasts some of the more interesting long-term charts. So could materials status be poised to rise?
This week we will review:
The top-down absolute and relative set-up
Key stocks within US materials
and international opportunities
Let’s dive in!
Top-down
The tactical view

Like most of the US market, materials posted an impressive reversal last Friday. Even more bullish, that reversal occurred at a significant pivot point just above $78/share for XLB, and if momentum can continue this week, will mark a second higher low.
Relative to the S&P 500, materials have been a volatile, but mostly neutral trend over the past two years, but the last two weeks of outperformance does come above the 200-DMA.
Long-term change in leadership?

Perhaps the most intriguing chart in today’s report is the long-term relative look at materials vs. the S&P 500. After underperforming since 2012, the XLB:SPY ratio has broken above the decade-long downtrend and is now trying to turn that line into support. A lot of charts like this have been featured for energy over the past two years, so could materials be the next sector to try and double its small weight in the S&P 500?
Similar setup for global materials
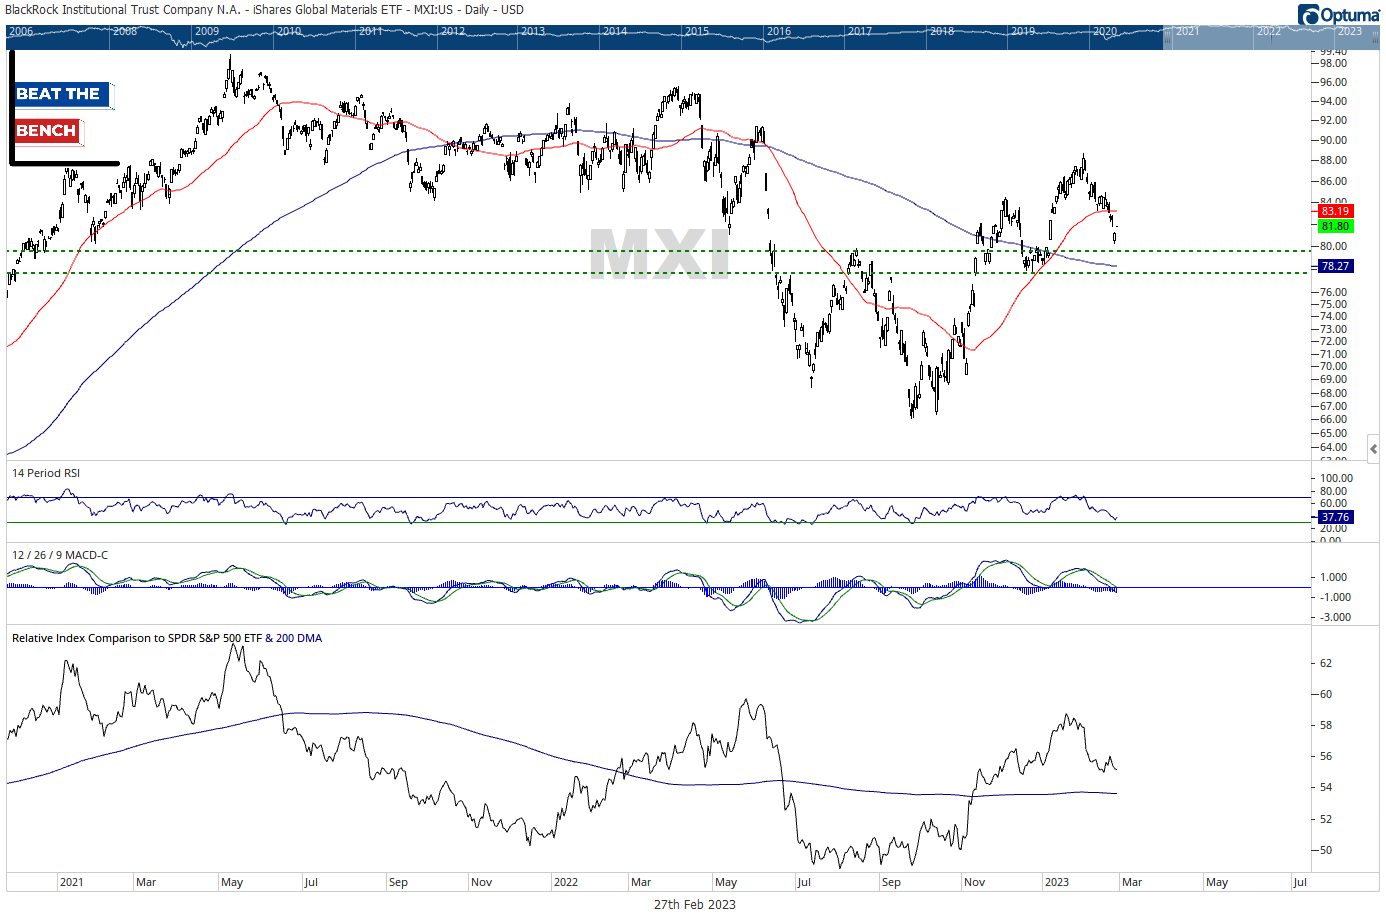
Many of the largest materials companies are located outside the US, but the global materials ETF MXI has a very similar setup to XLB. Above the range near $78, it looks like a better long than short.
