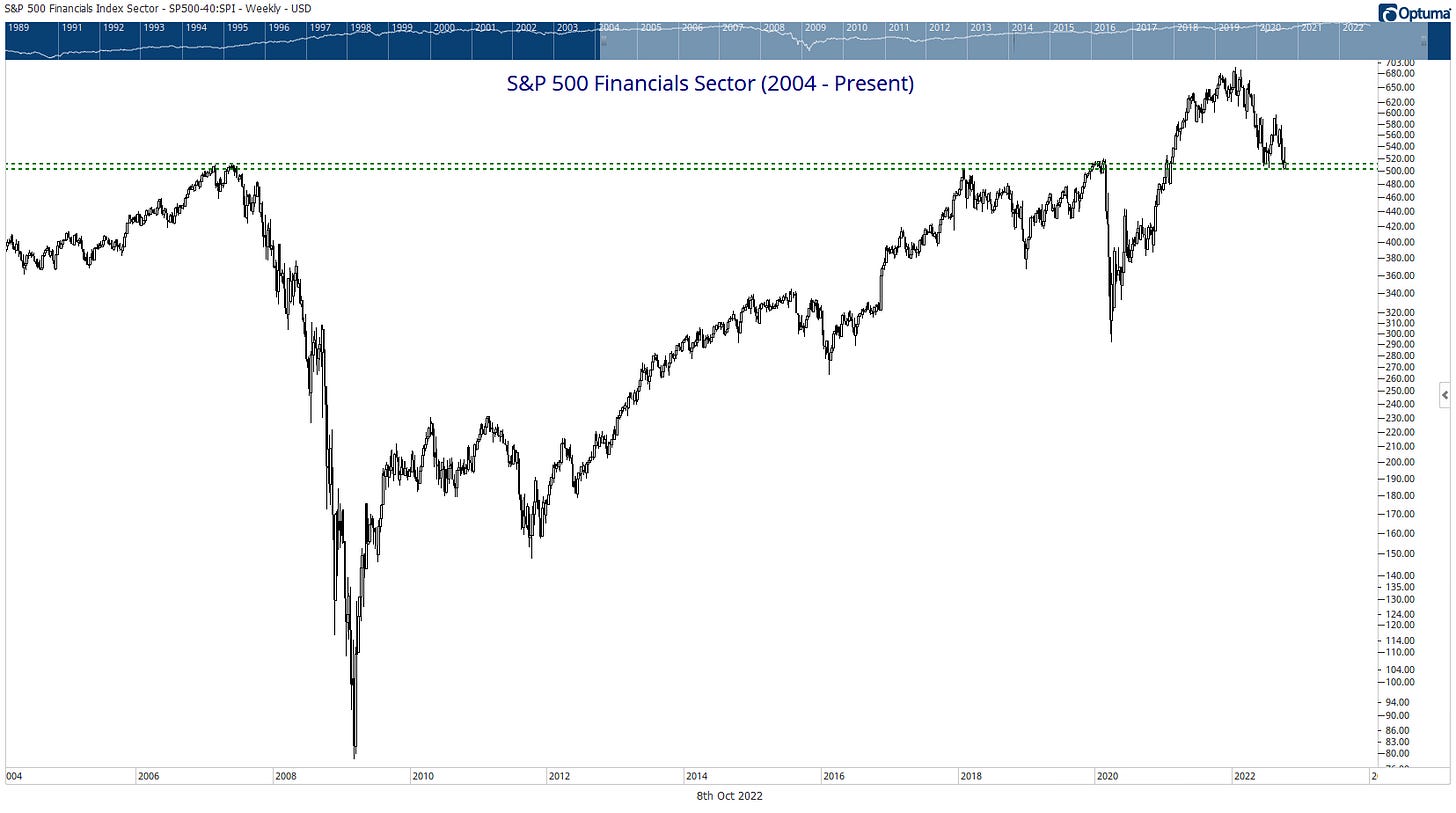
At the CMT Symposium back in April, speaker Jim Bianco said, “The only thing a bank stock is good for, is making a portfolio manager an ex-portfolio manager.” Sifting through longer-term charts for this report, it is easy to see his point.
Financials have mostly avoided the spotlight so far this year, as their 21% YTD decline is just slightly better than the broad market’s, and far from the opposite extremes of growth sectors and energy. However, that is likely to change for at least this week, as the major banks begin reporting Q3 earnings.
Ahead of those earnings, we’ll review where the S&P 500’s third largest sector stands, what groups are outperforming and the technical set-up for those stocks that report this week. Let’s dive in!
S&P 500 Financials Sector at historic support level
It’s hard to find a cleaner, more technically clear chart than the one above. The broad financials sector is currently resting on what was a 15-year resistance level and should now be a major support level. It worked in June, but a break below would be an ominous sign not just for financials, but for the entire market.
Zooming in
Taking a closer look at actionable trading levels for XLF, the sector is hanging onto the bottom end of a support range just above $30/share. If stocks can rally here, $35-36 represents a cluster of different resistance levels that will be tough to clear.
Financials should be benchmark-weighted (13.2% of S&P 500)
The relative trend of financials vs. the S&P 500 suggest that not having an overweight or underweight is likely the best course of action. Price is right at a flat 200-day moving average.
Breadth is in-line with the broad market
19.7% of stocks in the financials sector are above their 200-day exponential moving average, just a hair better than the broad market’s 18.2% reading. However, financials are showing a bullish divergence on this metric, with a higher low even as price retests the June lows.
Interest rates higher, but yield curve deeply inverted
You have all seen this chart, but we have been so deeply inverted for so long, it can’t hurt to remind you. Not only do yield curve inversions signal recessions, they cause them. That certainly isn’t a tailwind for financials.
Keep reading with a 7-day free trial
Subscribe to Brown Technical Insights to keep reading this post and get 7 days of free access to the full post archives.


