
The Deep Dive
Industrials


Good morning,
This week we’re going deep on the industrials sector. As I mentioned yesterday, one of the most concerning developments for the market recently has been a dramatic break in industrial stocks. They are highly cyclical, historically very correlated to the S&P 500 Index, and had been leadership coming into 2023.
However, a number of those previous leaders now look like they have suffered large false breakouts, so I wanted to provide a more in-depth look at the group and the implications of further weakness.
Specifically, this report will cover:
The top-down technicals of the industrials sector
Relative strength within key subgroups
Big movers at the individual equity level
and why the recent action has echoes of 2008
Let’s dive in!
Top-down view
Absolute set-up of XLI

The big-picture absolute view of the industrials sector is neutral. While an eventual breakout above $108 would be extremely bullish, the sector acted incredibly poor at its recent test of $104. If below that, it is hard to be tactically bullish on the sector. First support comes in at $95 and the 200-DMA.
Relative chart so bad it is good?
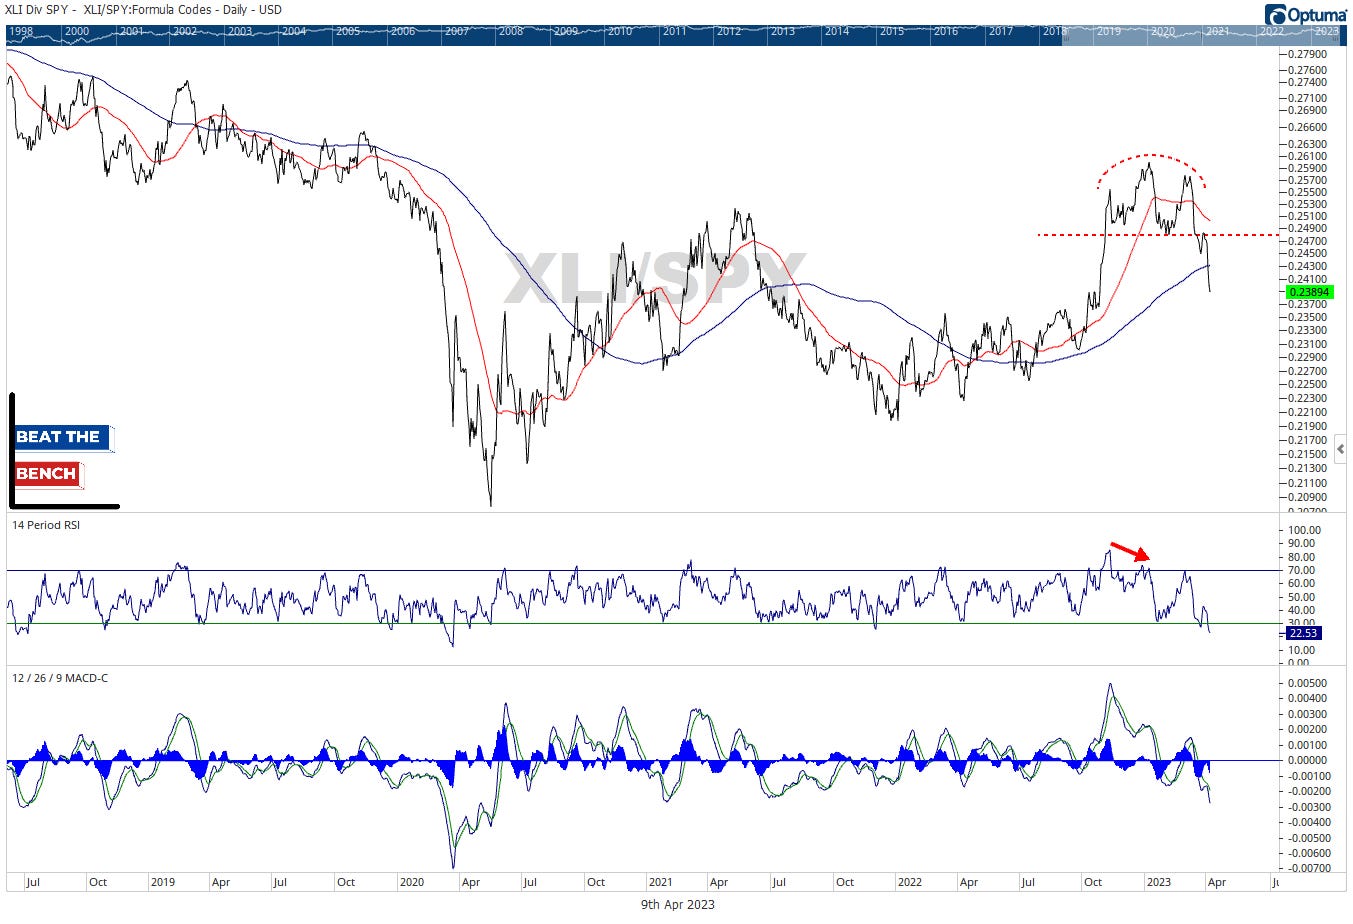
The biggest break in the industrials sector has been the relative performance over the past 4 months. Since January 6, the sector has underperformed the S&P 500 by 8%, pushing the XLI:SPY ratio below its 200-DMA and out of a clear uptrend. However, as the chart below shows, industrials have outperformed the S&P 500 on average following extreme oversold readings like we have right now.

