The Deep Dive
Defensives
Good morning,
In yesterday’s Monday Morning Playbook, I shared the below chart:
The ratio of the S&P 500 Low Volatility ETF to the broader S&P 500 has turned sharply lower in 2023, after breaking out to the upside late last year. This is one of my favorite risk-on/risk-off indicators because it takes a diversified look at what stocks are working in a given market environment. Trending up, and the most defensive stocks are outperforming, which tends to be bearish. Trending lower, and it can be confirmation of a bull market.
The false breakout and oversold reading are intermediate-term bearish signals for this ratio. So, does this mean the days of defensive and low vol leadership are over? Let’s do a deeper dive and find out!
Breaking down SPLV
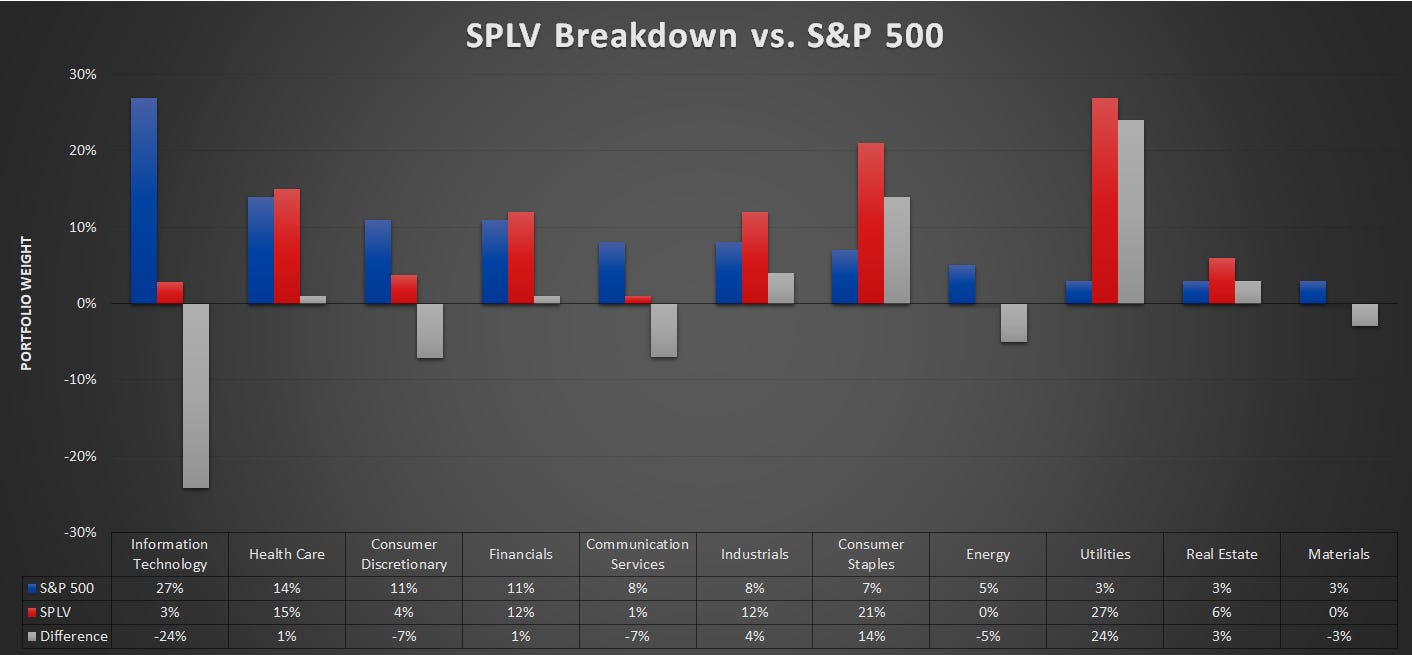
First, it might be helpful to show what SPLV looks like under the hood. The ETF selects the 100 S&P 500 stocks with the lowest daily volatility over the past year and then weights them according to volatility (least volatile at the top).
In the end, utilities comprise 27% of the fund, about 9x their weight in the S&P 500, while other defensive sectors such as consumer staples and healthcare account for an additional 36%.
Low vol gains have been relative, not absolute
One glance at the absolute chart of SPLV will tell you that despite outperforming the market last year, low-vol stocks haven’t been making anyone any money. Now, there have been more individual winners in defensive sectors for sure, but SPLV sits right near a flat 200-DMA and has been making higher lows going back to its record high in April 2022.
Defensive sector review
Utilities
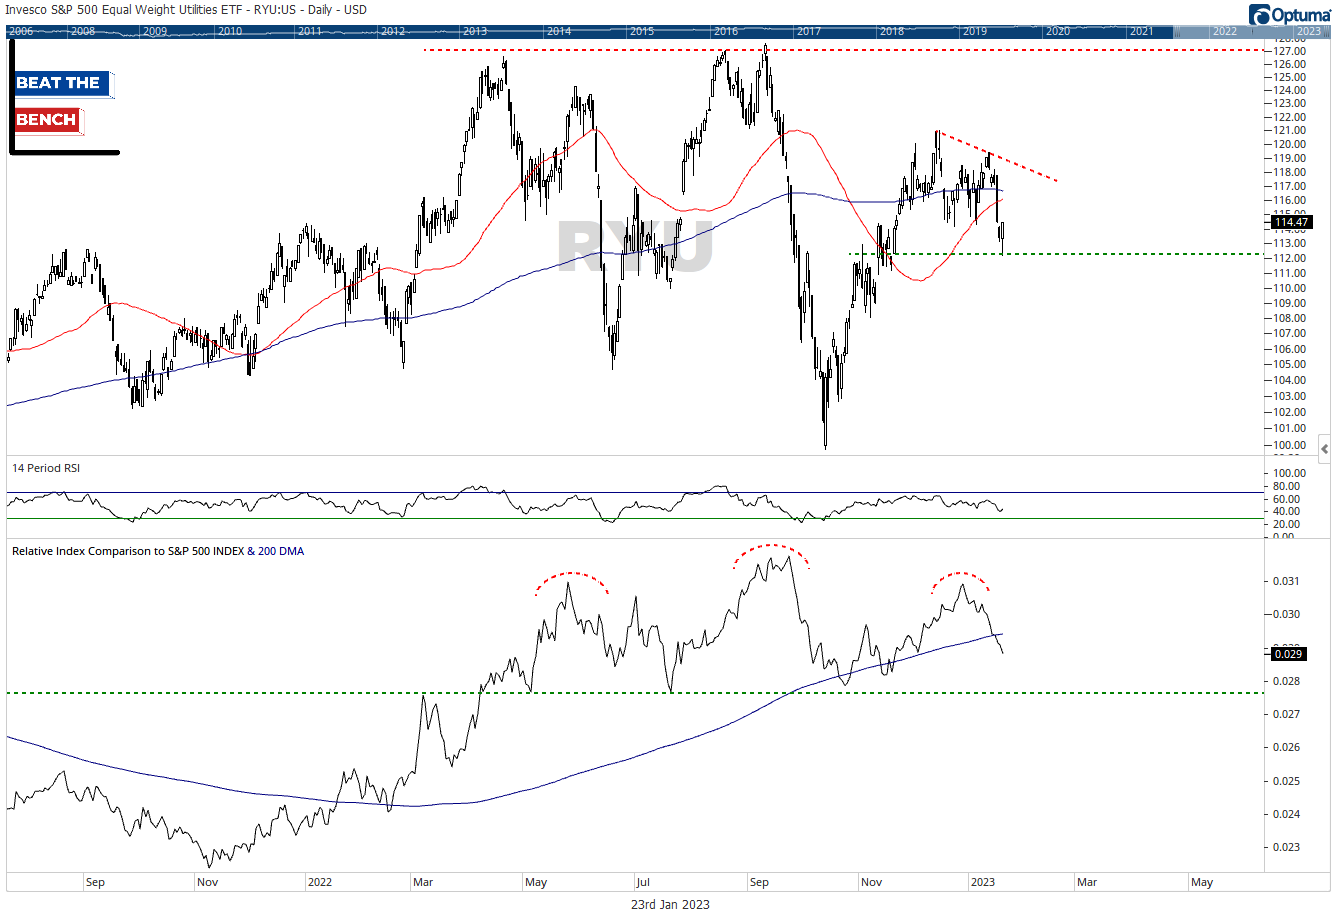
Since we’re most interested in the macro signal and defensive leadership as a whole, we’re going to look at the equally-weighted indexes for these sectors.
On that basis, RYU is trading just below a flat 200-DMA in absolute terms and is essentially unchanged in price since the beginning of last year. However, in relative terms, utilities have fallen below their 200-DMA and have a potential head and shoulders pattern playing out. Could the largest and most defensive sector be suggesting that SPLV is poised to weaken further vs. the broad market?
Consumer Staples
The relative chart of EW Staples looks most like SPLV, which could be bullish for equities overall. After breaking out higher in December, staples have underperformed enough to break the uptrend line that goes back to November 2021 and have broken their 200-DMA relative to the S&P 500.


