

The Deep Dive


Welcome to the very first edition of The Deep Dive. Paid subscribers will receive The Deep Dive each Tuesday morning and get in-depth insights on a specific area of the market. This week, we’re going under the surface of the tech sector to show you the technical landscape, which ETFs are outperforming, which aren’t and which stocks you can profit from. Let’s dive in!
Information Technology is the largest sector within the S&P 500, its 27% weight nearly double the second largest, healthcare. Not only that, but the two largest stocks in the S&P 500, Apple and Microsoft, both call the tech sector home. Those two stocks combined account for almost the exact same weight as the entire materials, real estate, energy, and utilities sectors, combined!
It is big, it is important, and unfortunately for investors it is also down big this year, with its -26.3% year to date return the second worst of all sectors, trailing only communication services.
Overall, as discussed and shown in yesterday’s edition of The Monday Morning Playbook, my view is the tech is a sector to continue to underweight relative to your benchmark. Let’s explore why.
XLK: iShares Technology Select Sector SPDR Fund (Absolute levels)

All eyes on $123 this week. This is key because not only does it represent the June lows/September 2020 correction highs but happens to be exactly the 50% retracement of the post-Covid bull run. A break of $123 targets $110 as next support. Resistance to the upside remains the 200-dma (currently at $147).
XLK: iShares Technology Select Sector SPDR Fund (Relative to S&P 500)
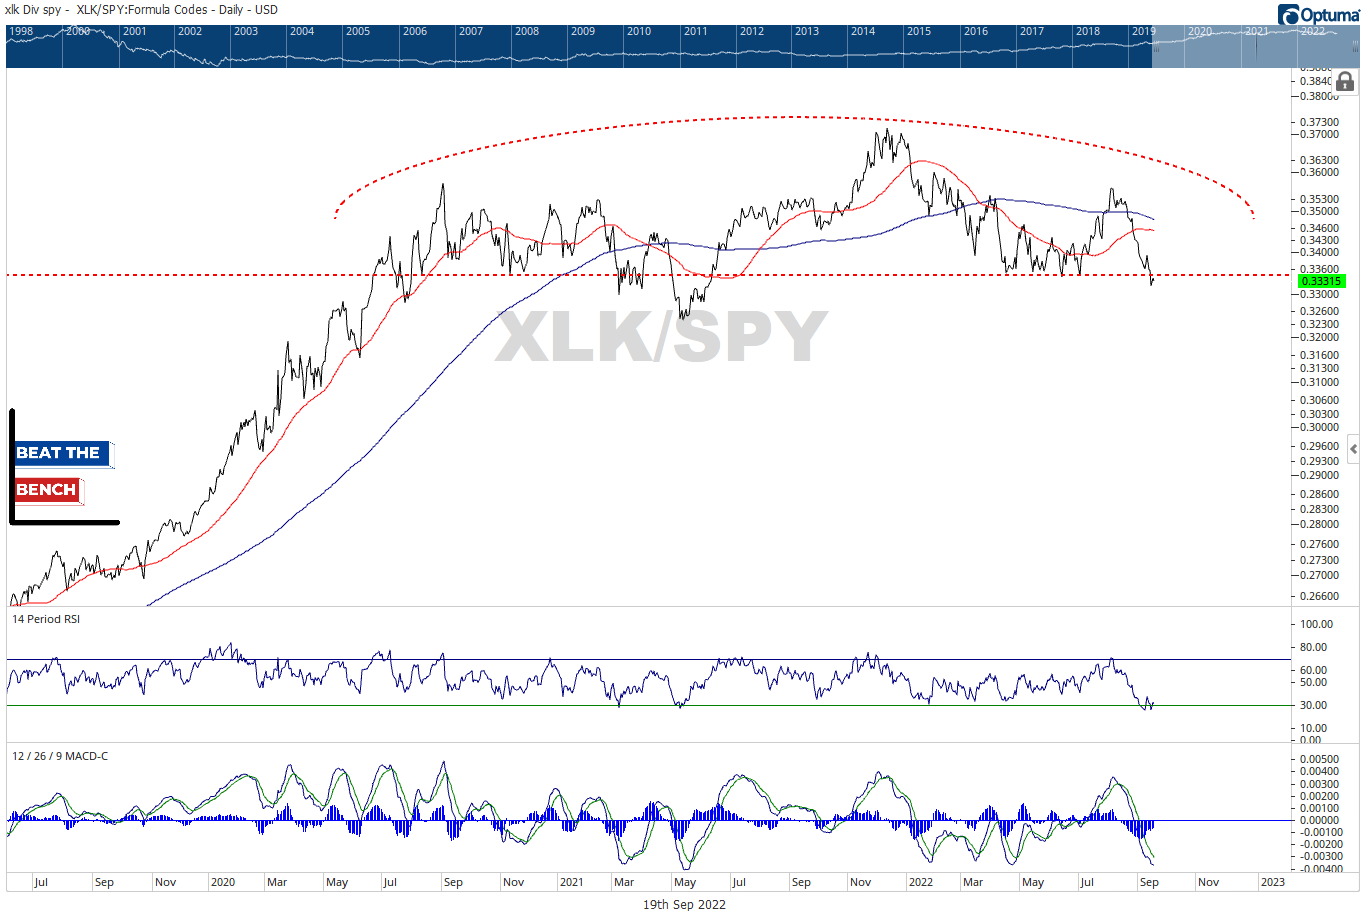
Tech closed at 52-week relative lows on Friday, completing what is arguably a two-year relative top. The big picture trend hasn’t been that poor, but Apple’s market cap and relative strength has masked broader weakness underneath the surface. Nevertheless, this relative breakdown is perhaps the clearest reason why I believe technology is an underweight.
Trends at the individual stock level remain poor

The above chart shows the percent of stocks in the tech sector up above their respective 200-day exponential moving averages. After getting down to washed out levels (below 10%) back in June, we rebounded strongly. However, different from what we saw in 2018-2019 and early 2020, the metric has turned back lower. Those prior instances quickly surged up to 90%, telling me that things are different this time, and tech is far from out of the woods.
New lows continue to outnumber new highs

In bull markets, new highs consistently outnumber new lows. In bear markets, we see the opposite. 14% more tech stocks made a new low than new high on Friday, and the graph shows this is a trend that has endured throughout 2022.
Bigger is no longer better (XLK vs. RYT)
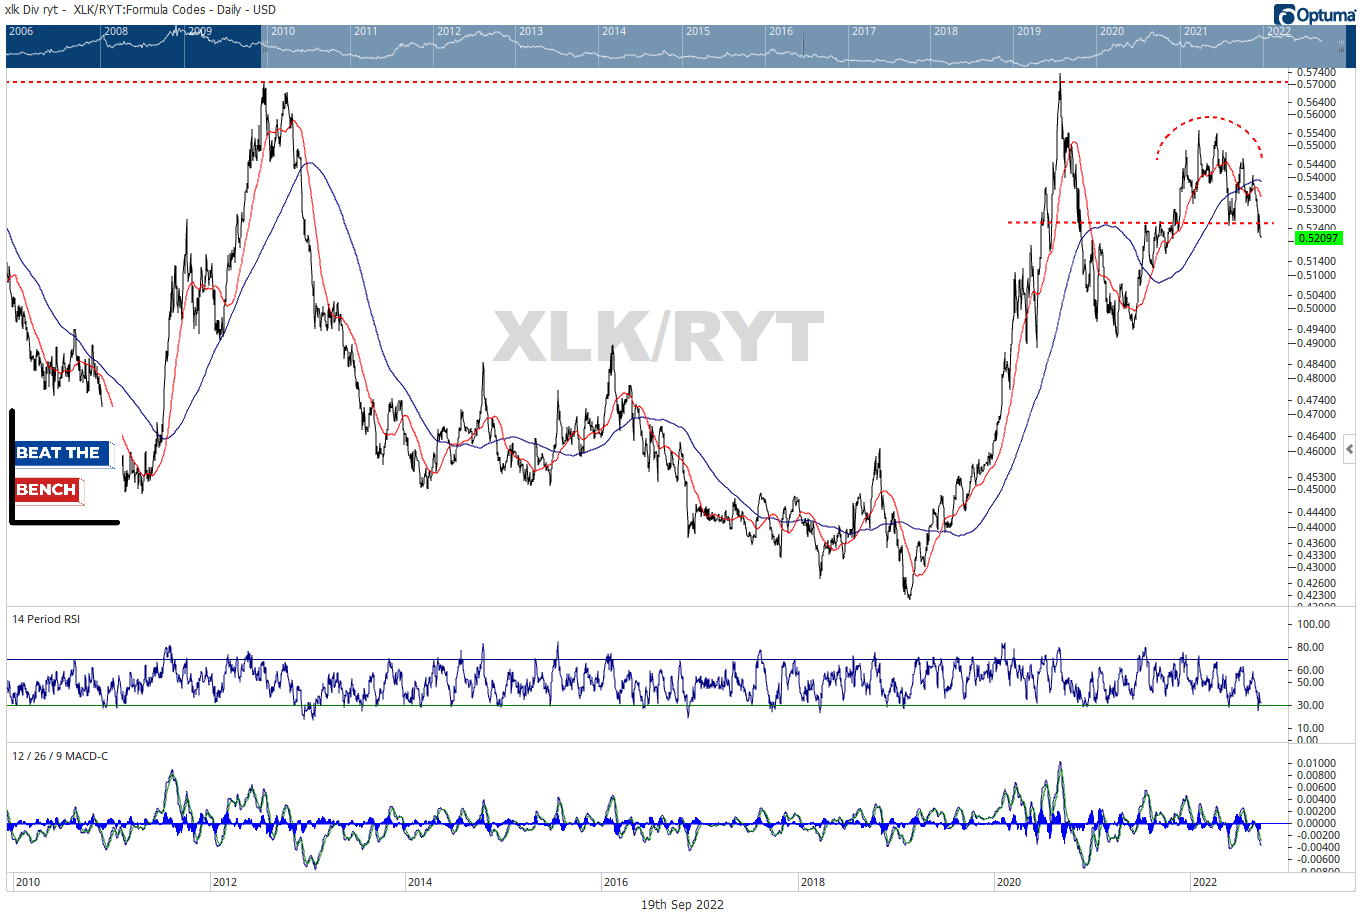
Okay this is an important one.
Above is cap-weighted technology (XLK) relative to the equally weighted version of the sector (RYT). Cap-weighted dominated in the first 8 months of 2020 as investors flocked to the free cash flow of the largest tech stocks. Then it lagged in the liquidity spree of August 2020 - March 2021. Finally, larger tech stocks outperformed for most of last year as the speculative growth stock party fizzled.
But an interesting thing is happening now. Bigger is no longer better. The ARKK/IPO stocks bottomed all the way back in May, and the very top stocks are lagging recently, sending this ratio to 11-month lows. This may seem strange but is totally normal. As I discussed in yesterday’s edition of The Monday Morning Playbook, most stocks bottom before the index. Part of the reason that happens is that the largest stocks tend to be the last to bottom, thus driving the index lower despite improving breadth metrics under the surface. “They shoot the generals last,” “they come for the pretty girls last,” “when they raid the bar, even the piano player goes to jail.” Pick your favorite one, but I believe that dynamic is what we are seeing play out right now. Don’t seek safety in the largest names.
Small-cap technology (PSCT) vs. large-cap tech (XLK)

On a similar note, the above ratio of small-cap tech vs. large cap tech shows a triangle one-year in the making that looks poised for a violent resolution. Putting all the pieces together from above, and I think the more likely break is higher, however there is no reason to guess. Let’s wait and see what the market tells us.
Small-cap tech (PSCT) absolute levels

Looking at PSCT (PowerShares Small-Cap Information Technology ETF) in absolute terms, there is no reason to own this outright. Rejected at the 200-day moving average similar to the market, next support is at $110. Maybe we can hold, but the trend is more important, and I believe it is prudent to wait for signs of a base and trend change.
SMH: VanEck Semiconductors ETF
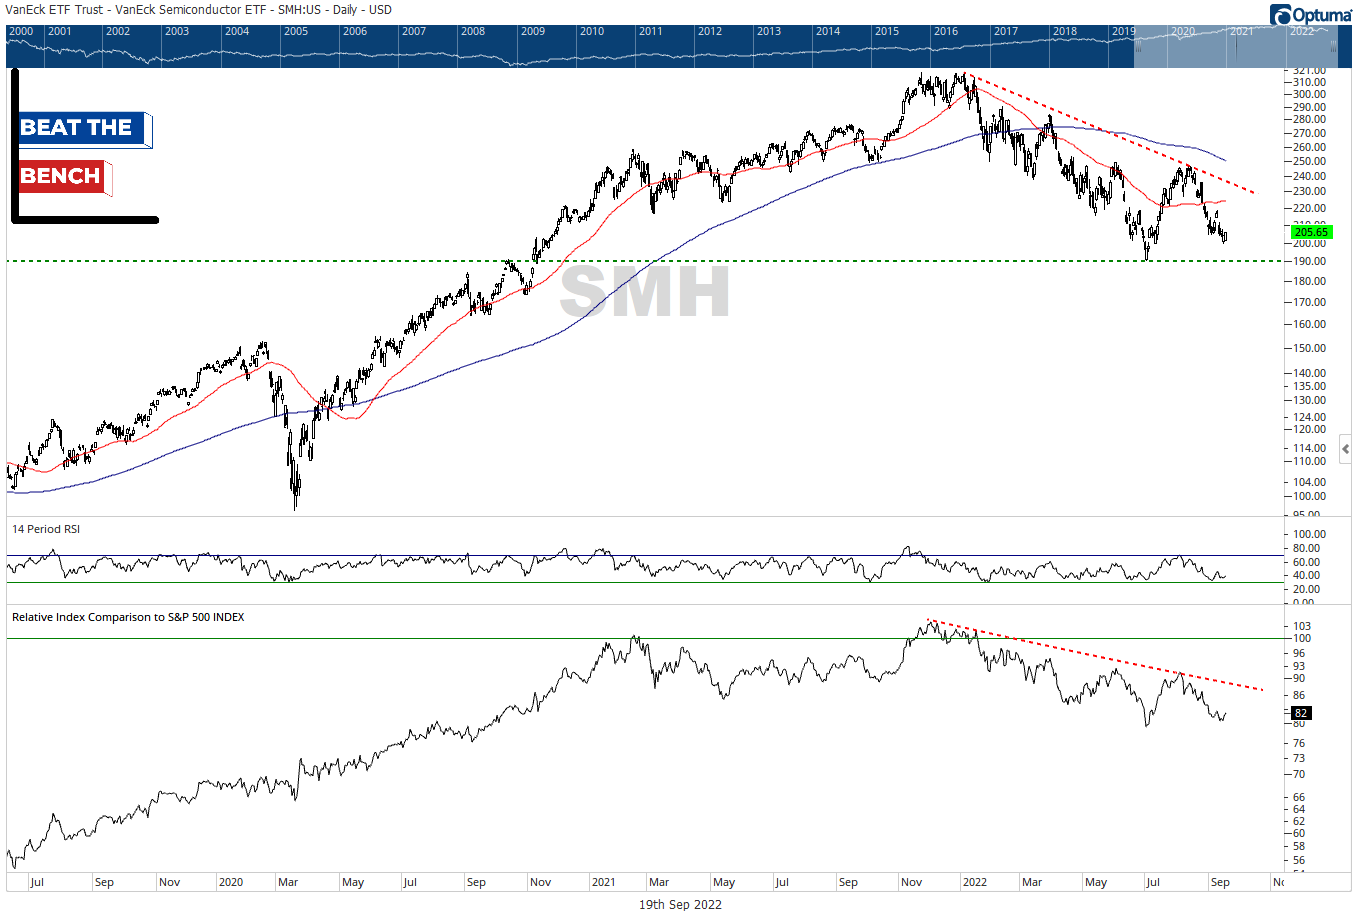
Semiconductors have underperformed throughout 2022 (bottom panel), and so far, there is no sign up that trend changing. Key support in absolute terms is at $190, while we need to see the red marked downtrend line and 200-day moving average get taken out to get interested on the long side.
IGV: iShares Expanded Tech-Software ETF
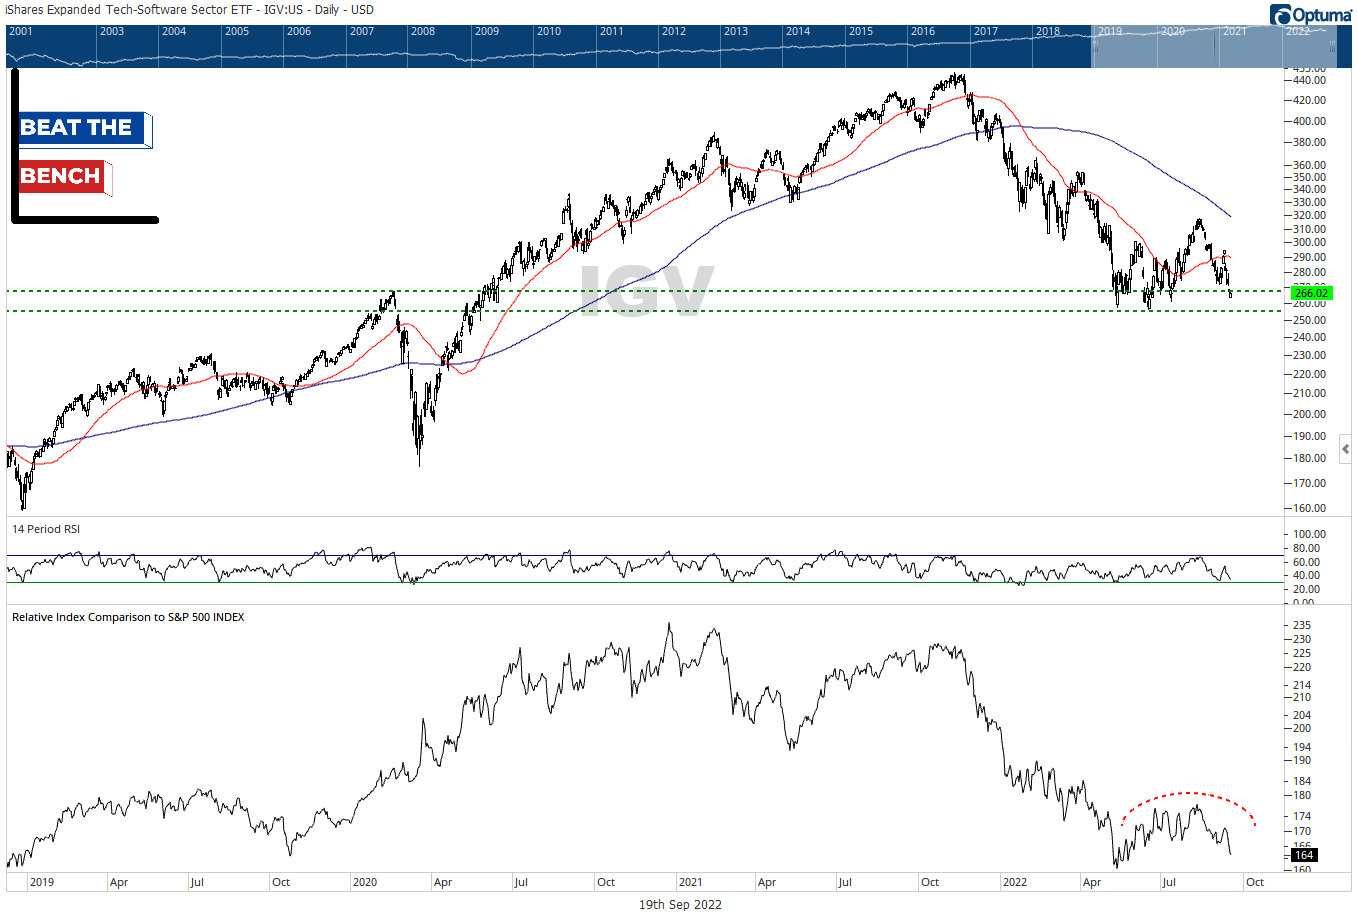
Software finds itself back near year-to-date lows and in a range of important support, but one look at the relative chart should tell you not to waste your time with it. This ETF has the unfortunate dynamic of holding many of the small speculative stocks that have been heading lower since February 2021, and some of the worst performing mega-caps recently, including MSFT, ADBE, and CRM.
The Top 3 Stocks
AAPL (24.9% of sector)

Take a big step back and accept that this chart has no trend. No trend is actually pretty great in the market (see the relative strength in the bottom panel), but it is hard to have much conviction in the next 10% move for the market’s most important stock. The Friday intraday lows at $148 represent an important near-term support point.
MSFT (21.5% of the sector)

Microsoft is trying to make a stand at its June lows (just above $240/share), but the relative strength chart (bottom panel) tells you that you really don’t need to be concerned with what it does short-term. Continue to avoid Microsoft.
NVDA (3.9% of the sector)
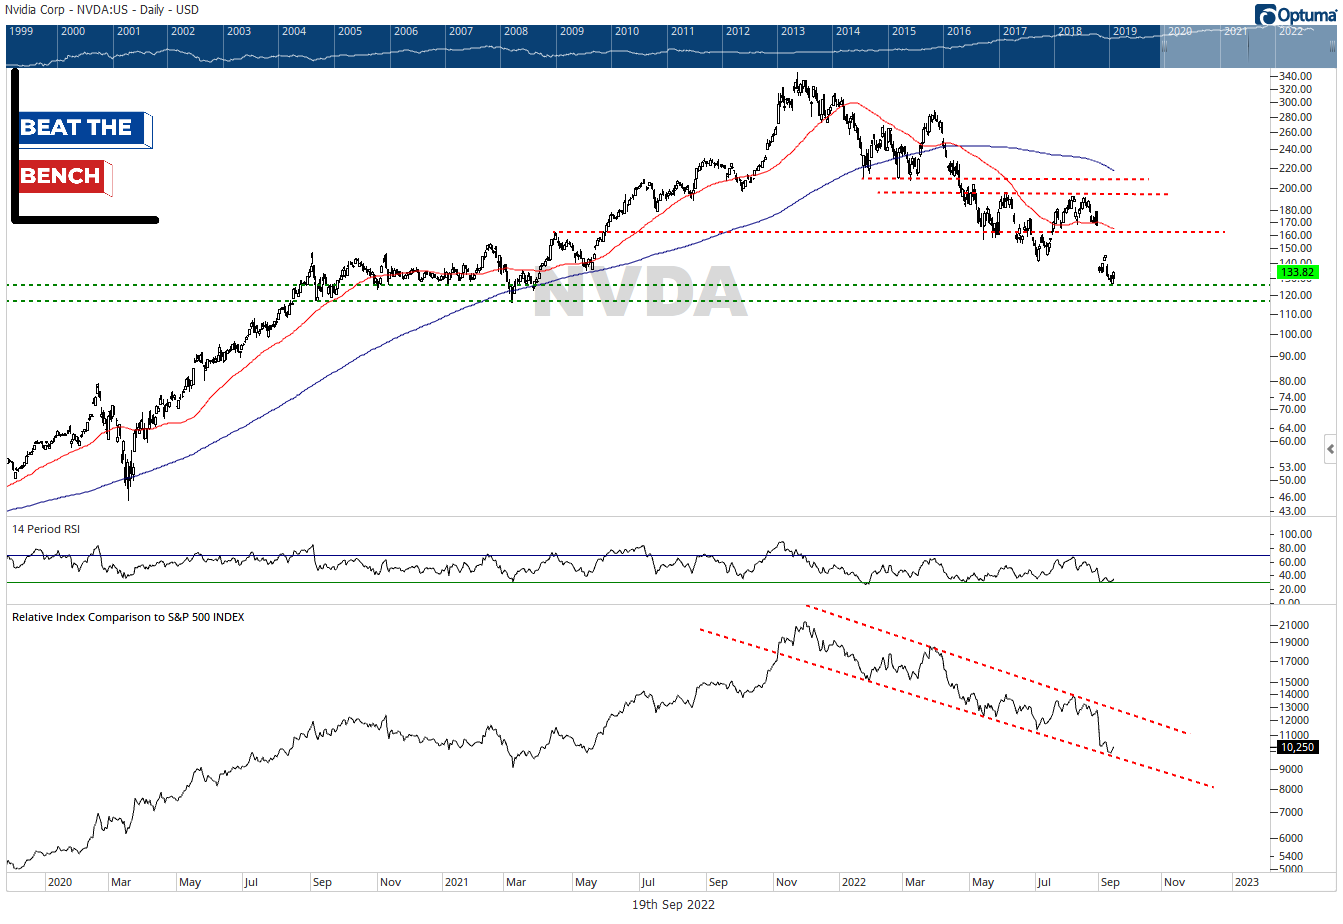
NVDA looks like it is at a spot where it could bounce in both absolute and relative terms, but don’t confuse that with me liking it on the long side. These are clear downtrends, within a weak group. Rallies up into the range near $160 would be opportunities to sell.
5 Long Ideas
Despite the overall weakness in the sector, there are still opportunities on the long-side, and there are always opportunities for relative strength. The following stocks within the tech sector look attractive.
ENPH. Enphase Energy engages in the design, development, manufacture and sale of micro inverter systems for the solar photovoltaic industry.
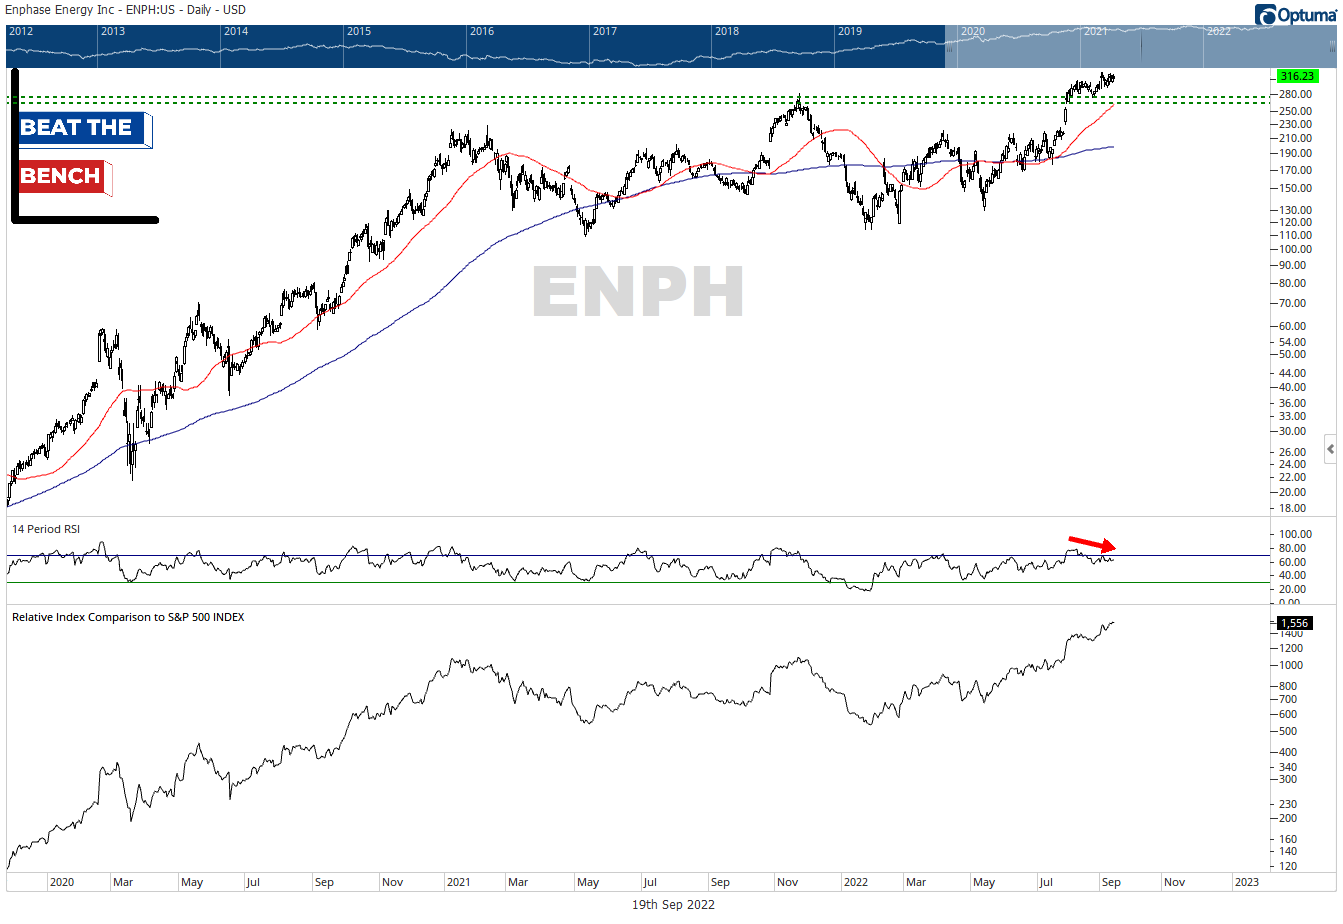
Not too many stocks in this market look like Enphase Energy. 52-week relative highs are one thing but sitting right near absolute highs really stands out. Slight bearish momentum divergence (middle panel) bears watching, but if ENPH is above the breakout point near $275, the only bet is higher.
SEDG. SolarEdge Technologies together with its subsidiaries, designs, develops, and sells direct current (DC) optimized inverter systems for solar photovoltaic (PV) installations worldwide.

SolarEdge Technologies reminds me of Amazon in 2020 (shown below). Continuing to steadily build a multiyear base, completely unaware of the giant bear market happening all around it and waiting to casually double when the market finally turns around. The target on an upside breakout above $376 is roughly $550.

BR. Broadridge Financial Solutions provides advanced technology and operations, communications, data and analytics solutions for the financial services industry and businesses.
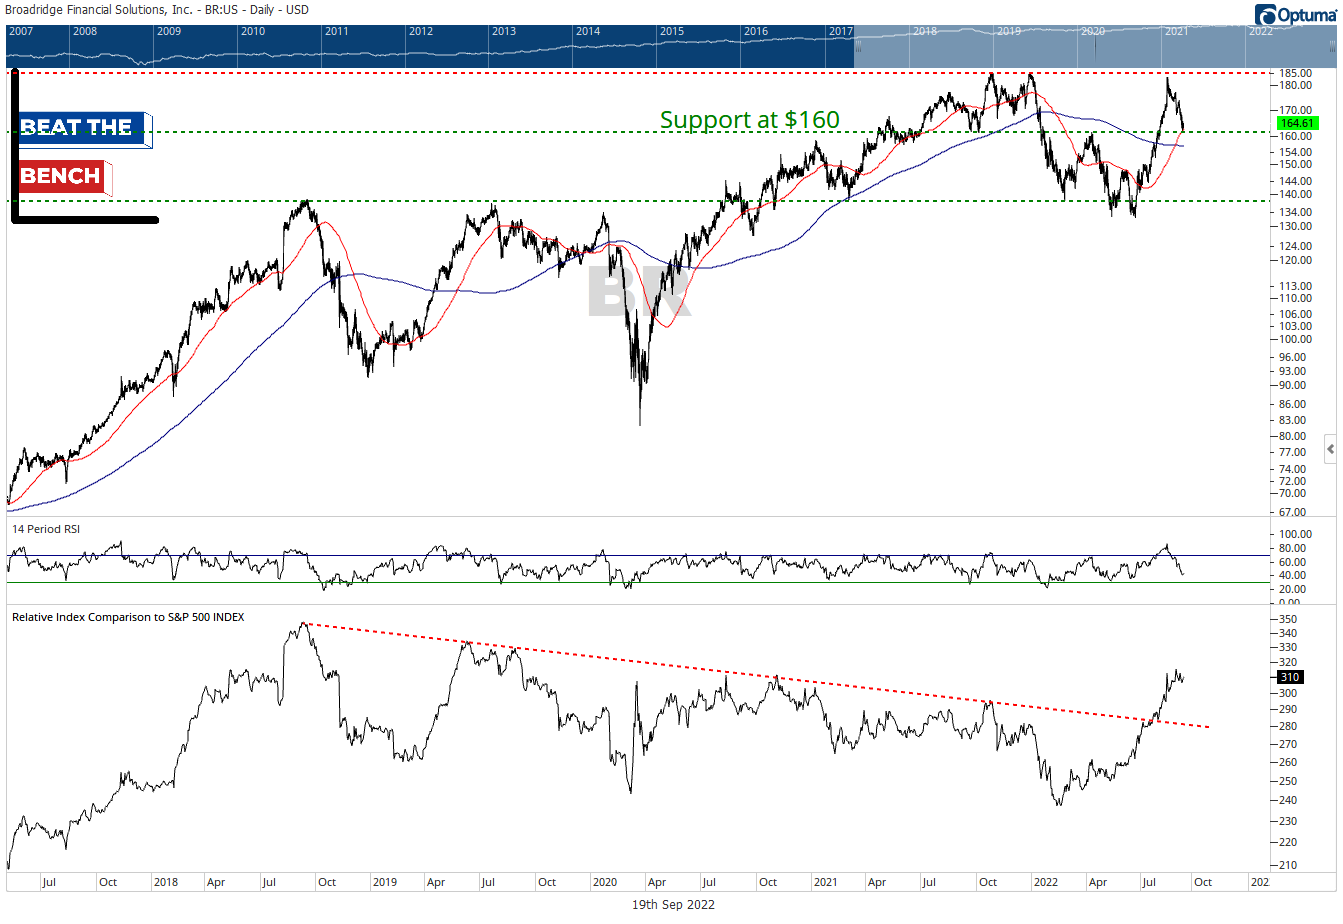
Broadridge Financial Solutions is a clear relative leader if you need to be allocated to the tech sector. The absolute chart is messy inside of a wide trading range, but today offers an attractive entry point using the $160 support level as a conservative stop loss. A breakout above $185 would target roughly $230.
CDW. CDW Corp engages in the provision of information technology solutions to small, medium and large business, government, education and healthcare customers.
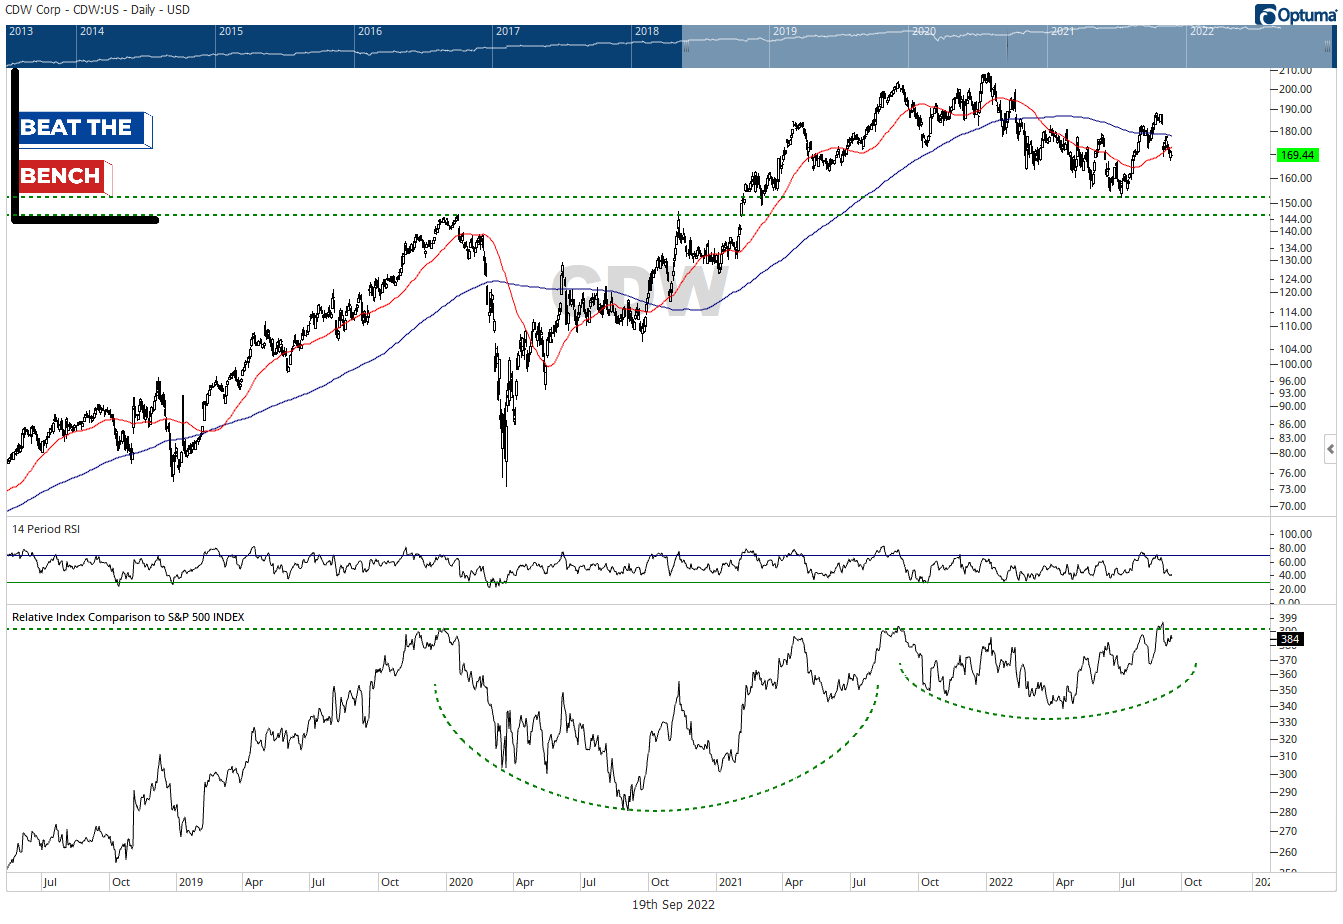
The relative strength chart of CDW looks like a giant cup and handle that wants to break out vs. the S&P 500. The absolute chart isn’t a star like some of the others, but we’re only about 9% away from the top-end of a giant support range. If CDW remains above that, the risk/reward favors the bulls.
ON. ON Semiconductor Corp is the second-largest power chipmaker in the world and the largest supplier of image sensors to the automotive market.

Not too many semiconductor stocks have hit 52-week relative highs in the past month, but ON Semiconductor has. Just broke out of a base in absolute terms as well, $64 looks like a good place to put a stop loss for new money.
3 Shorts/Stocks to Avoid
CRM. Salesforce provides customer relationship management technology that brings companies and customers together worldwide.

CRM is not only sitting at 52-week absolute and relative lows, but recently broke a decade-long uptrend line. Yikes.
WDC. Western Digital engages in the development, manufacture, market and sale of data storage devices and solutions.
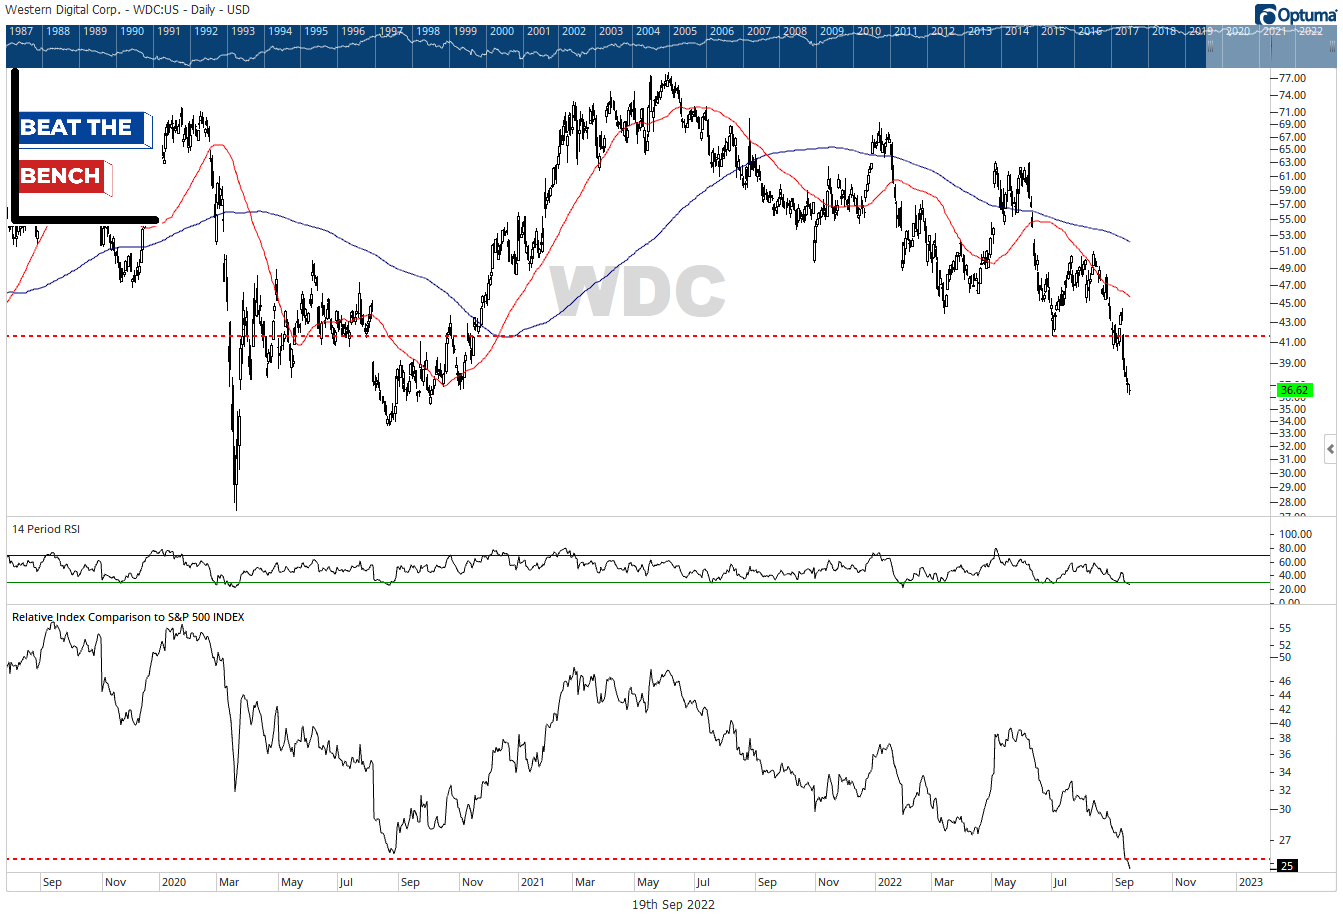
WDC is oversold enough that you probably would want to wait to short a rally (any move towards $40 would be an opportunity). But a stock hitting 52-week absolute and relative lows is not one we want to touch from the long side.
STX. Seagate Technology Holdings engages in the development, production, and distribution of data storage products and electronic data storage solutions.
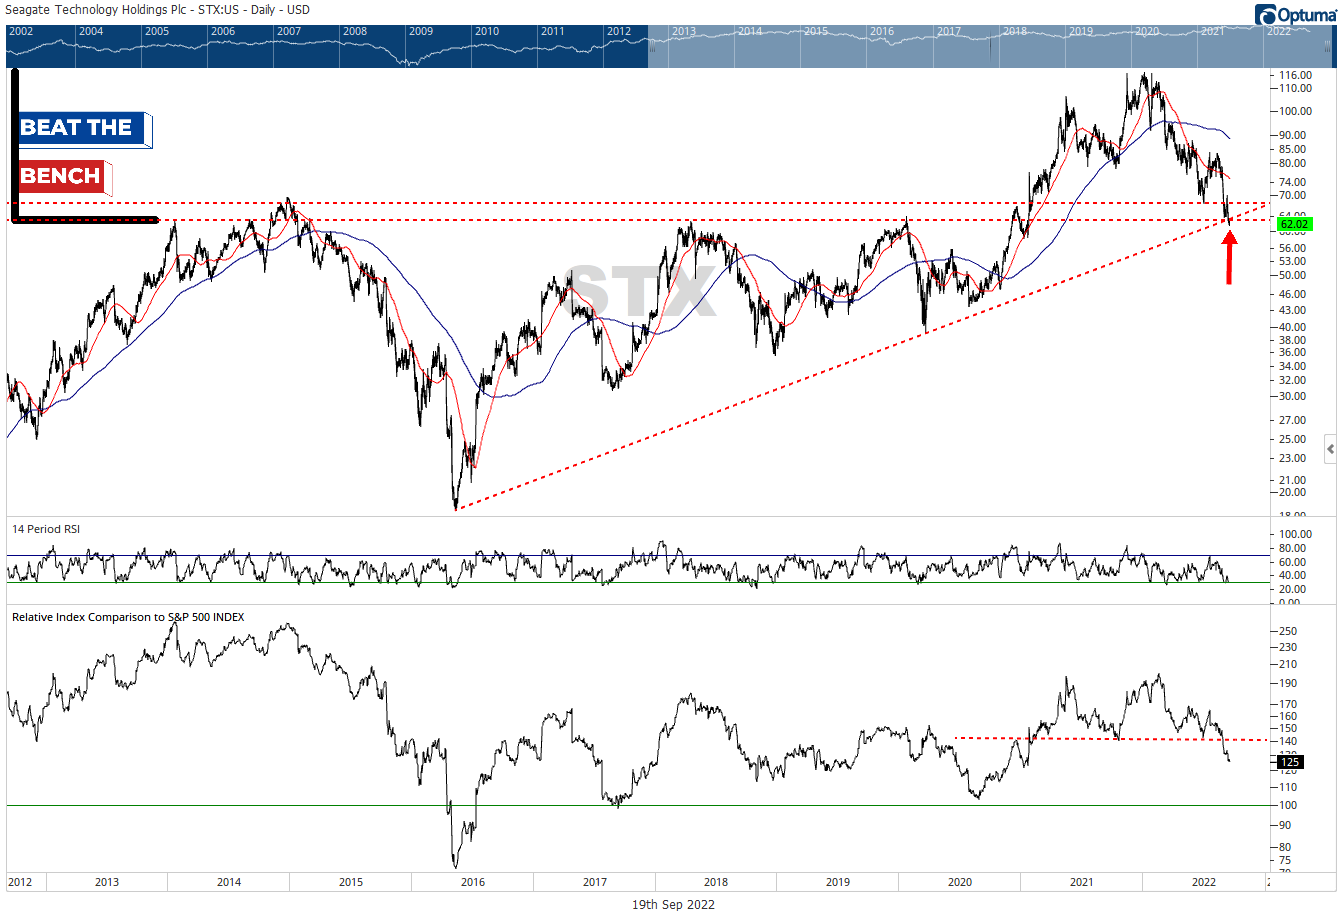
STX is in the process of losing support from a seven-year breakout and breaking an uptrend line that has been in place since 2016. And it is doing so while hitting 52-week relative lows vs. the broad market. If below $70, STX is a short.
That’s it for the first edition of The Deep Dive! Paid subscribers to Beat the Bench will receive The Deep Dive each Tuesday morning, in addition to The Monday Morning Playbook (with video) and my individual equity report. A paid subscription costs $79/month, or $799 for the full year, and there is a 20% discount for groups of four or more.
Be on the lookout for my individual equity report, Stocks: The Good, The Bad, and The Ugly, with stock ideas from all 11 S&P sectors. It comes out Thursday morning and is free this week only!
Thanks for reading,
Scott
Scott Brown, CMT
Founder and Chief Investment Strategist, Beat The Bench LLC