The Monday Morning Playbook: Week of September 19
June checked a lot of boxes for a major low, but the bear market isn't through with investors yet.
Good morning, everyone! Thanks so much for following along and your interest in Beat the Bench. Each week, The Monday Morning Playbook comes with a link to a YouTube video where I break down the playbook, and preview some of the key macro and economic events awaiting us. You can watch at the link below.
Week Ahead: The Federal Reserve will deliver a 75 basis point hike on Wednesday (putting Fed funds at 3-3.25%), and investors will parse Jerome Powell’s words for just how far the rate may go this cycle. Currently, the market sees the terminal rate at around 4.45%, nearly two additional hikes from what was priced in pre-August CPI.
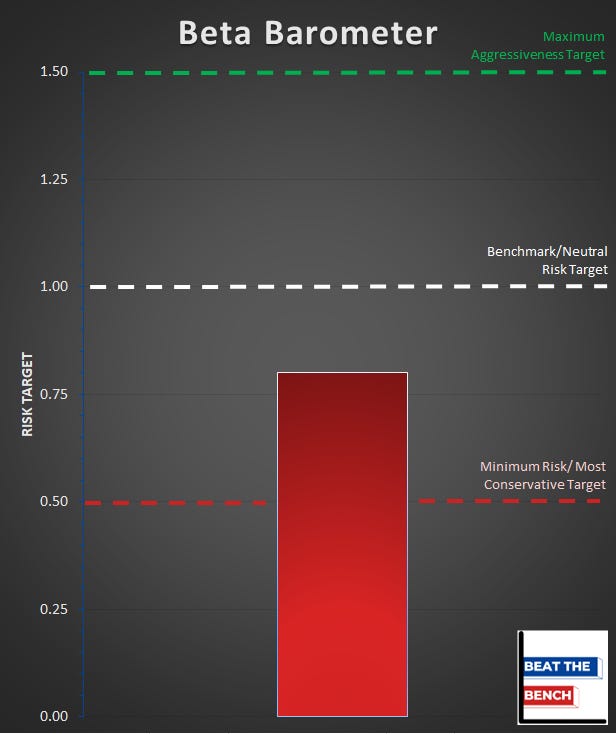
The Beta Barometer: There are four regular graphics that I will share with you every Monday, in addition to the technical charts and supporting evidence. The very first is The Beta Barometer.
Very simply, it is my gauge of the overall risk-taking landscape, and how I believe all-weather, tactical portfolios should be positioned relative to their benchmark. Mine goes from 0.5 to 1.5, with 1 representing a baseline asset allocation with no major structural bias in any direction.
Is it Q4 of 2020, where trends are strong, breadth is stronger, consumer discretionary is outperforming consumer staples, seasonality is at our back and everyone you talk to is overwhelmingly bearish? Well, that nearly textbook bullish environment should see the Beta Barometer pushing towards 1.5. Is it May, and we just broke support at 4200 and are stuck below a 200-day moving average that is starting to turn down on us? The Beta Barometer is going to be at something less than 1.
And that’s where we stand today. While far from the max bearishness position, our first Monday Morning Playbook sees the Beta Barometer at 0.8, a modestly more cautious than baseline stance.
Asset Allocation: If you are new to following my work, you will quickly learn that everything for me is a trade. It is key to the investment philosophy of Beat the Bench, because how I have successfully outperformed benchmarks in my career is by thinking of any investment portfolio as a long/short strategy relative to the benchmark I was attempting to beat. By starting in that “neutral” position, you can then start making pair trades, when and only when attractive risk/reward presents itself. I want to be overweight uptrends, underweight downtrends, and near benchmark levels on assets or sectors without a clear trend.
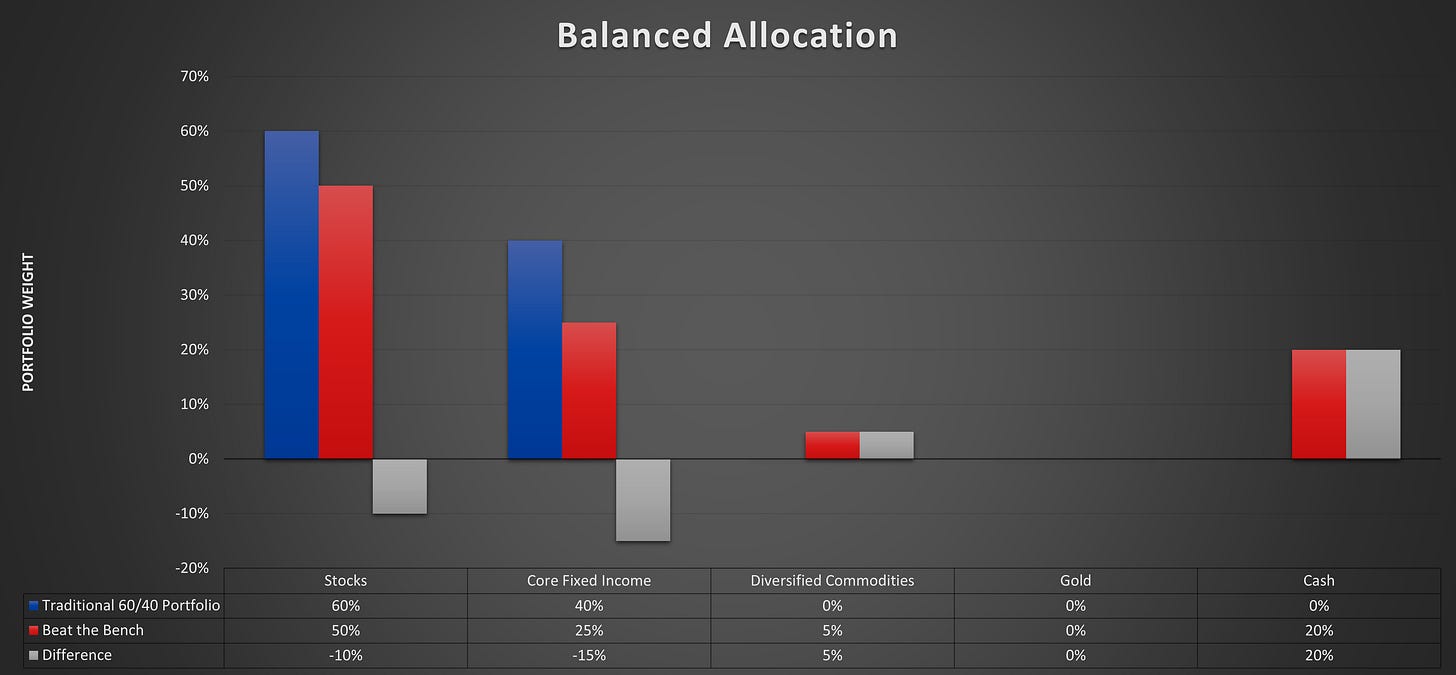
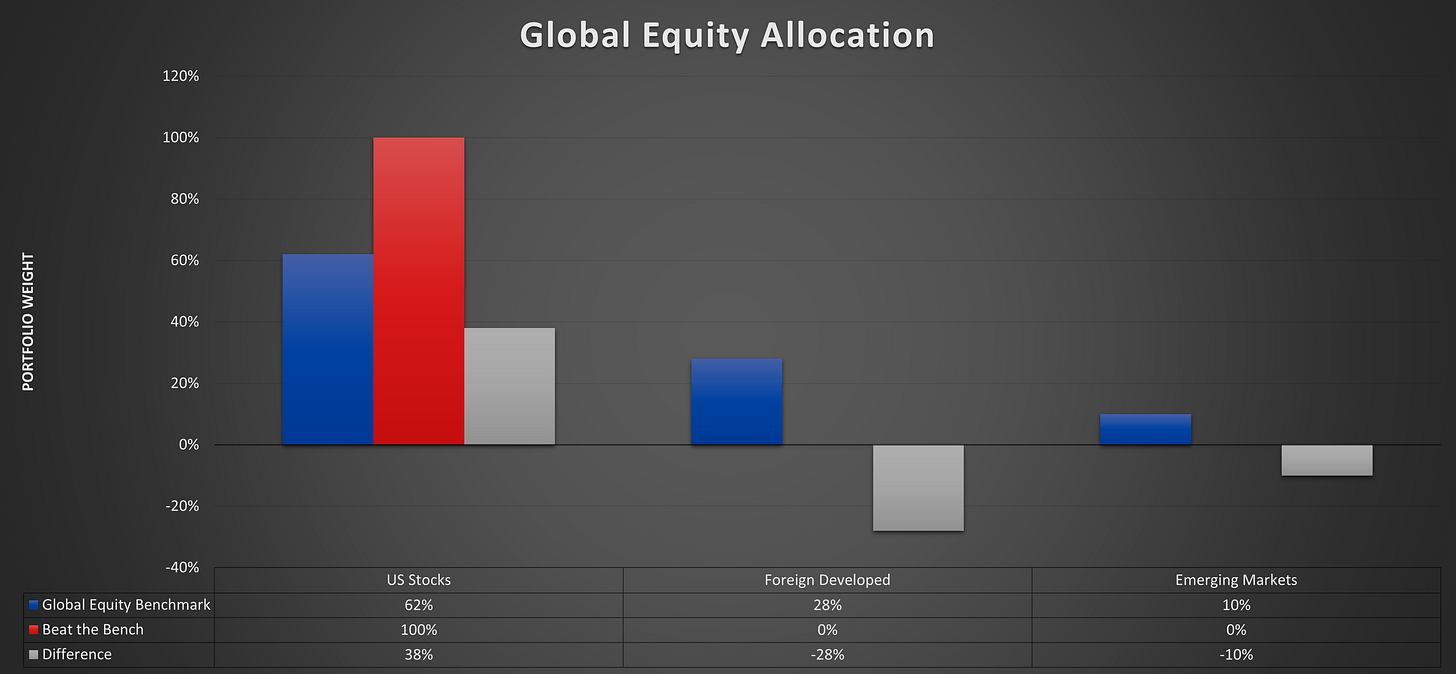
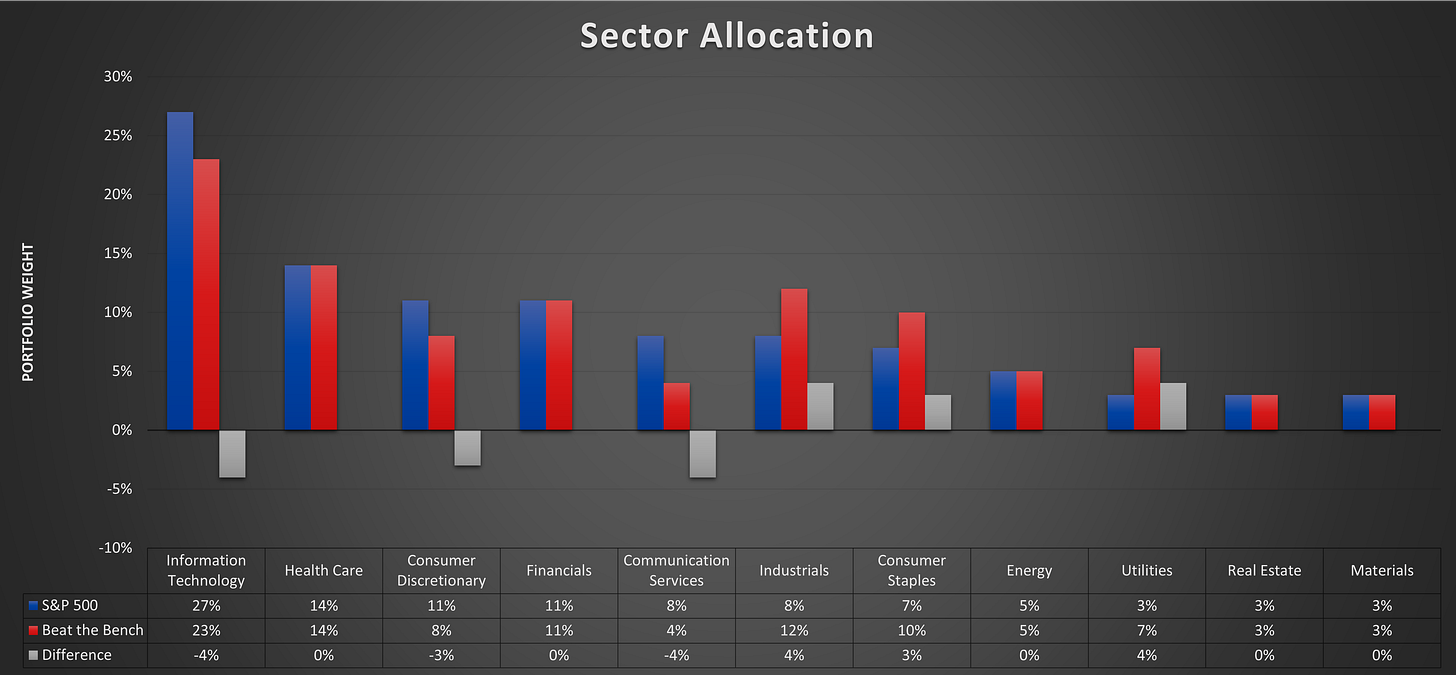
Luckily for me on this first edition of the Monday Morning Playbook, the “everything in neutral” environment absolutely isn’t the one we are in right now. The following allocations show what asset classes, regions, and sectors I believe represent the best opportunities to add alpha in client portfolios.
The Beat the Bench balanced portfolio is currently positioned with an underweight to both stocks and core fixed income in favor of cash. There is a modest out of benchmark bet to diversified commodities, which continue to show relative strength vs. stocks and bonds.
On a regional level, our allocation is 100% in US equities. Despite absolute weakness in the US, later charts will make it clear that EM and EAFE are in even worse shape.
Lastly, on the sector model, which is always fully invested, I am most negative on growth sectors and positive on defensives, specifically utilities and consumer staples. Though not as strong as the true defensives, within industrials I see pockets of strength and an attractive pair trade with the flaming pile of money that is the communication services sector.
The Supporting Evidence
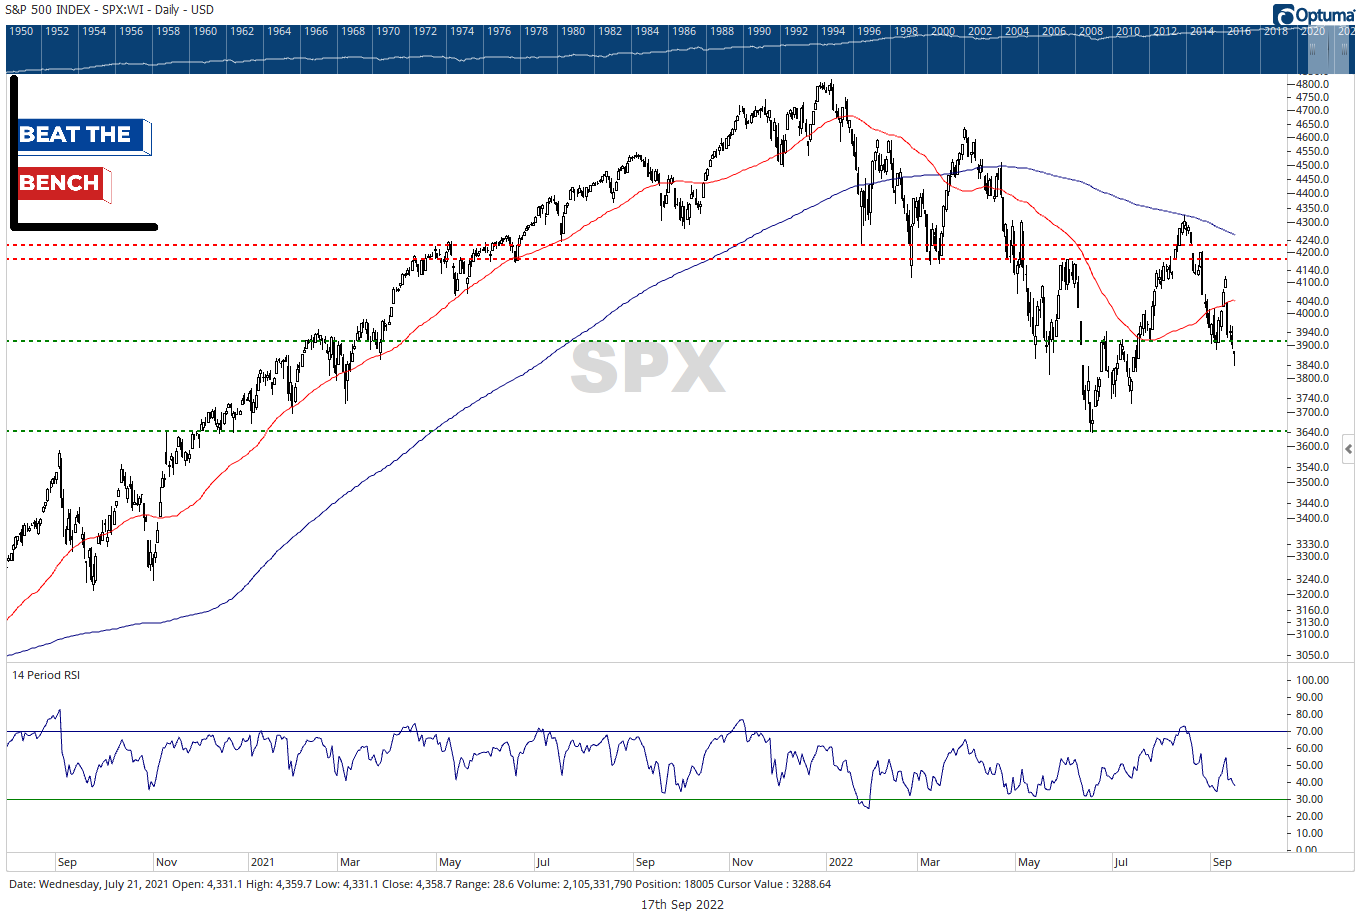
Retest time.
The S&P 500 printed a nice hammer on Friday, closing roughly 1% higher from its intraday lows. Nevertheless, this still looks like a break of the only real support separating current levels from the June lows and the trend below a downward sloping 200-day moving average remains firmly lower.
My stance since the days following June 16 have been that those lows (3636 intraday) are likely in the “ballpark” of the ultimate low, with the real question at the time being would we have a V-shaped recovery or need some sort of a retest. Friday’s move seems to have ended the V-shaped recovery scenario, so the question is what a retest looks like.
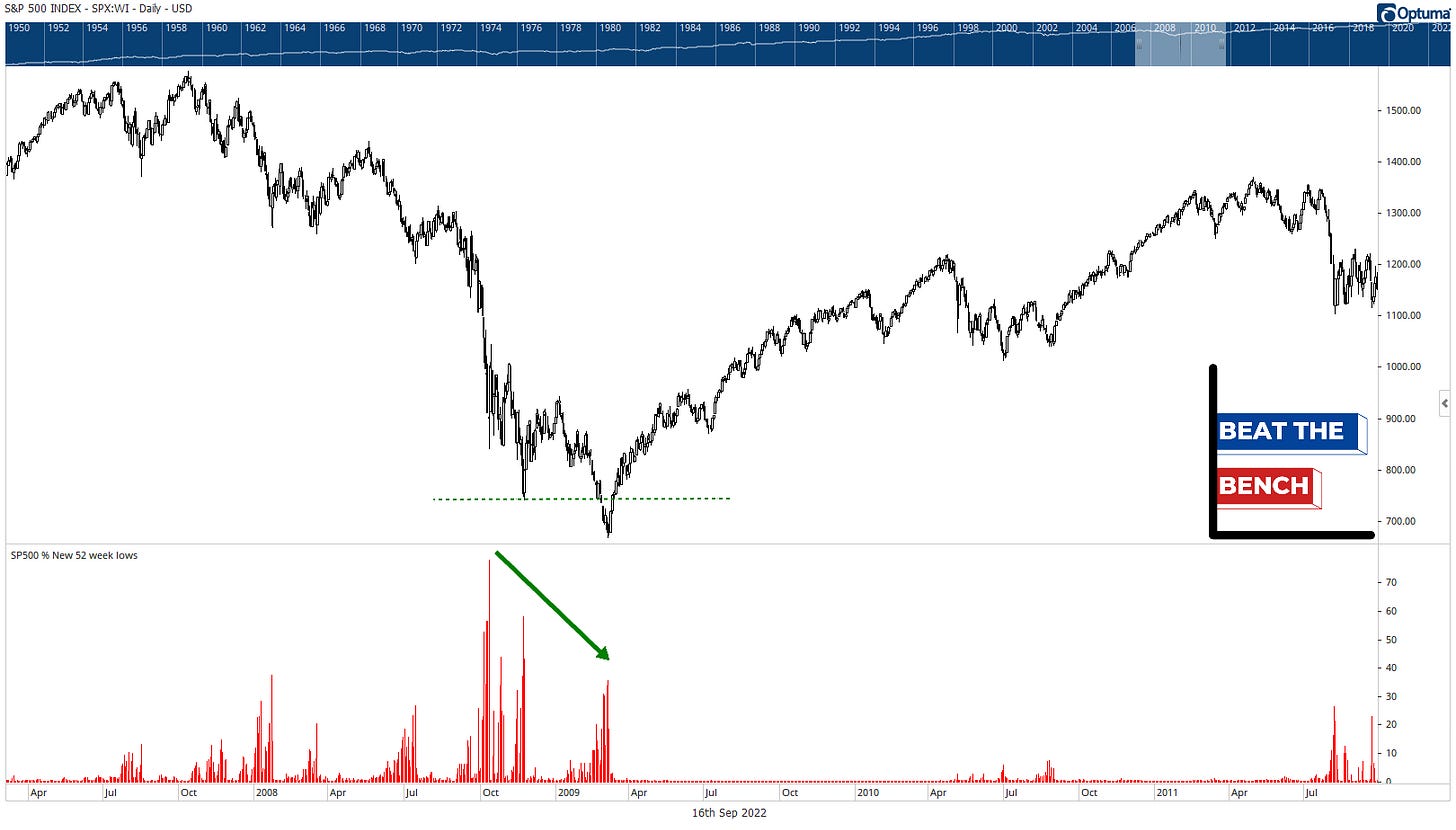
Retests often undercut the lows.
It is important to recognize that many “retests” actually undercut the lows (thus “in the ballpark” of the low is the call), but that initial low is what many times sees the most extreme internal readings. The above chart shows the S&P 500 in 2008-2009. Most stocks made their bottom in the fall of 2008, and even though price didn’t bottom until March, the improved internals combined with the capitulation caused by a new low made for a potent combination.
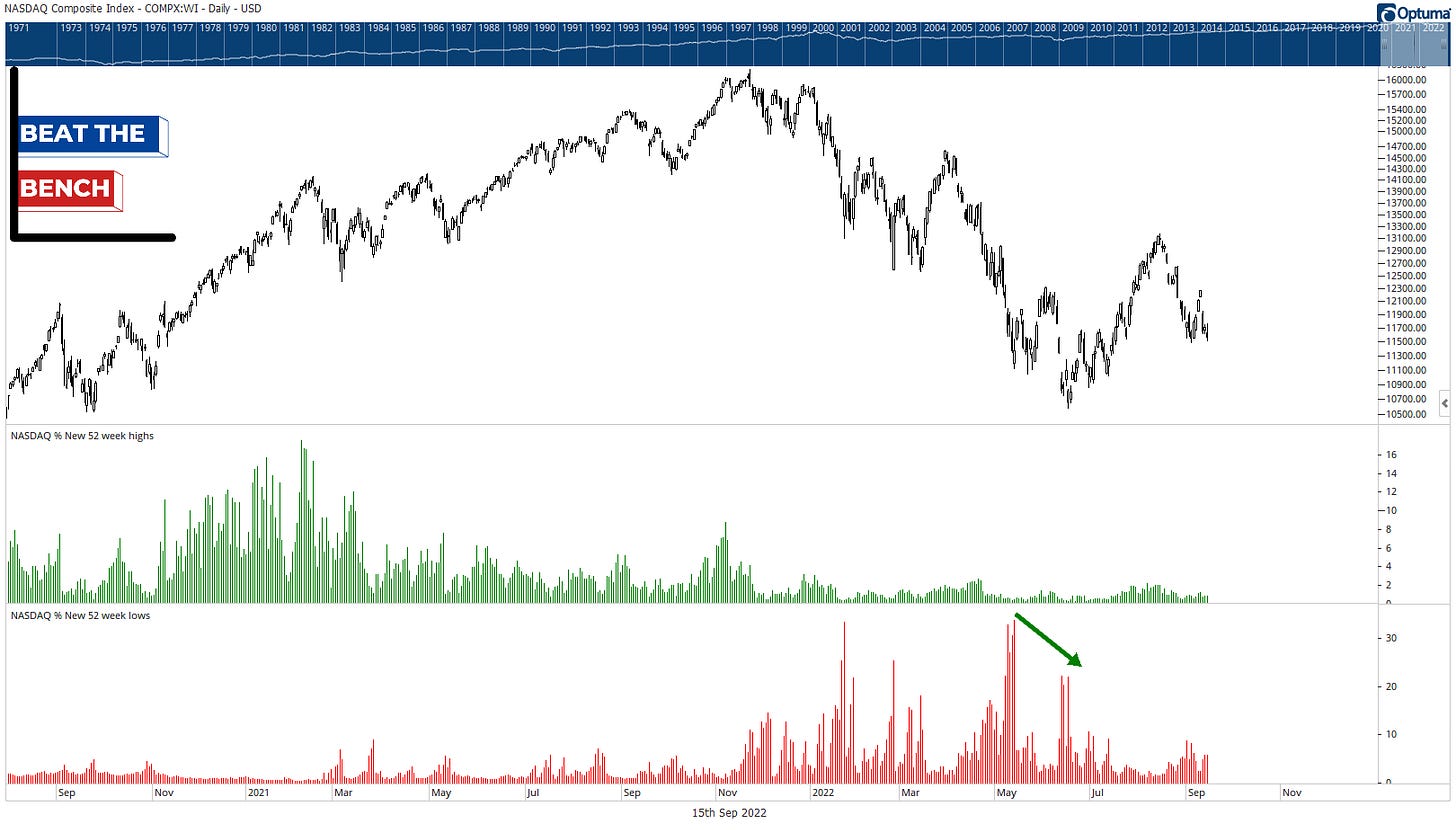
Nasdaq 52-week lows peaked in May.
Why is the chart of the S&P 500 in the GFC relevant? Because we have a similar setup in the Nasdaq, where the very worst selling of the cycle has been underway since February 2021. Above, you can see that new lows for the Nasdaq peaked back in May, setting us up for the rally off the June lows.
As long as that highwater mark of 33% remains intact and we don’t see the red histogram starting to creep higher over the coming weeks and months, I tend to believe that the closer price gets to those lows, the more likely it will be an opportunity to add risk rather than reduce (and you may see the Beta Barometer creep closer to 1).
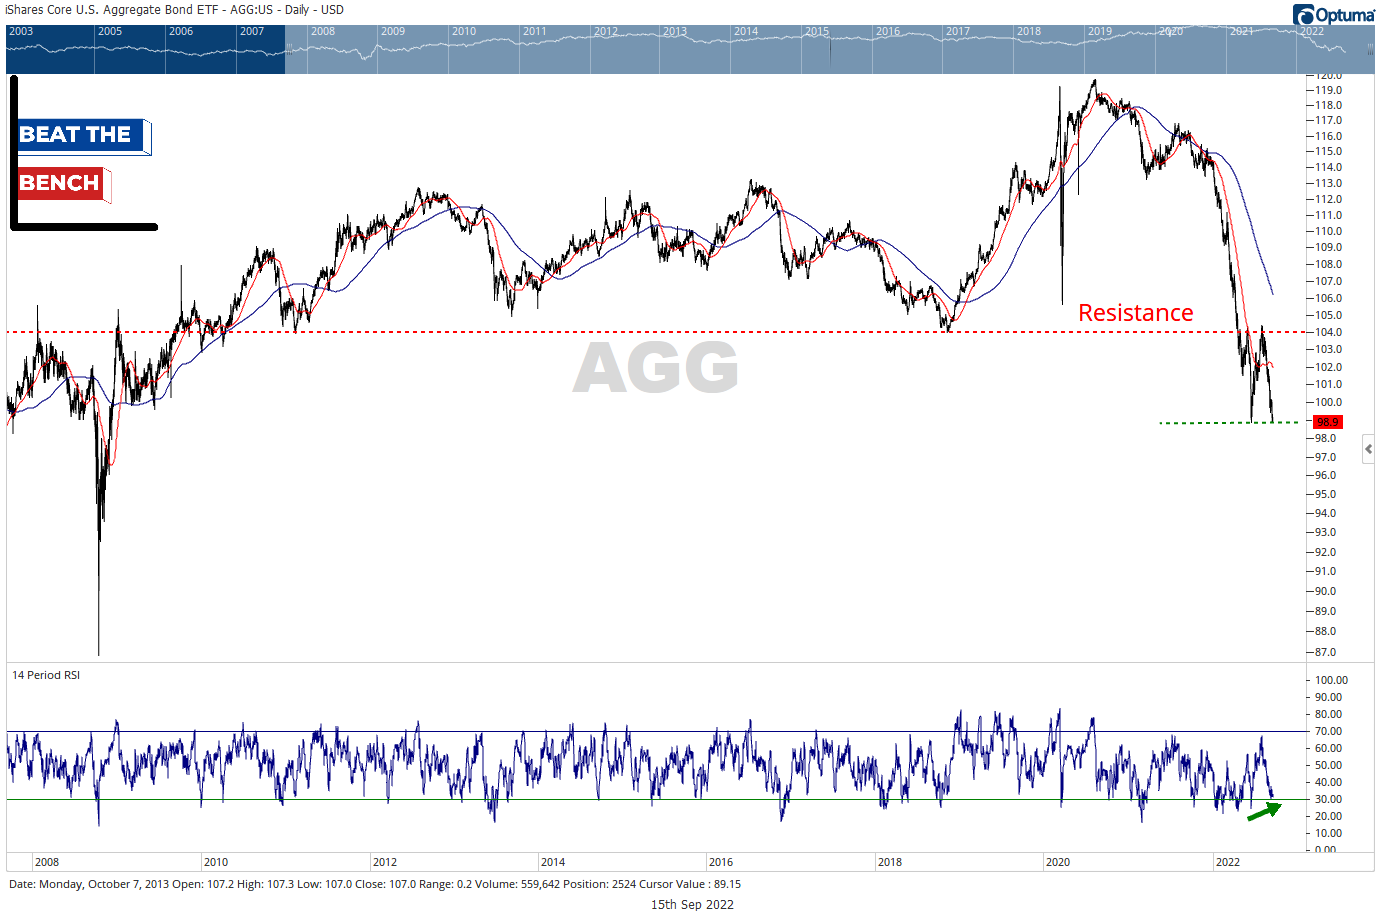
Bonds just stink.
You may have seen this chart in my trial posts, but I think it speaks volumes. AGG (iShares US Aggregate Bond Index) broke decade-long support at $104, had a textbook pullback to that breakdown point and was soundly rejected and now sits back on 52-week lows. There are some minor bullish divergences to watch, but if this is below $104, we have to believe this is a just a pause within a downtrend and core bond funds should be avoided.
Call your fixed income desk.
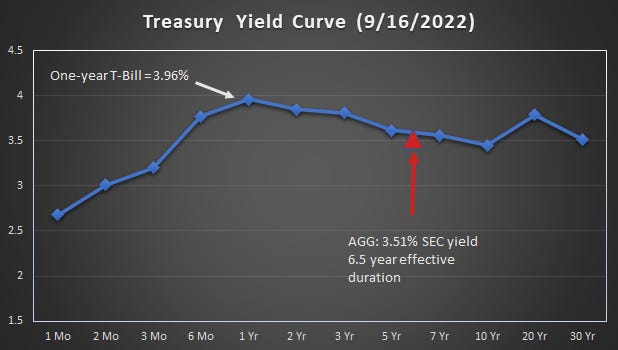
The balanced asset allocation underweight is to what I call core fixed income, meaning intermediate-term funds benchmarked to the Agg. However, you can easily do better than the 0% that your broker is likely paying you on your money market fund or deposit account, by simply dialing up your fixed income desk and buying some T-bills. On Thursday, the 1-year Treasury yield briefly crossed 4%, while the 3-month tenor will pay you 3%. Compare that with AGG which pays just 3.5%, has MBS and corporate credit spread risk, and has an effective duration risk of 6.5% when yields are still trending higher. I recommend getting to know those friendly faces on your fixed income desk, even if you aren’t used to dealing with individual bonds.
Foreign stocks are just awful.
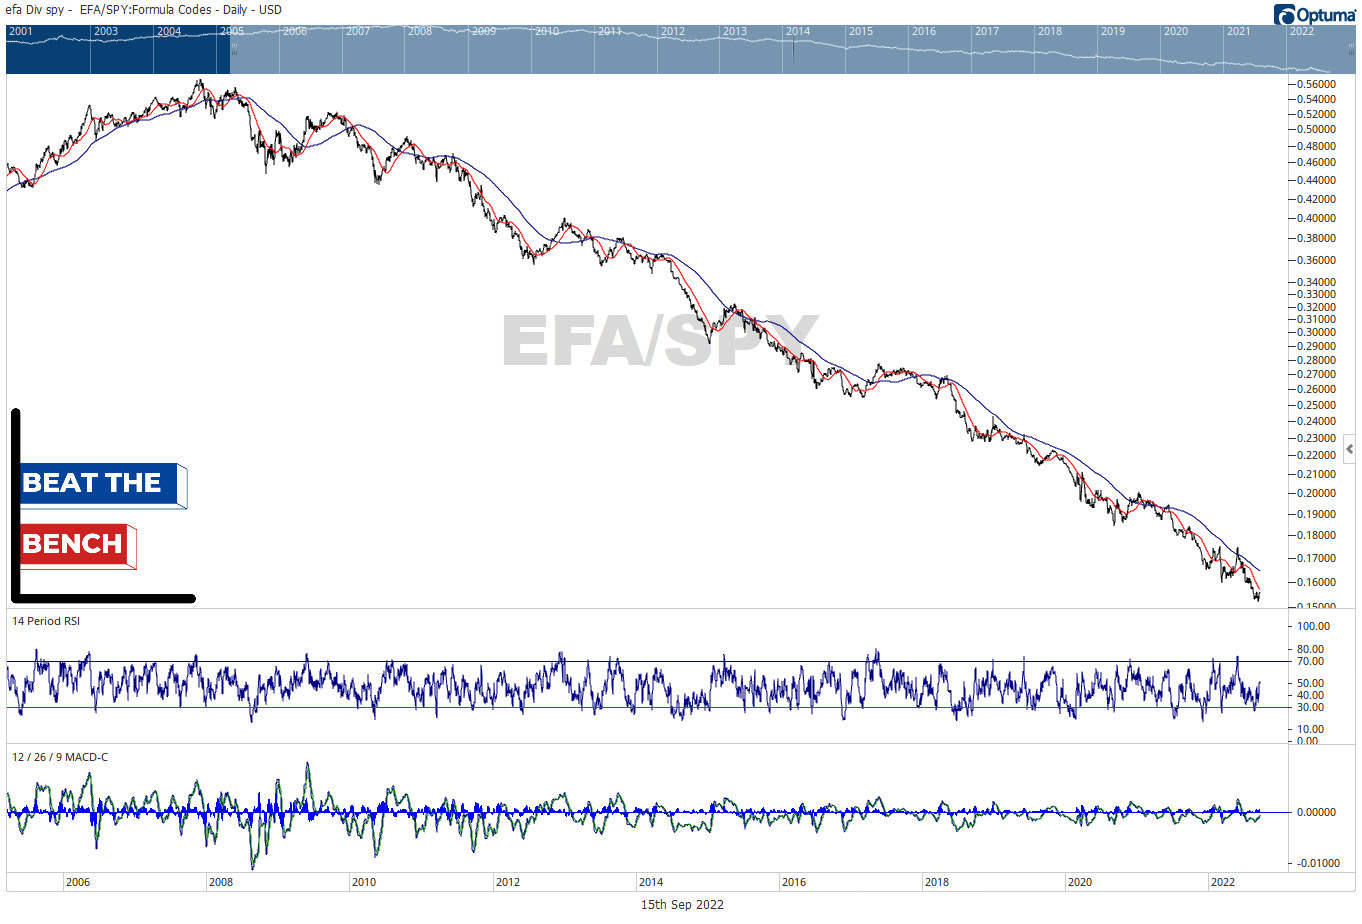
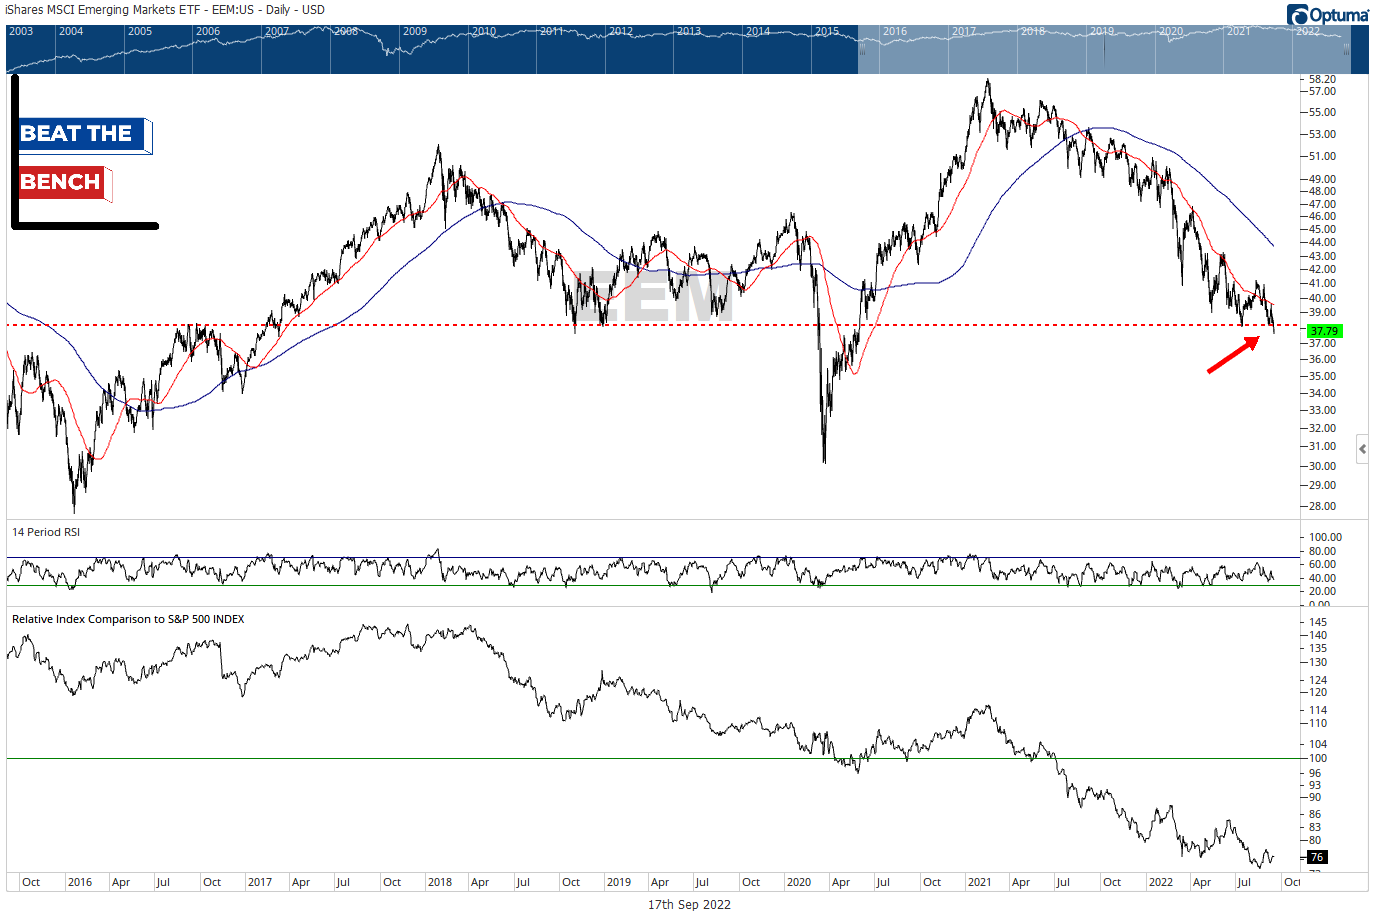
I believe in technical analysis using multiple time frames, but the above chart can make it seem superfluous. The 1-month chart is the same as the 1-year chart, which is the same as the 10-year chart: Straight down and to the right. Continue to underweight foreign developed stocks to that maximum that you are comfortable with. Oh, and emerging markets? They closed at 52-week lows on Friday.
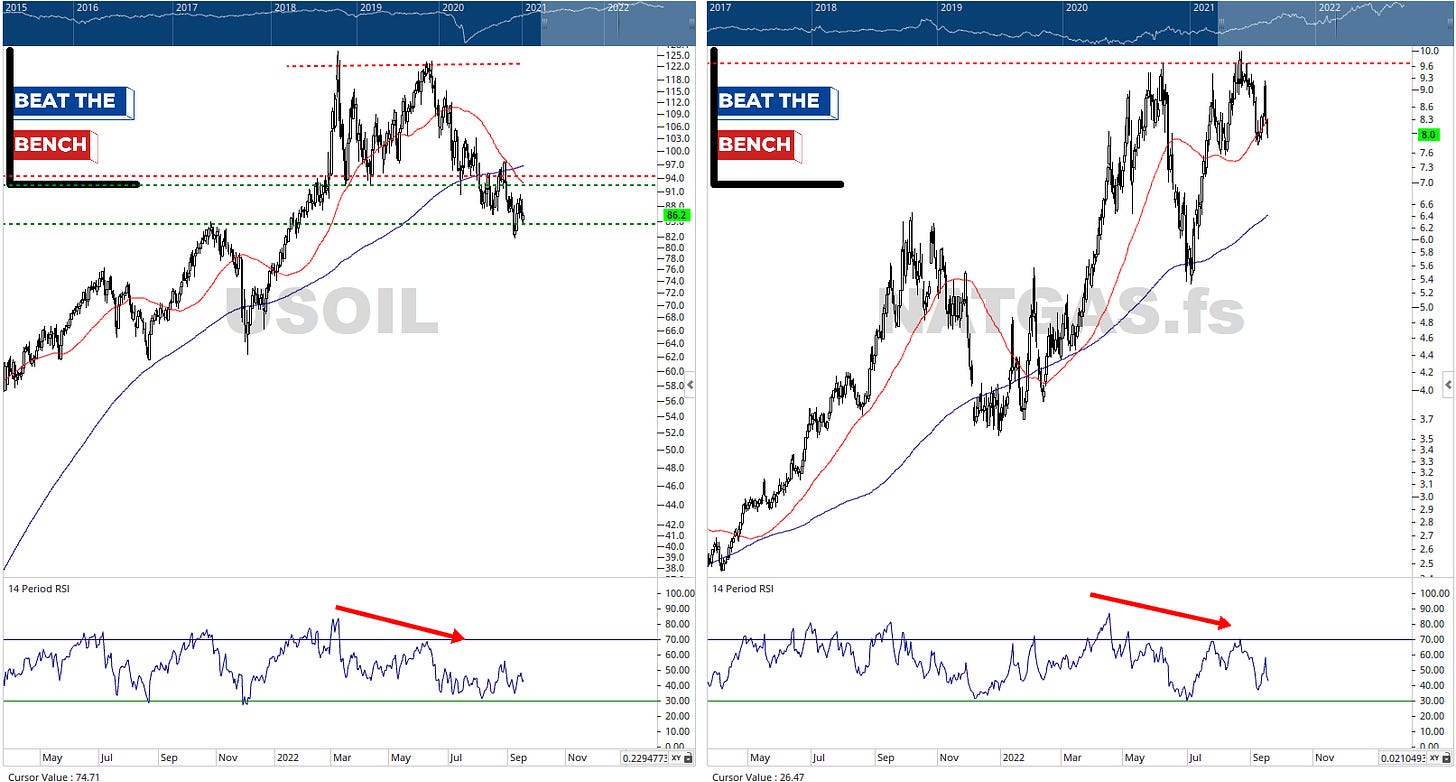
What, you don’t like energy?
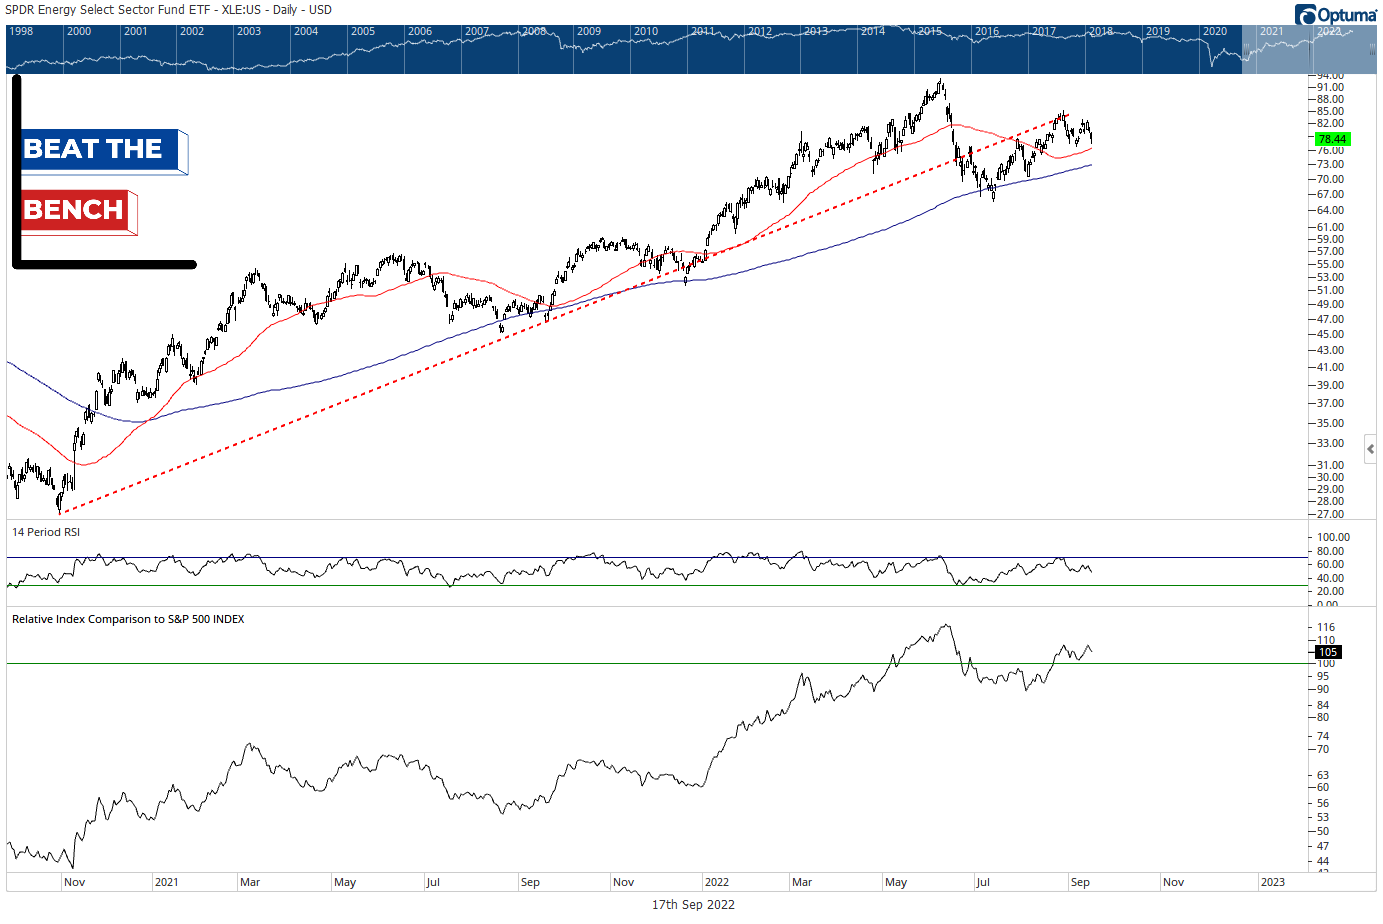
Energy is benchmarked to neutral in the sector allocation despite its strong performance YTD. The sector peaked in absolute and relative terms back in early June and the charts of key commodities shown below have me unwilling to place bets on being overweight energy. However, betting against energy (by having the model underweight) would be a mistake given the longer-term relative strength picture.
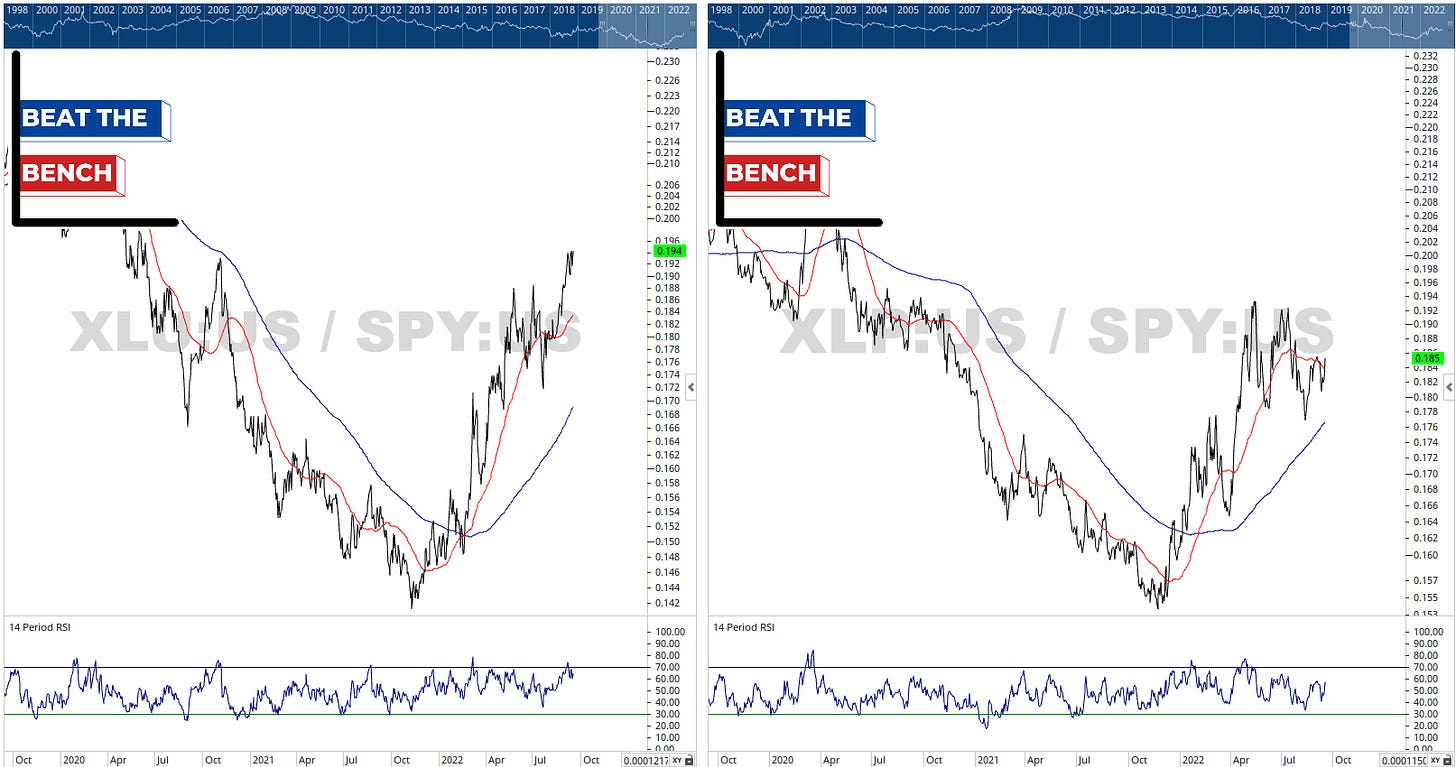
Hiding in the defensives.
Utilities are clearly the recent winner here (more insulated from the dollar’s strength), but both utilities and staples remain in relative uptrends and have absolute charts that are “less bad” than others right now.
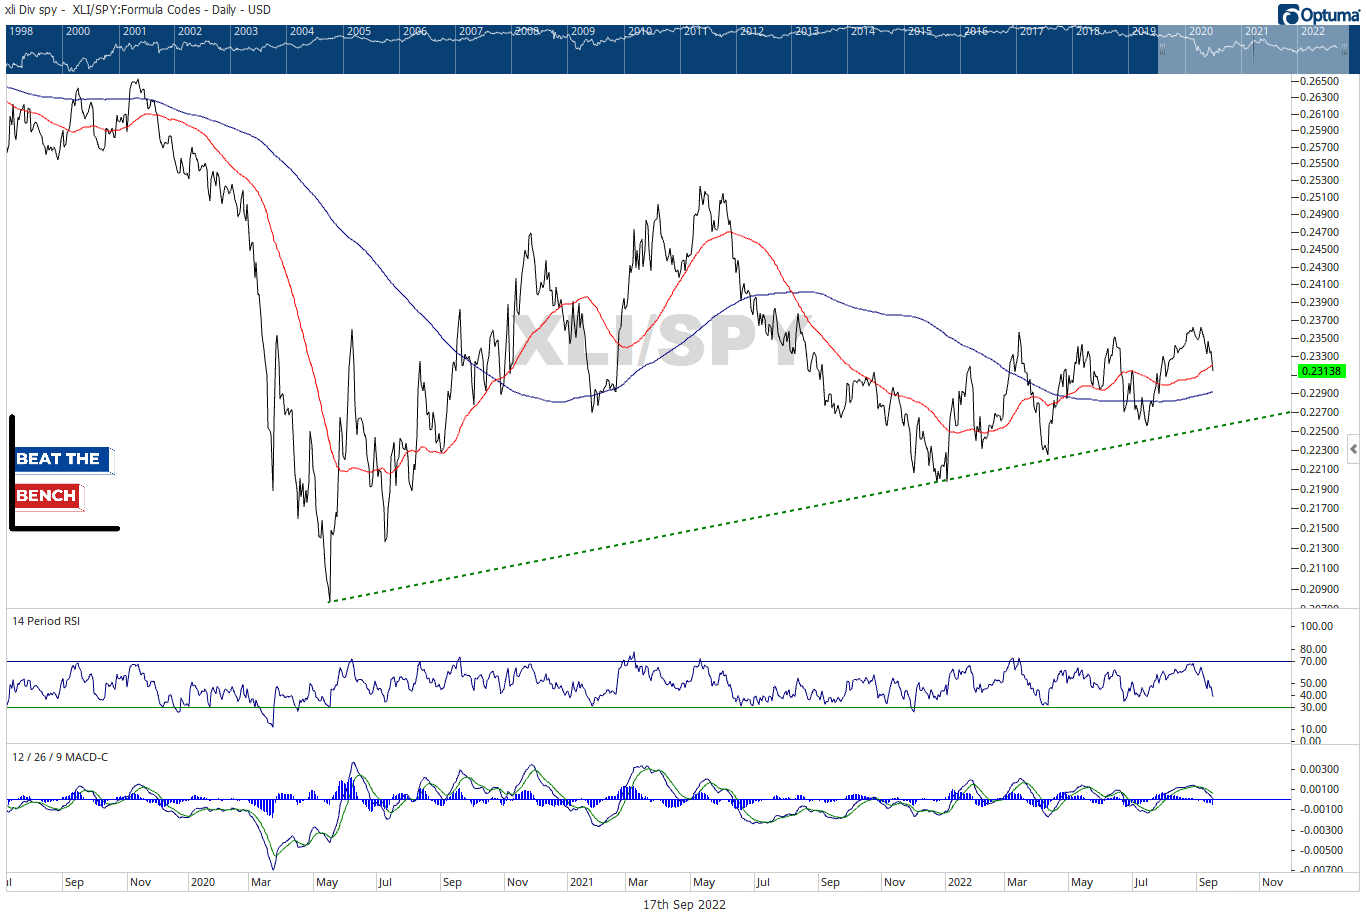
Did you not see the FedEx report?
I did, but one day does not a trend make. Industrials in relative terms have been surprisingly resilient this year, especially when you consider dollar strength. And remember, everything is a pair trade, and the industrials overweight is sourced from communication services which…
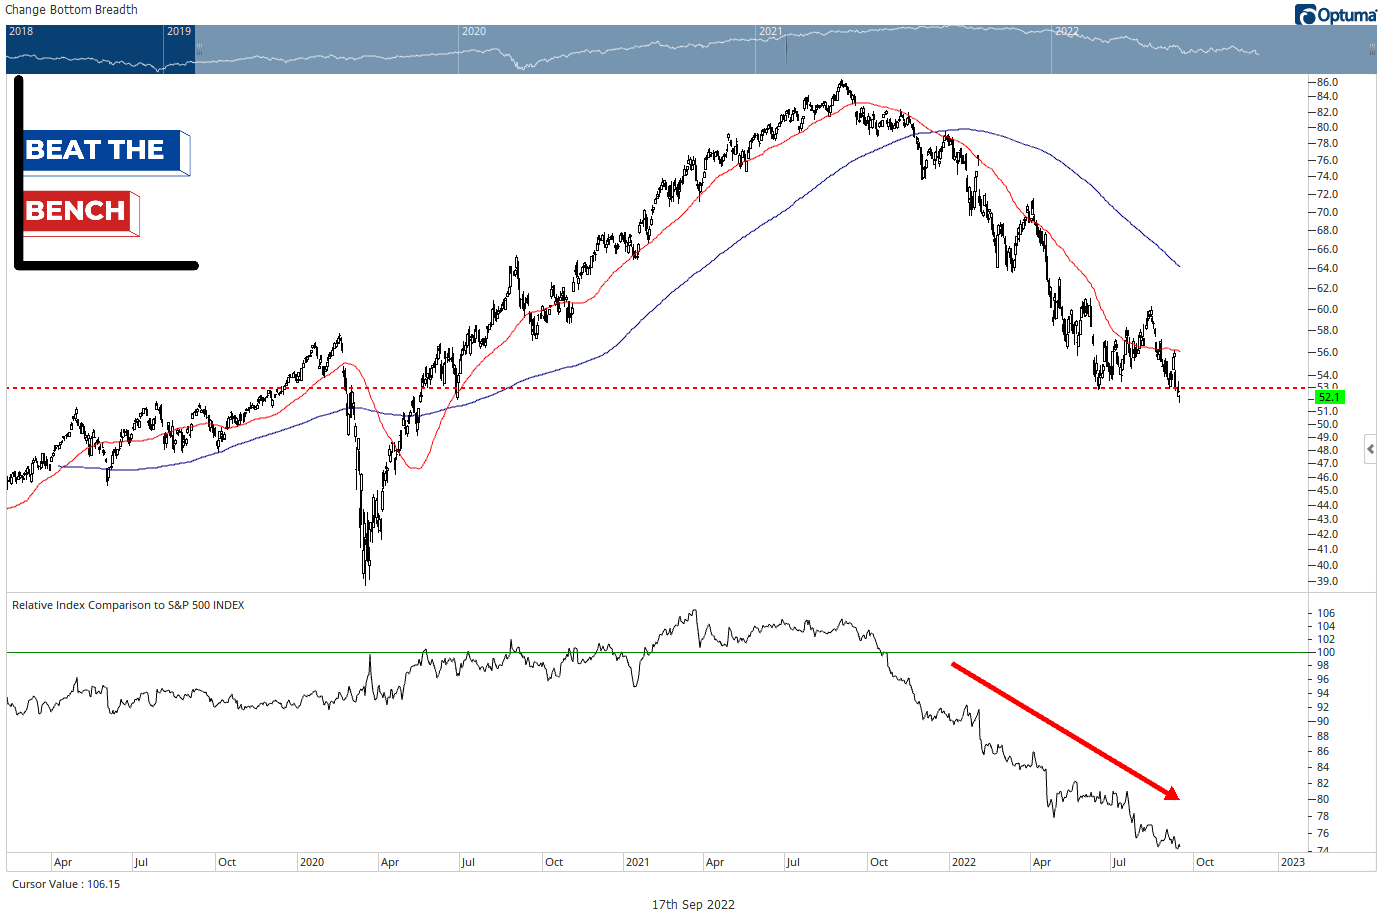
Communication services is astonishingly bad.
Is the underperformance extreme? Yes. Can you do anything but underweight this sector until we see some actual signs of the trend changing? No. New 52-week lows for comms services on Friday.
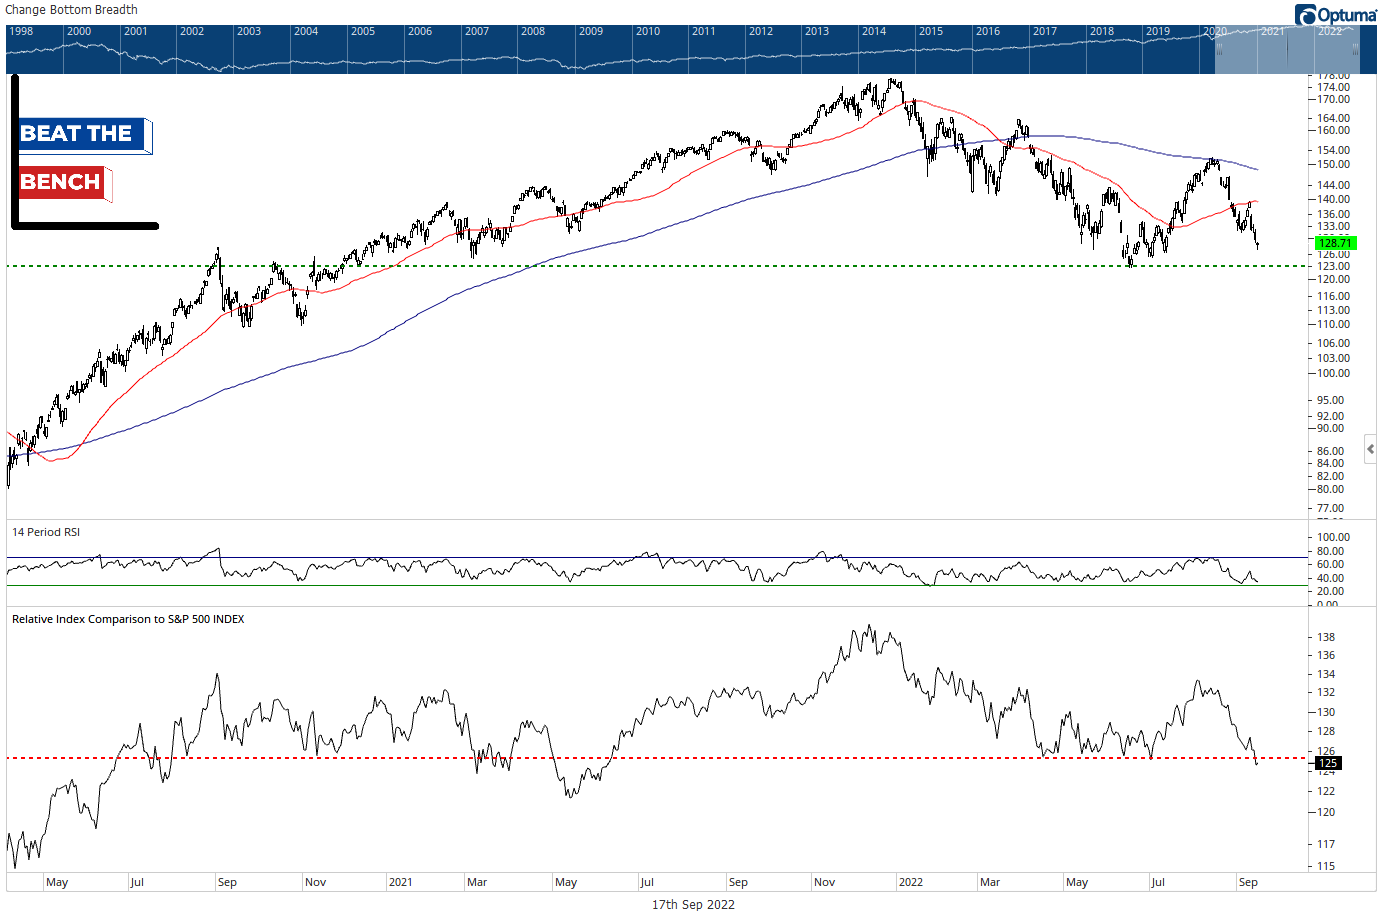
52-week relative lows for Tech, are absolute ones next?
The tech sector closed at 52-week relative lows on Friday, and that means that key support at $123 for XLK is all that separates the sector from 52-week lows in absolute terms. Stay tuned for tomorrow’s premier edition of The Deep Dive, where we take a closer look at what is happening within technology.
Other Noteworthy Charts
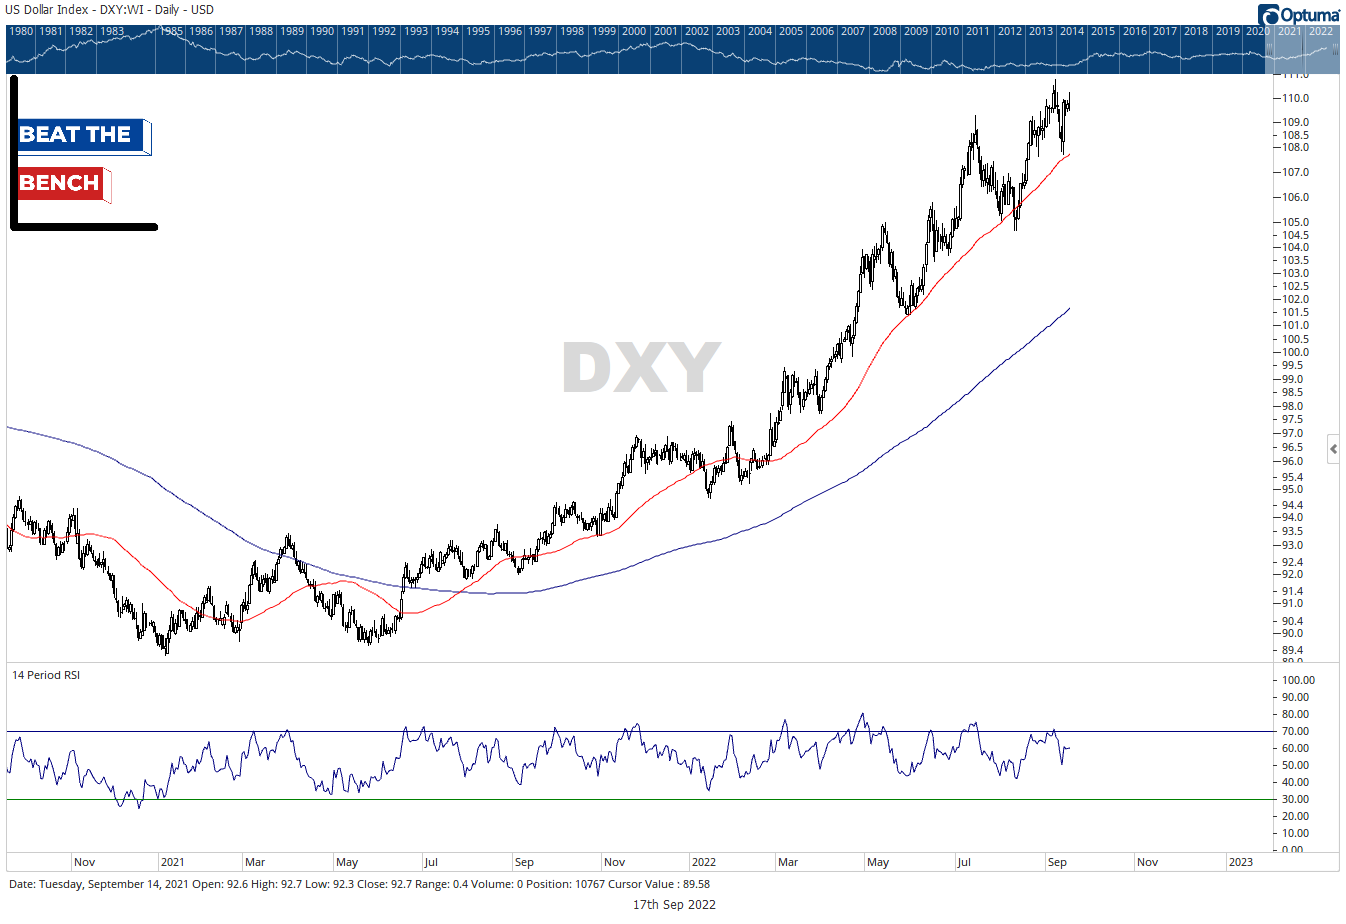
Betting against the dollar is this year’s widowmaker trade. And it remains a problem for risk assets.
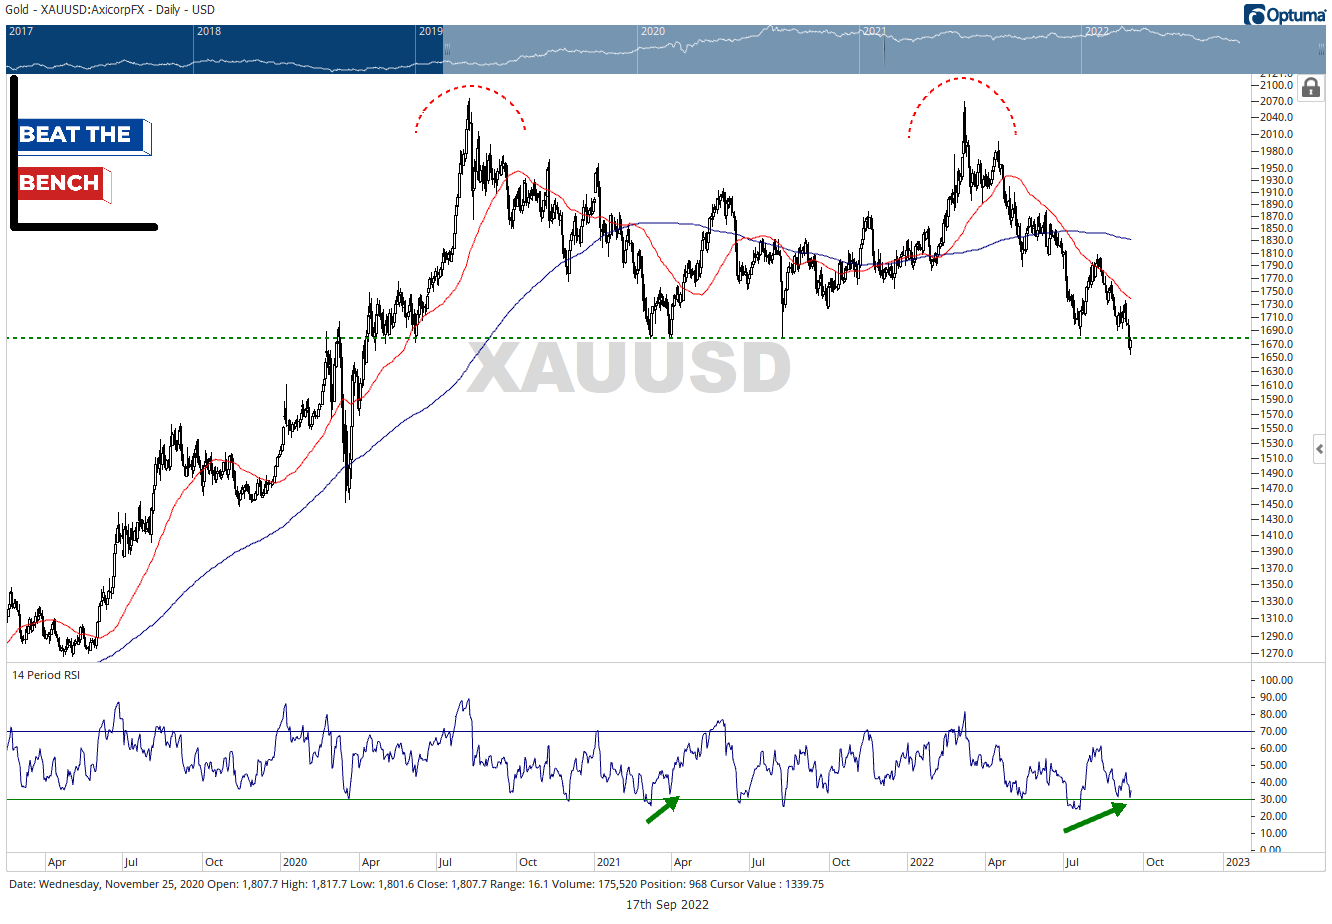
Gold broke support on Friday. But momentum is positively diverging, and silver hasn’t yet confirmed. Dead money big picture, but worth watching.
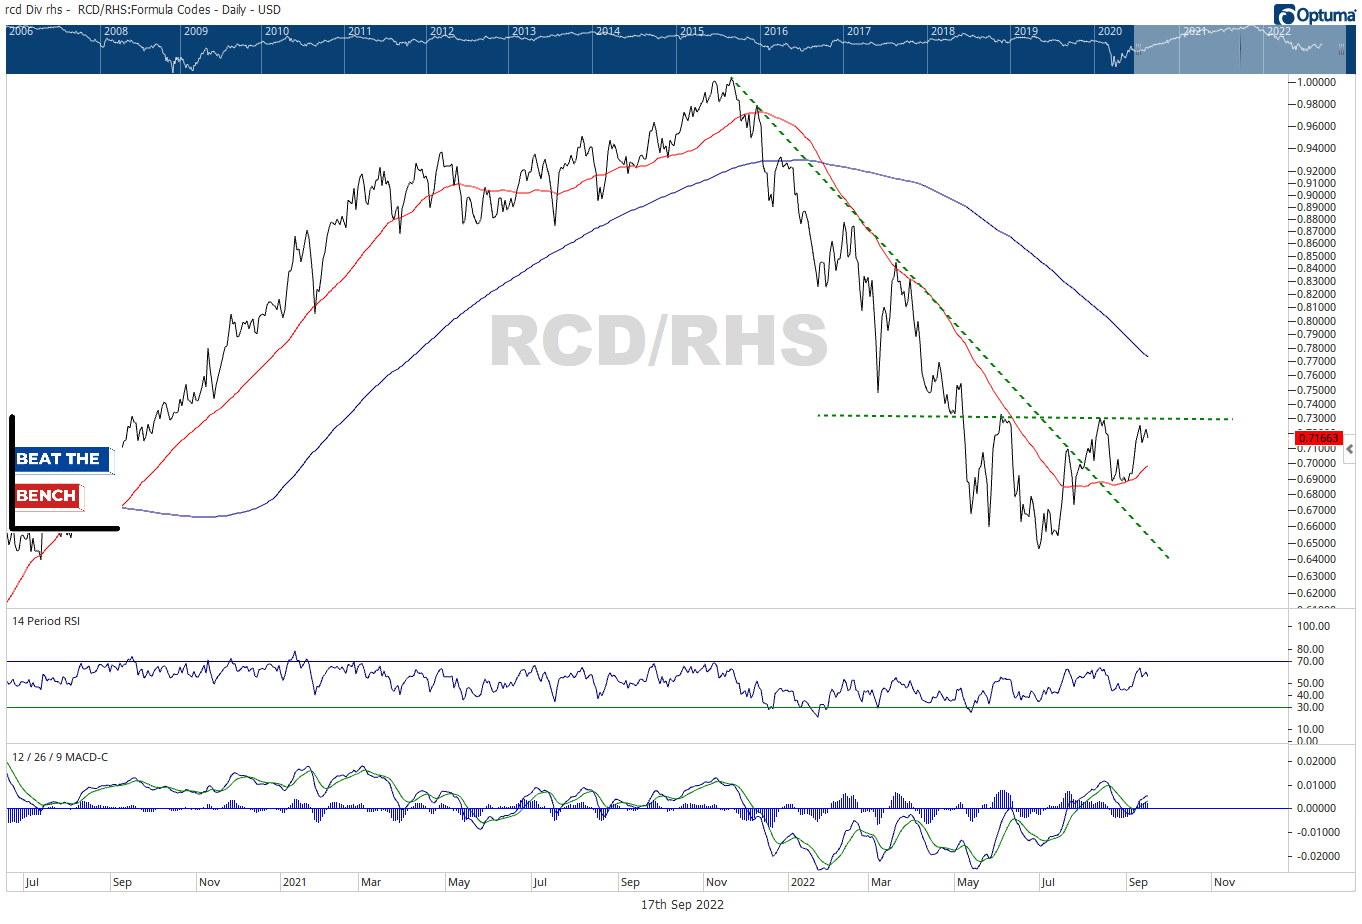
Discretionary vs. Staples hasn’t taken this latest leg lower with equities. This is the equal-weight version, but cap-weighted tells the same story. Positive divergence from a ratio that has been a guiding light the past 3 years.
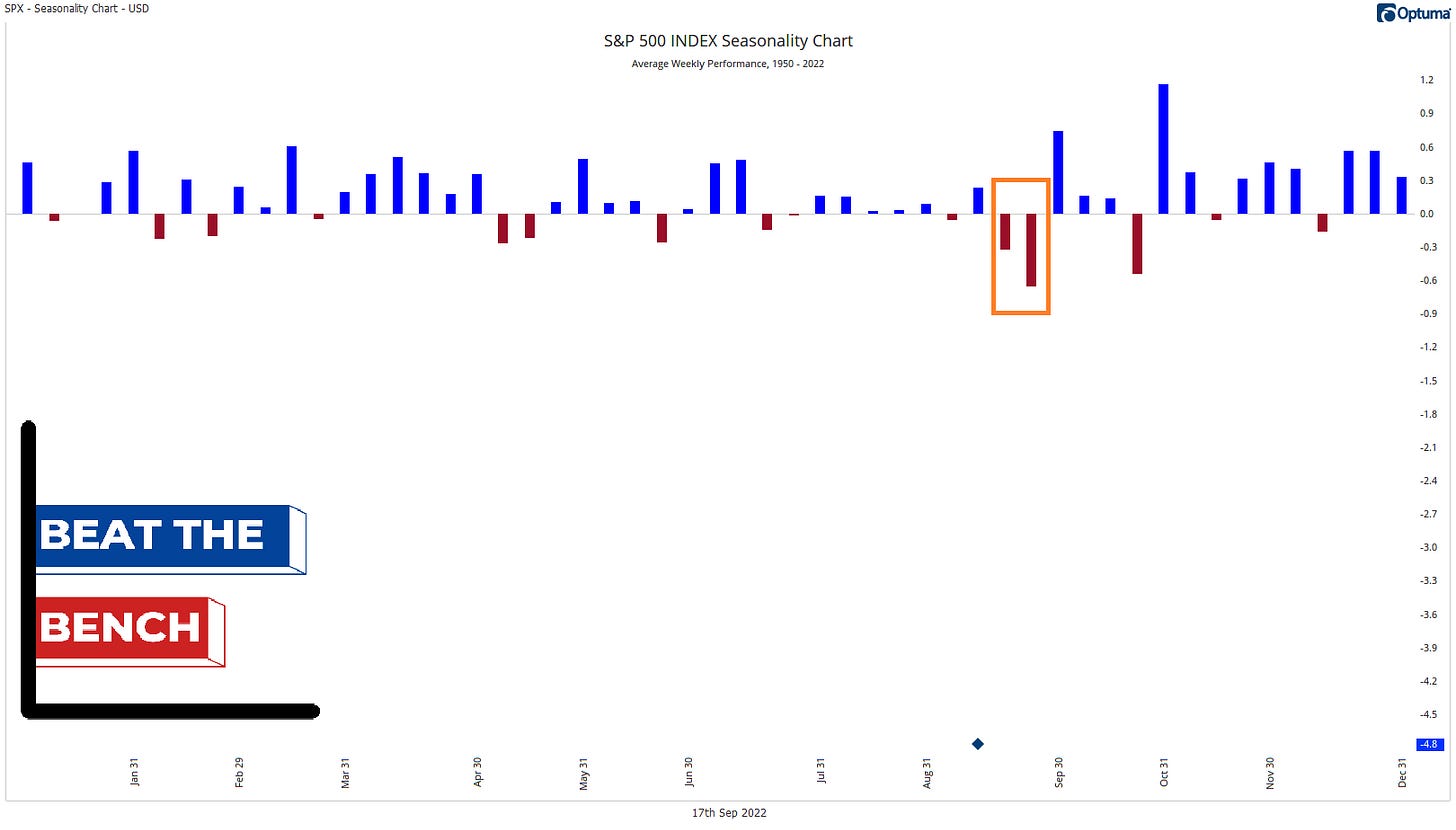
The next two weeks are some of the weakest of the year.
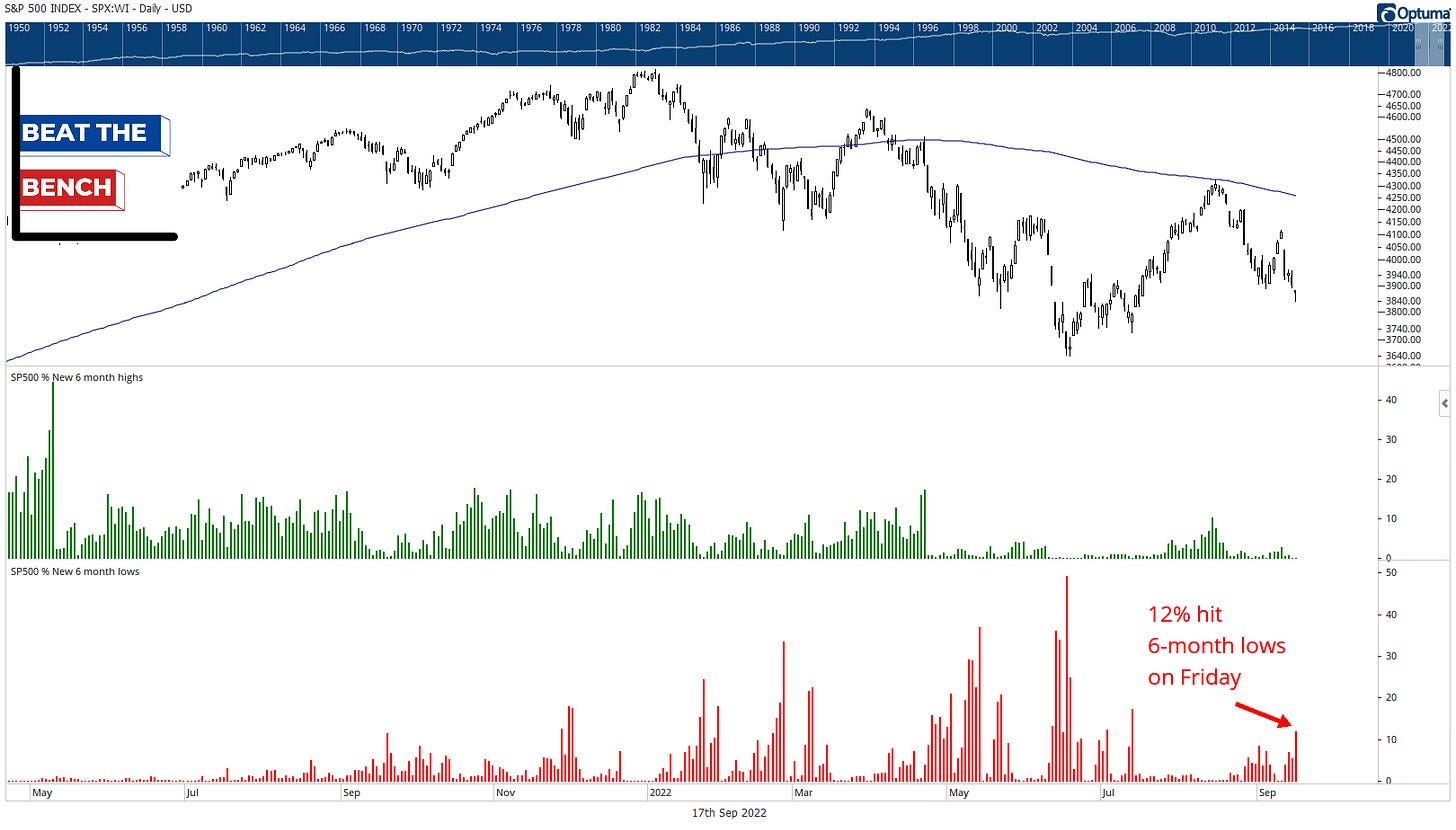
12% of the S&P 500 hit a six-month low on Friday. If I’m wrong about most stocks having made their low for the year, we’ll see 6-month lows begin creeping up before 52-week lows. 6-month lows hit 12% on Friday, its highest reading since July 14.
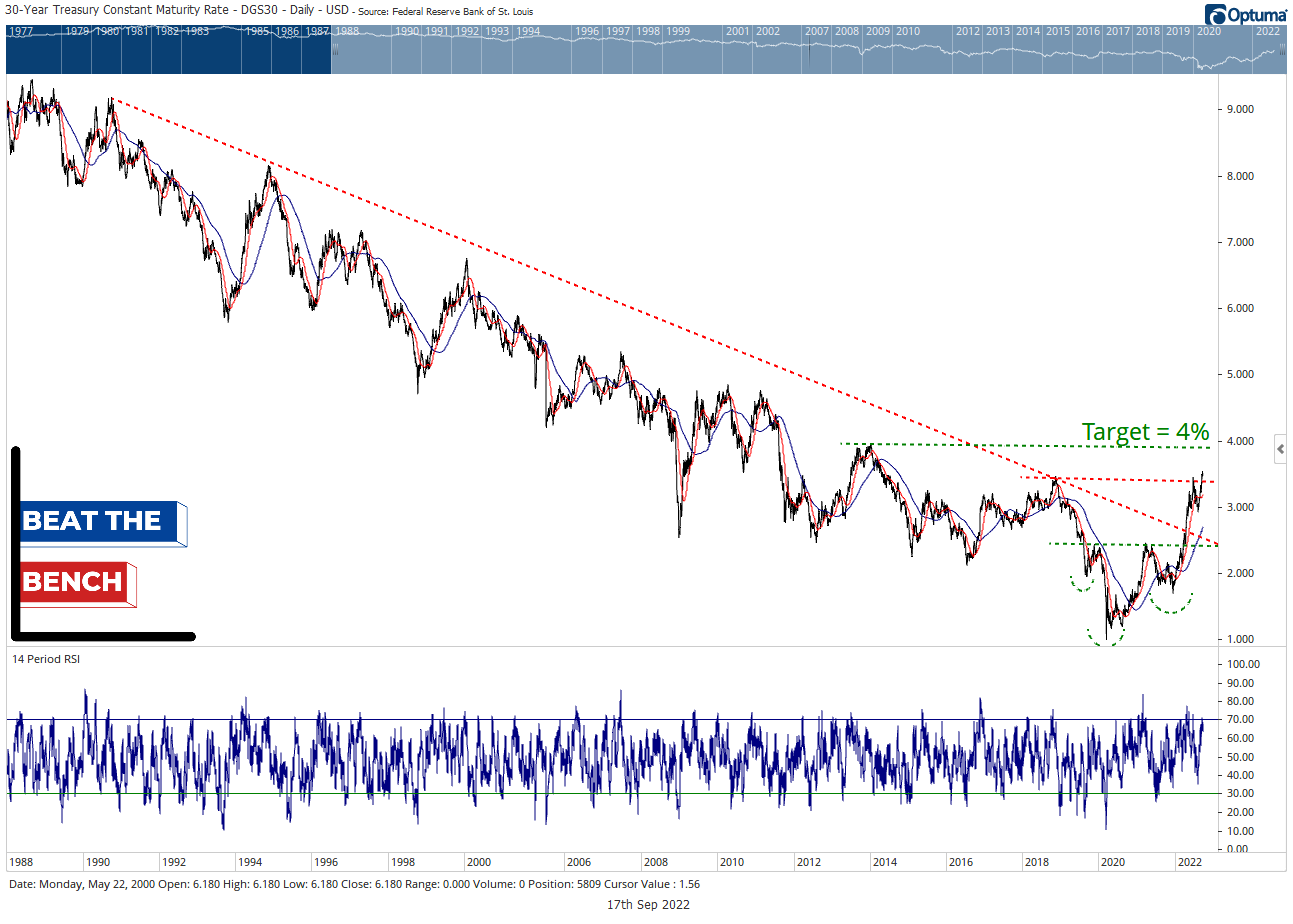
Rates, rates, rates. The 30-year yield posted its highest weekly close since 2014 on Friday, and the 10-year looks like it wants to be next. As long as the 30-year is above the 2018 high of 3.38%, I have to believe that the risk to rates is still to the upside. If I’m wrong and the long-end starts to move lower, it may be a sign that the market’s focus is shifting more to the economic consequences of Fed tightening (see the FedEx report from last week).
That’s it for this week! Thanks so much for reading and be sure to subscribe to get the rest of this week’s publications. Tuesday’s The Deep Dive will explore the information technology sector, and my individual equity report, Stocks: The Good, The Bad, and The Ugly will highlight long and short opportunities within the S&P 500 components.
Scott Brown, CMT
Founder and Chief Investment Strategist, Beat The Bench LLC


Fantastic! Looking forward to reading more but definitely leaning towards subscribing. Love the direct recommendations to us managing money. Great stuff!
Pretty good stuff,looking forward to your next issues.
FG