

Good morning,
There’s a lot to cover this week, but I want to use today’s intro to briefly discuss what appears to be the market’s biggest catalyst right now: The Fed.
While we were away, the daily parade of Fed speakers did an about-face, sending the odds of a December cut from around 30%, up to 86% today.
The market has soared in response, posting its best five-day stretch since May, supported by solid breadth and the right leadership.
We aren’t here to question the market, and if that continues, there is no reason to doubt the potential for equities as we look ahead to 2026.
However, today’s report will highlight a number of charts that need to continue higher, and any near-term failures could be additional reasons for caution. We’ll also review why it seems obvious that the Fed should be cutting, and what market expectations say about their plans in 2026.
Today’s sections include:
Market action while we were away
The most important charts looking ahead
Why the Fed should clearly be cutting
Implications of a potential breakout in the dollar
November recap
Caution flags in healthcare
December seasonality and studies
and more!
View the presentation slides
The Plays
Be careful chasing healthcare and biotech stocks
Use the recent rally to reduce exposure to broken charts like Bitcoin and software
Last week: Stocks soared in the holiday-shortened week, with the S&P 500 gaining 3.7%, its best week since May. Consumer discretionary (+4.9%) and technology (+3.6%) led on a sector basis, while small caps (Russell 2000 +5.6%) outperformed large. The dollar fell nearly 1%, gold gained 3.6%, bond prices were slightly higher, and energy (+1.2%) was the worst-performing sector.
This week: Focus on the Fed continues with Powell scheduled to speak on Monday. Key economic reports include manufacturing PMIs on Monday, JOLTS jobs openings on Tuesday, services PMIs and industrial production on Wednesday, and PCE, the Fed’s preferred measure of inflation, on Friday.
Key Earnings: (courtesy of @ewhispers)

This week’s level to watch
$54 on XLF, the SPDR Financials Sector ETF
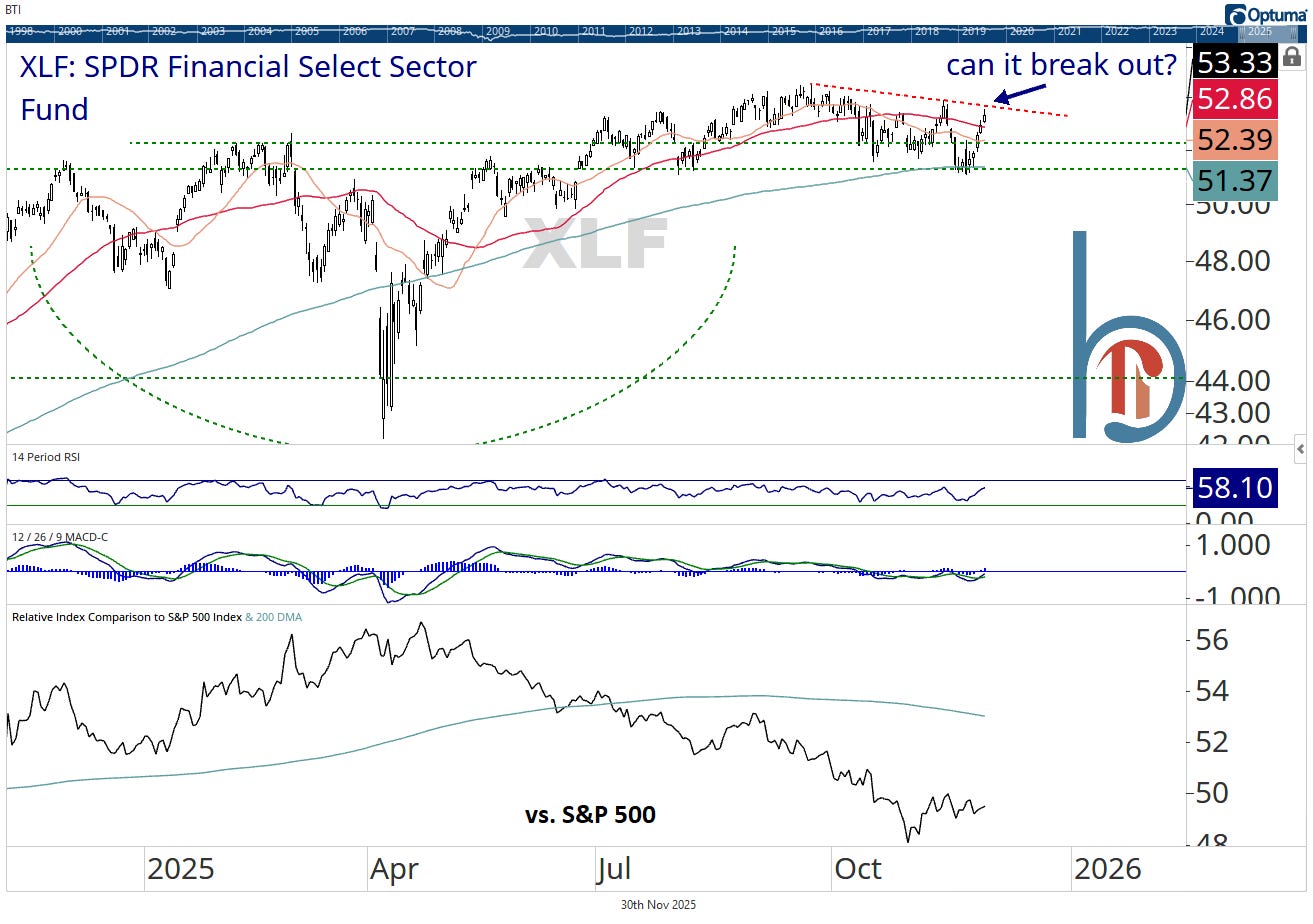
This week’s level to watch is $54 on XLF. Financials haven’t been leadership but the sector is an important economic barometer and the second-largest in the S&P 500 (12.8% weight). XLF has held support at the top of a big base and its 200-DMA, but needs to clear $54 to break a two-month downtrend line.
While we were away
Bearish reversal on Thursday, straight higher since
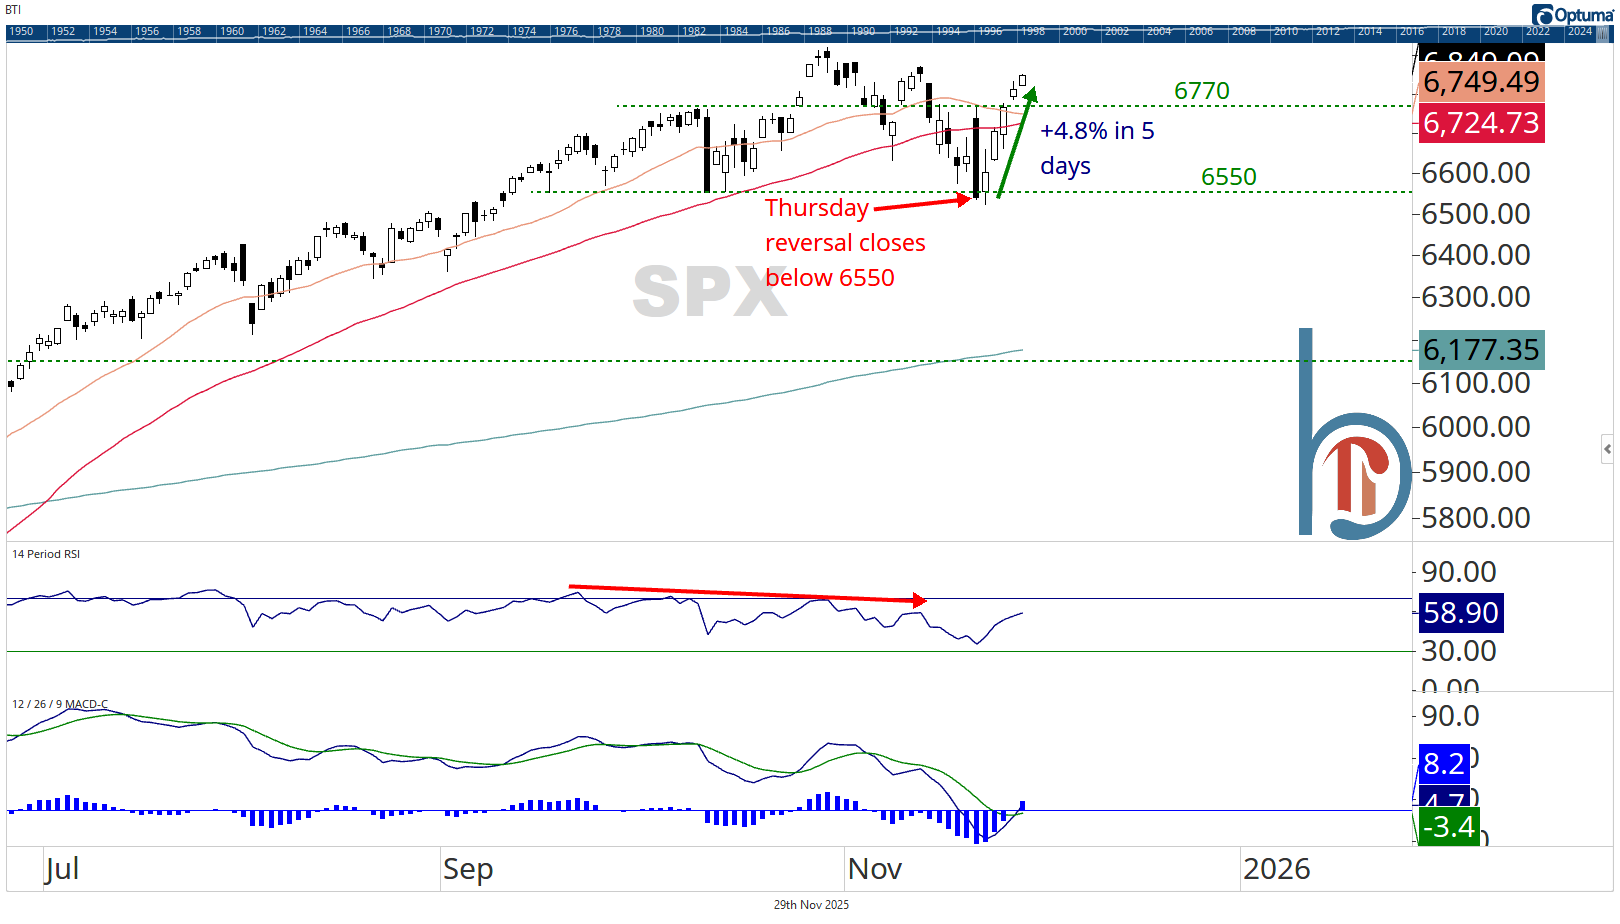
Our last publication came out on the prior Thursday, a day that marked a historic reversal for the S&P 500. The index opened higher by +1.5%, but closed lower by -1.5%, something only seen twice before in history, both in October 2008. The break of 6550 didn’t last, though, and SPX has soared to five straight daily gains and a +4.8% advance in the five trading days since.
Big round trip for December cut odds
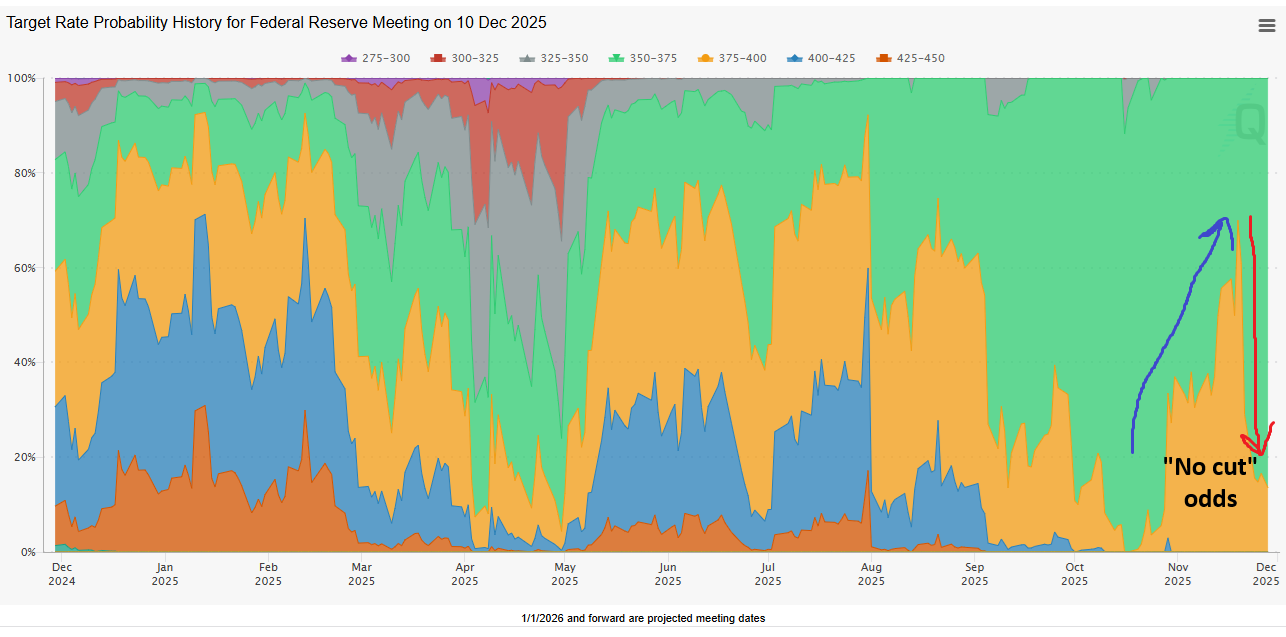
What was the catalyst for the bullish reversal? An about-face from the Fed that was sounding increasingly hawkish. But starting with Williams on the prior Friday, and continuing into last week, Fed officials have moved to suggest a December cut is likely, with Fed fund futures moving back to 86% in favor of a December cut.
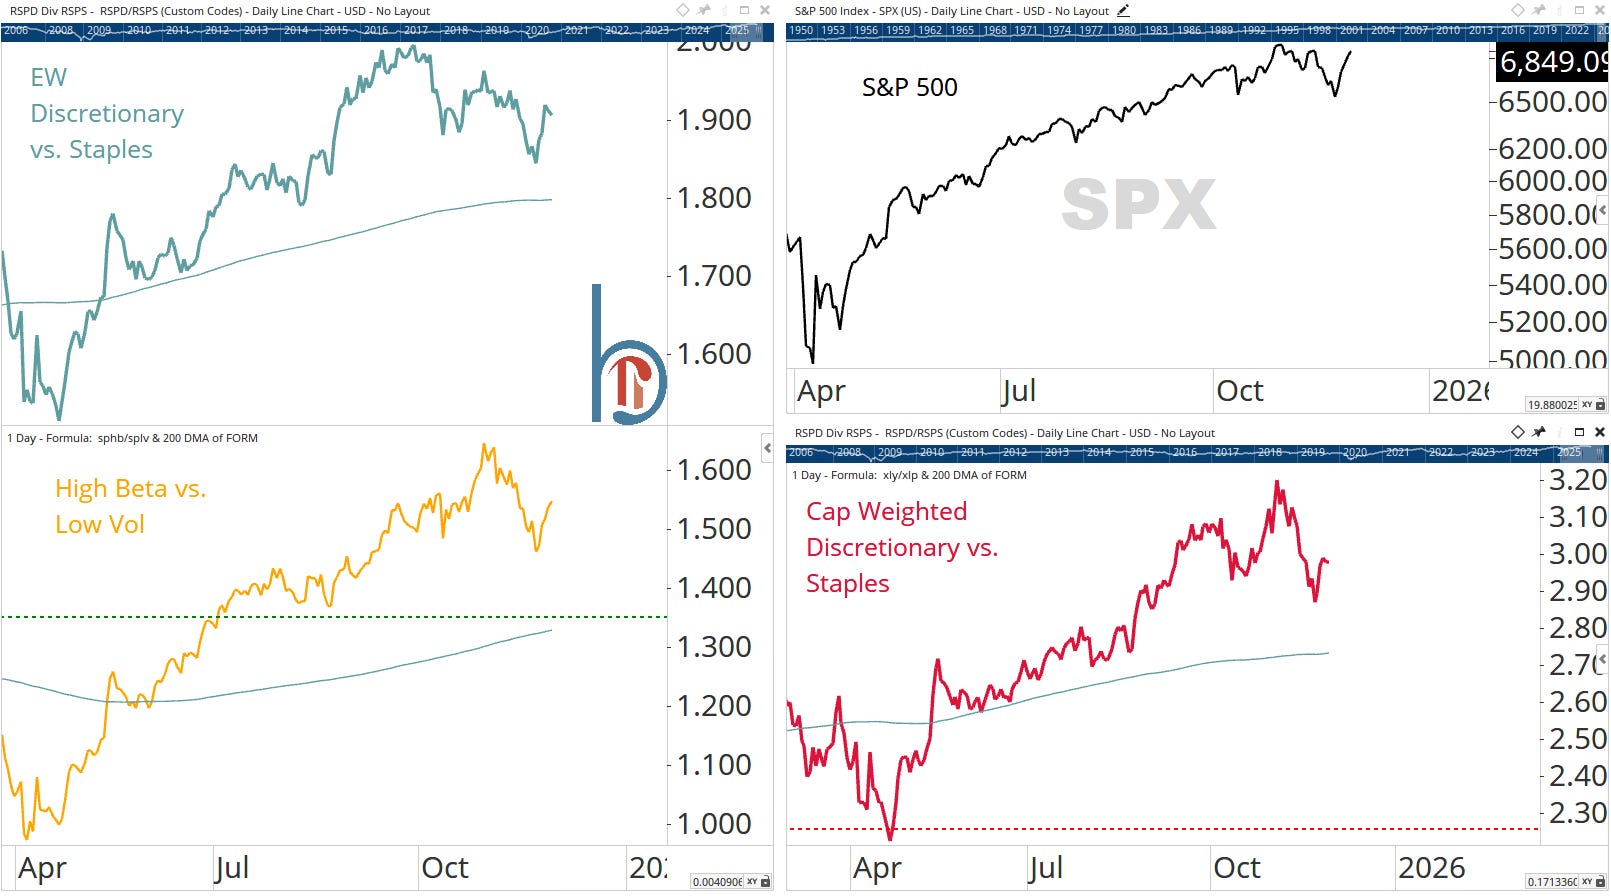
Leadership has been everything you could want to see
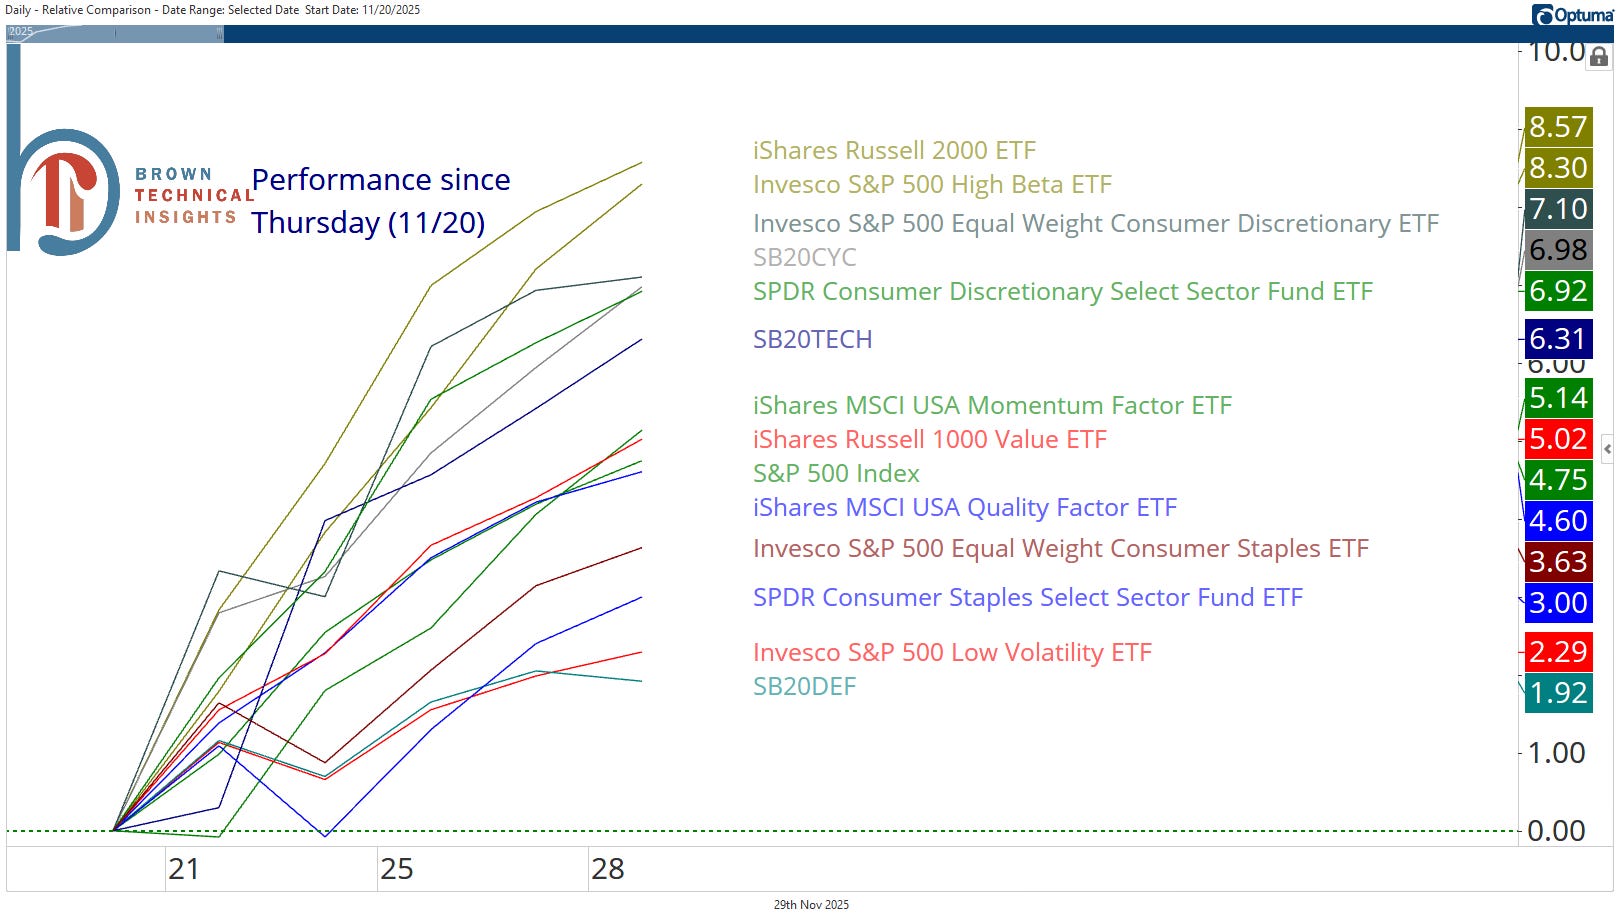
More important than any level on the S&P 500 is what has been the character of the rally? And for the bulls, there is nothing to report but good news. Small caps, high beta, and equal-weight discretionary are atop our risk barometer scoreboard, while the S&B 20 Defensives basket, low volatility, and consumer staples have lagged the most.
Solid breadth
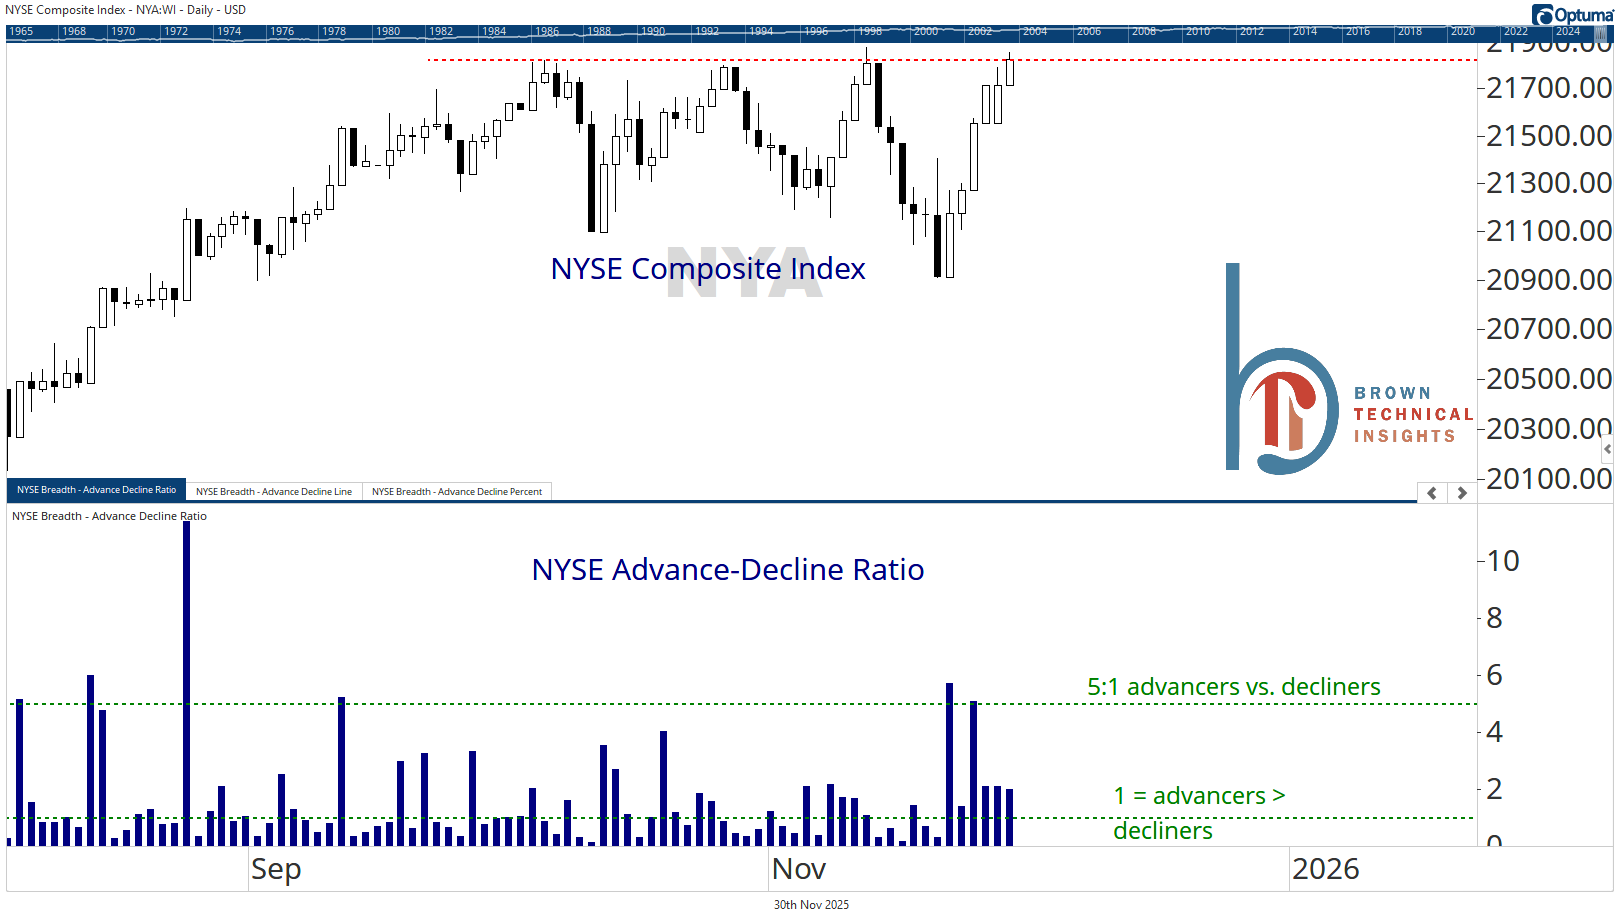
Advancers on the NYSE have outnumbered decliners for six straight days, and we’ve seen two days of better than 5:1.
Credit markets believe the rally too
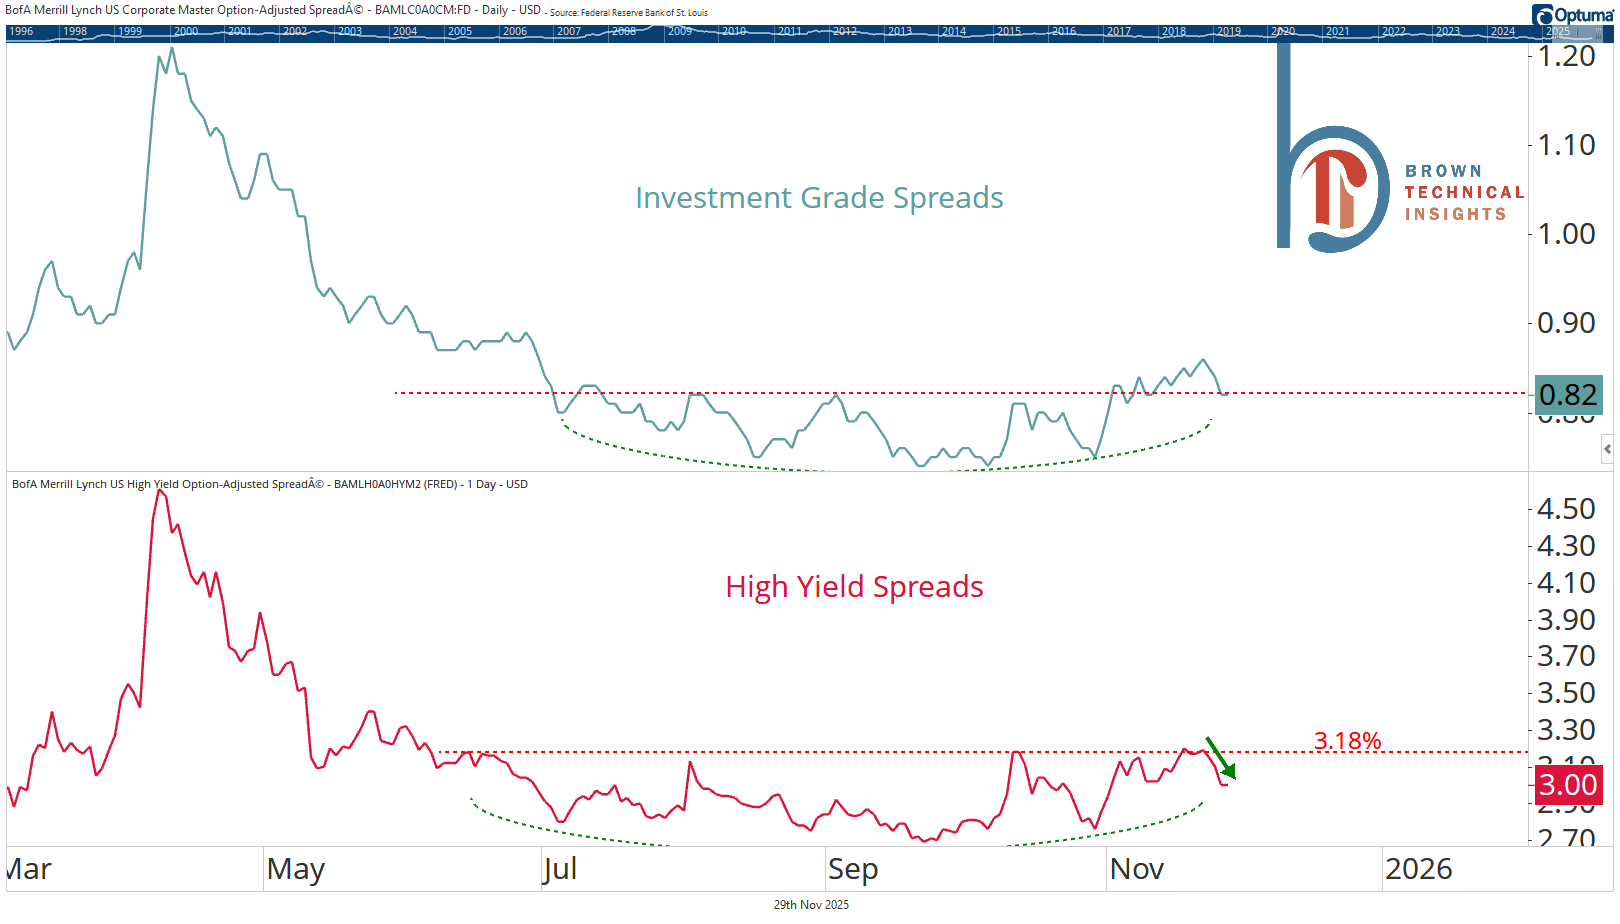
HY spreads have tightened by about 20 bps over the past week.
Looking ahead
Does leadership continue to confirm?
These are the three most important charts we’ll be watching in December. It’s not about whether the S&P 500 or one of these makes a new high first. It’s about do they continue higher (assuming the index does) or do they roll over? The S&B 20 risk ratios will also be telling.
Cyclicals vs. Defensives is arguably just an oversold bounce
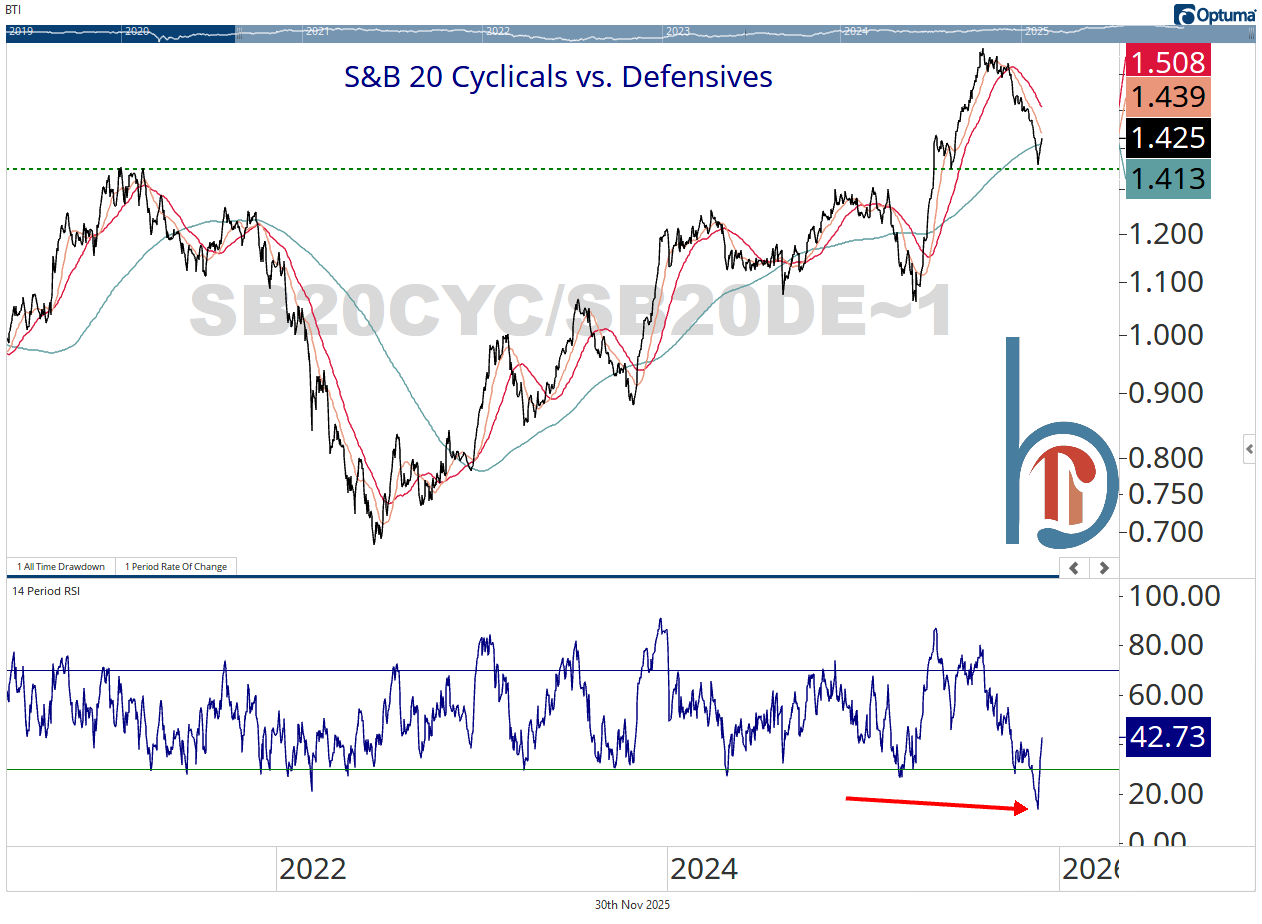
Logical support level, but a rally that fails could add a pretty big right shoulder.
Defensives vs. Top Tech 8 still basing
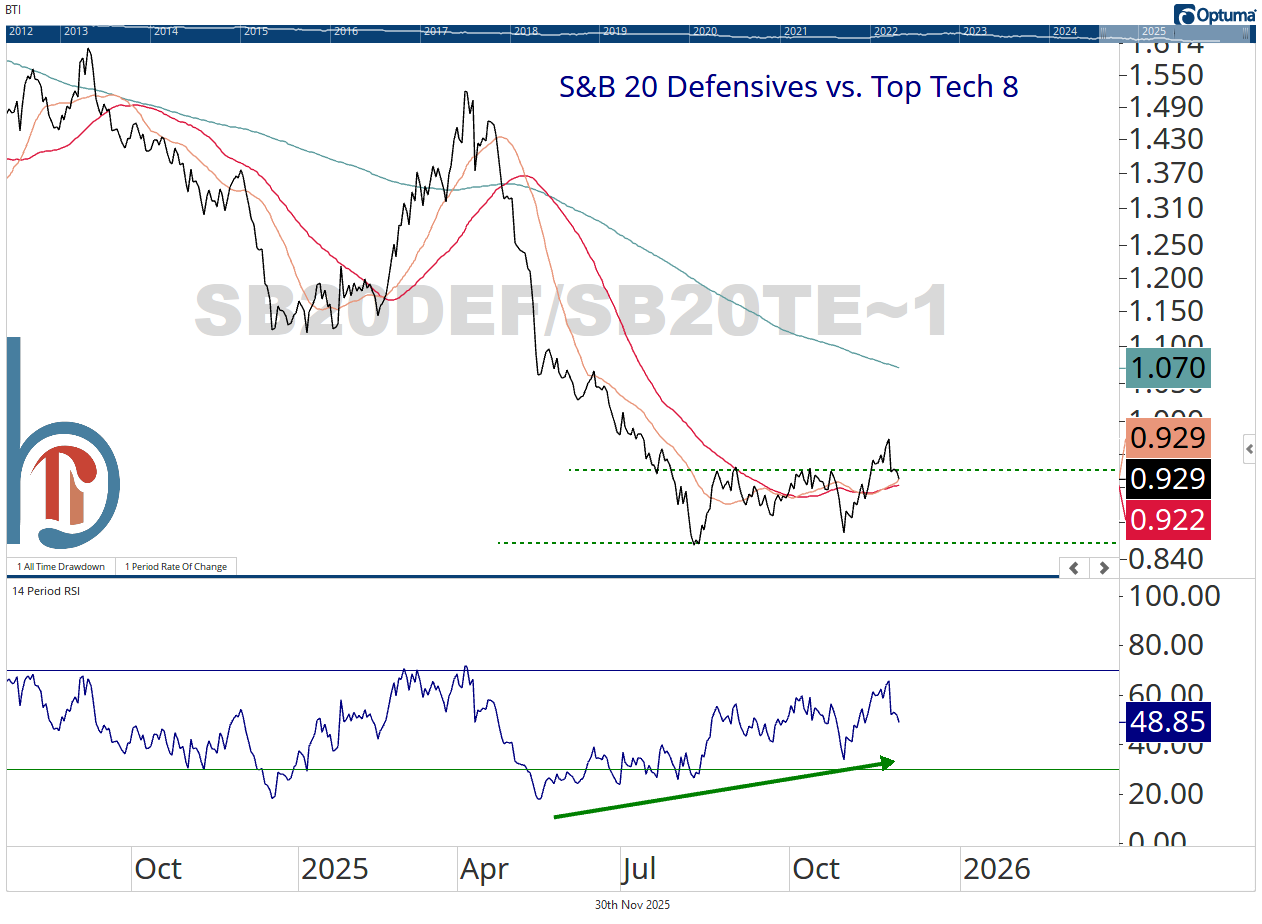
Getting below those short-term moving averages and ultimately making a new low would be the most bullish thing that could happen for 2026.
New high data is the key breadth signal
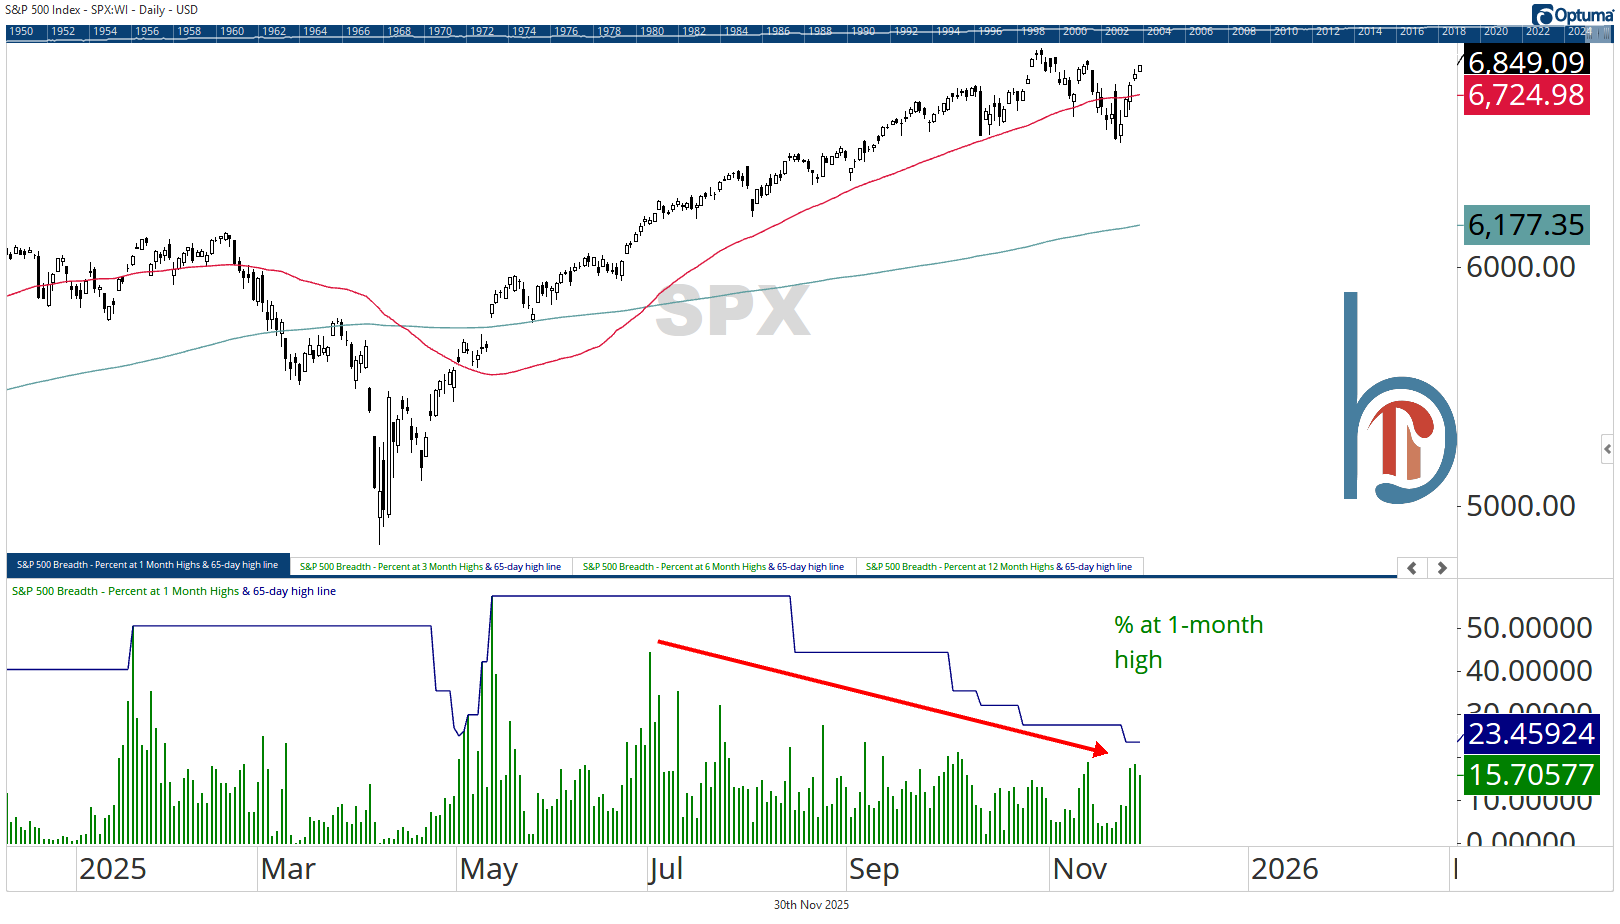
So far, the one-month high data continues to make lower highs. Seeing a reading above 25-30% would go a long way toward signalling the rally has legs. Note that we actually saw fewer new highs on Friday vs. Thursday despite a +0.5% gain for SPX.
One more reason the rally needs to continue
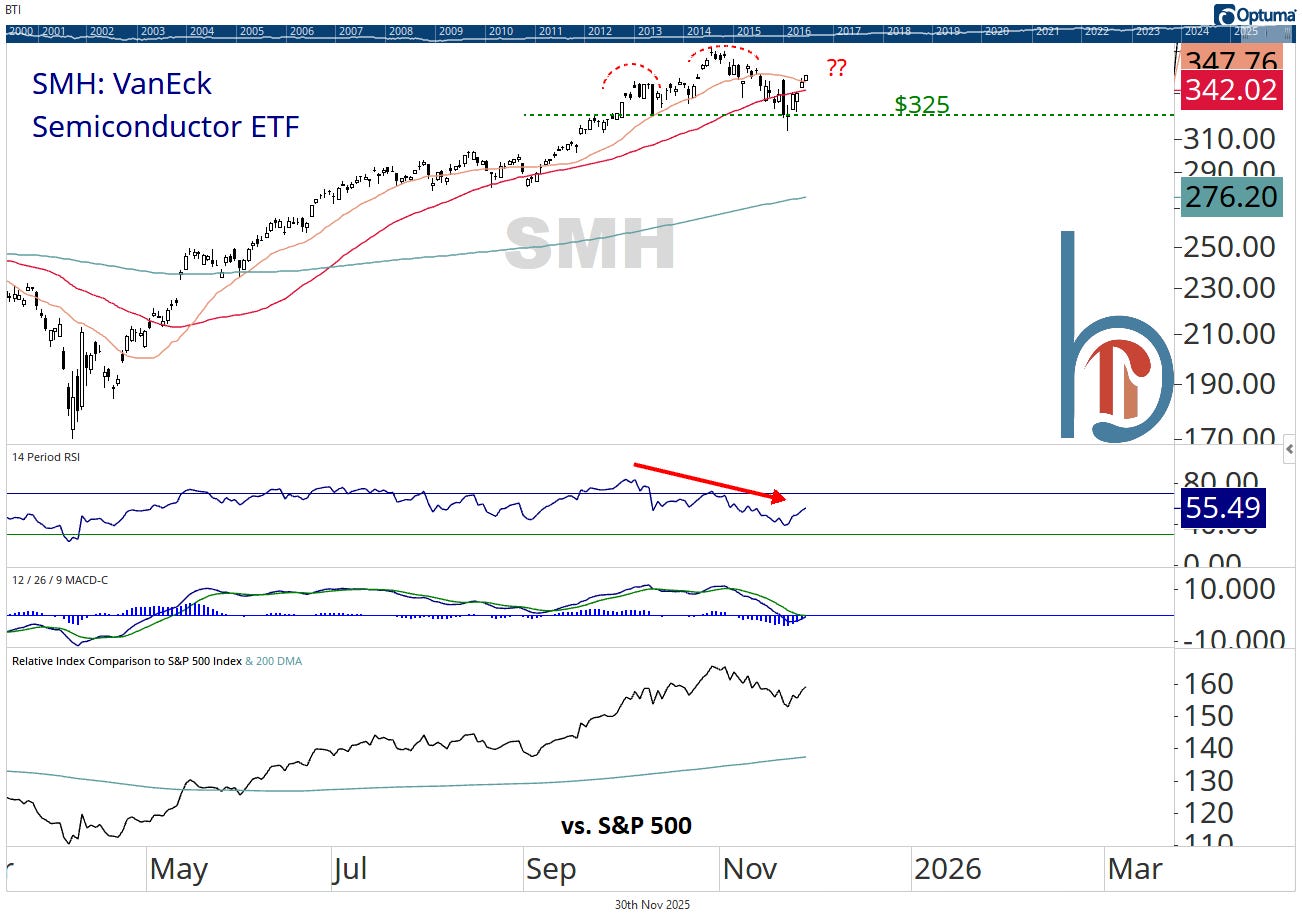
This wouldn’t be a great spot for weakness in the S&P’s most important industry group.
The ARKK funds have the same pattern
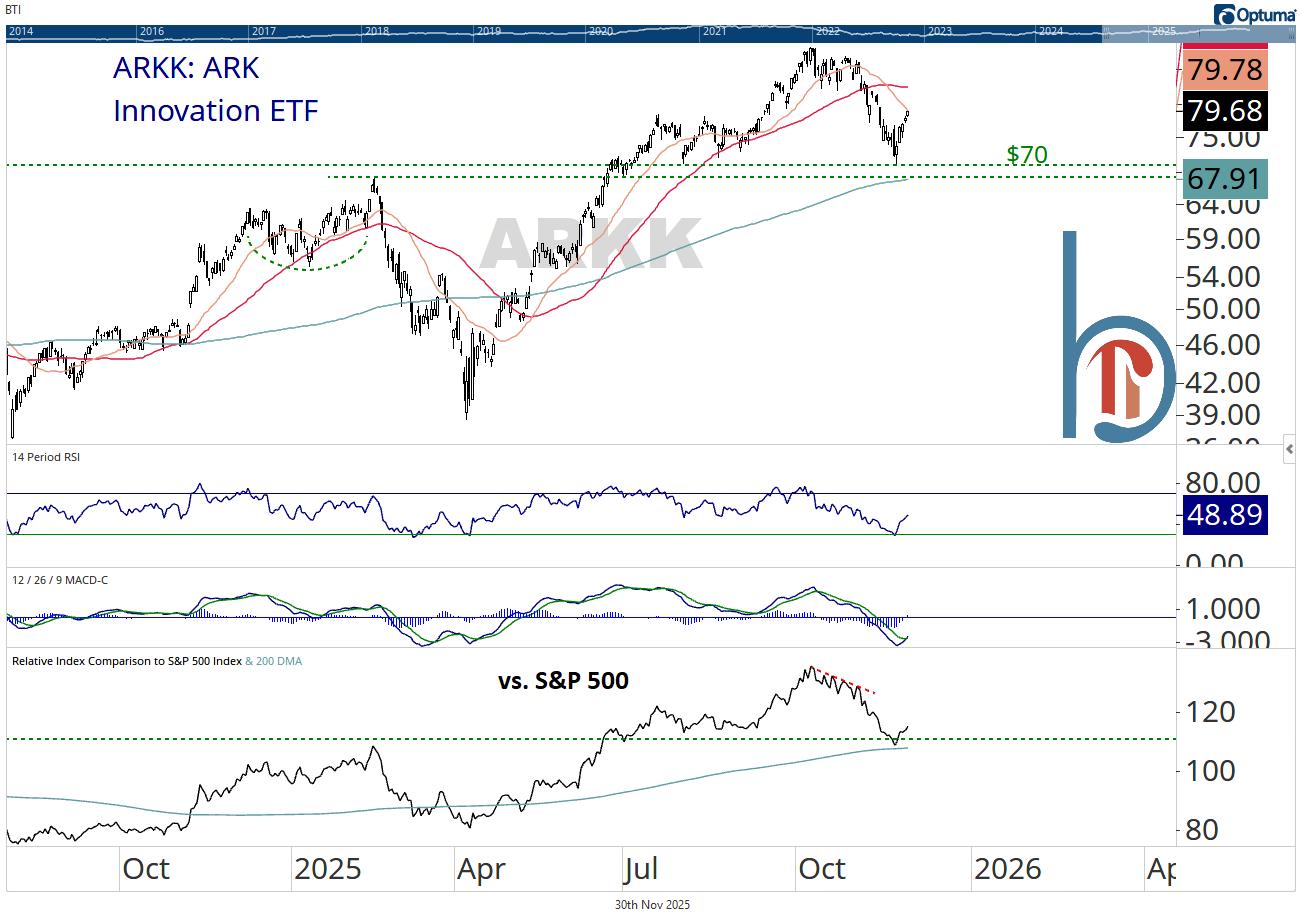
But above $70 and holding the relative breakout, it deserves the benefit of the doubt.
The Fed should clearly be cutting
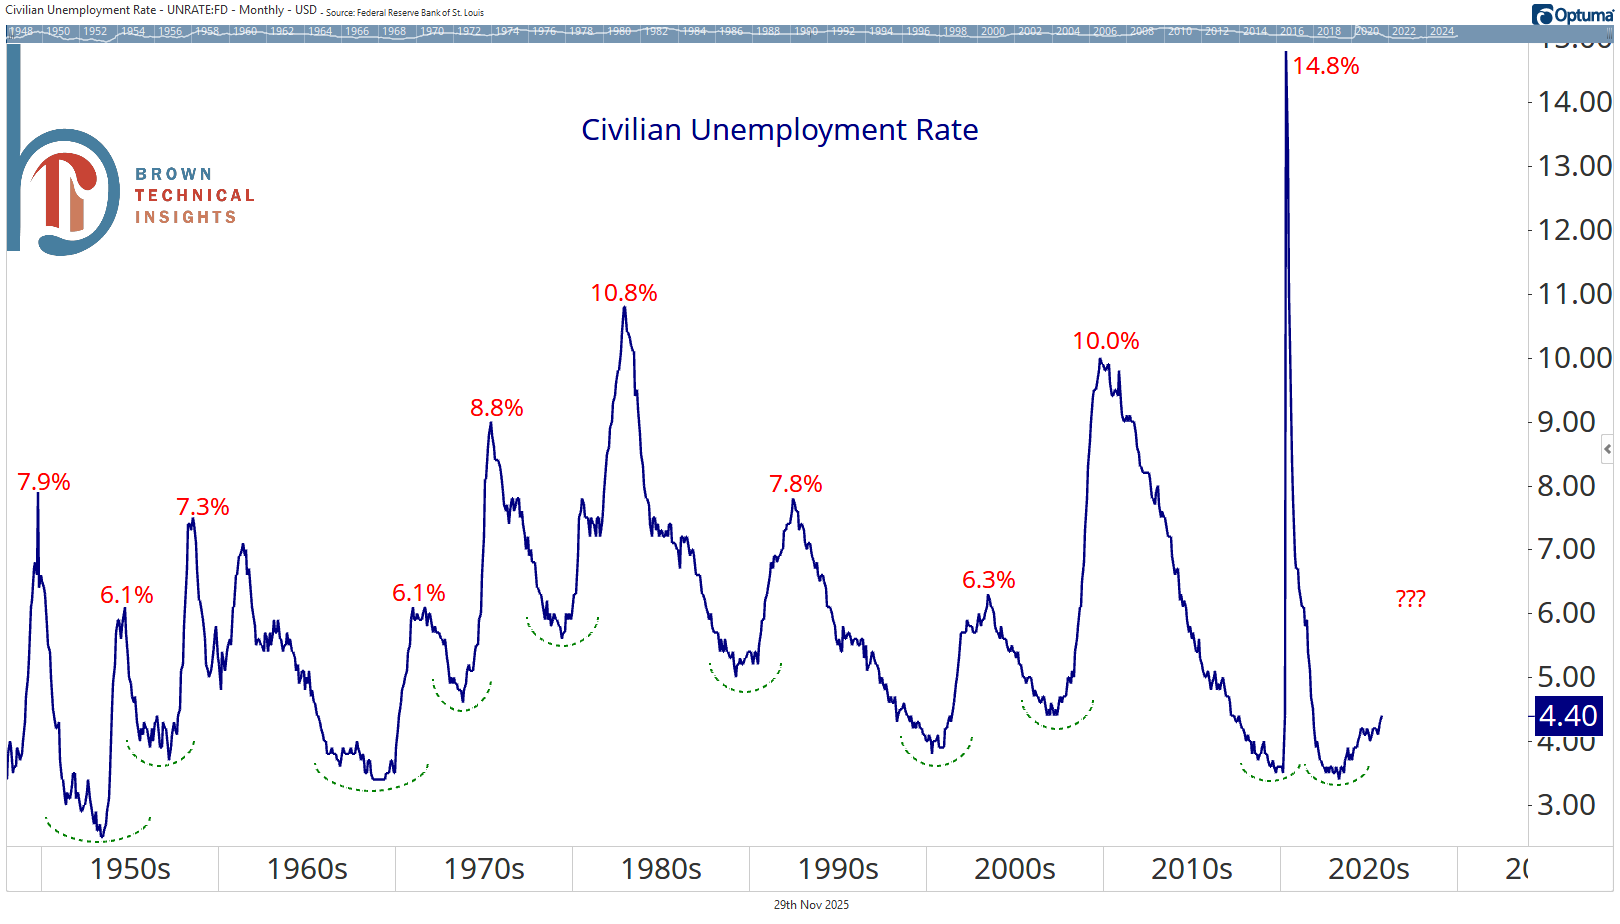
Unemployment has broken out
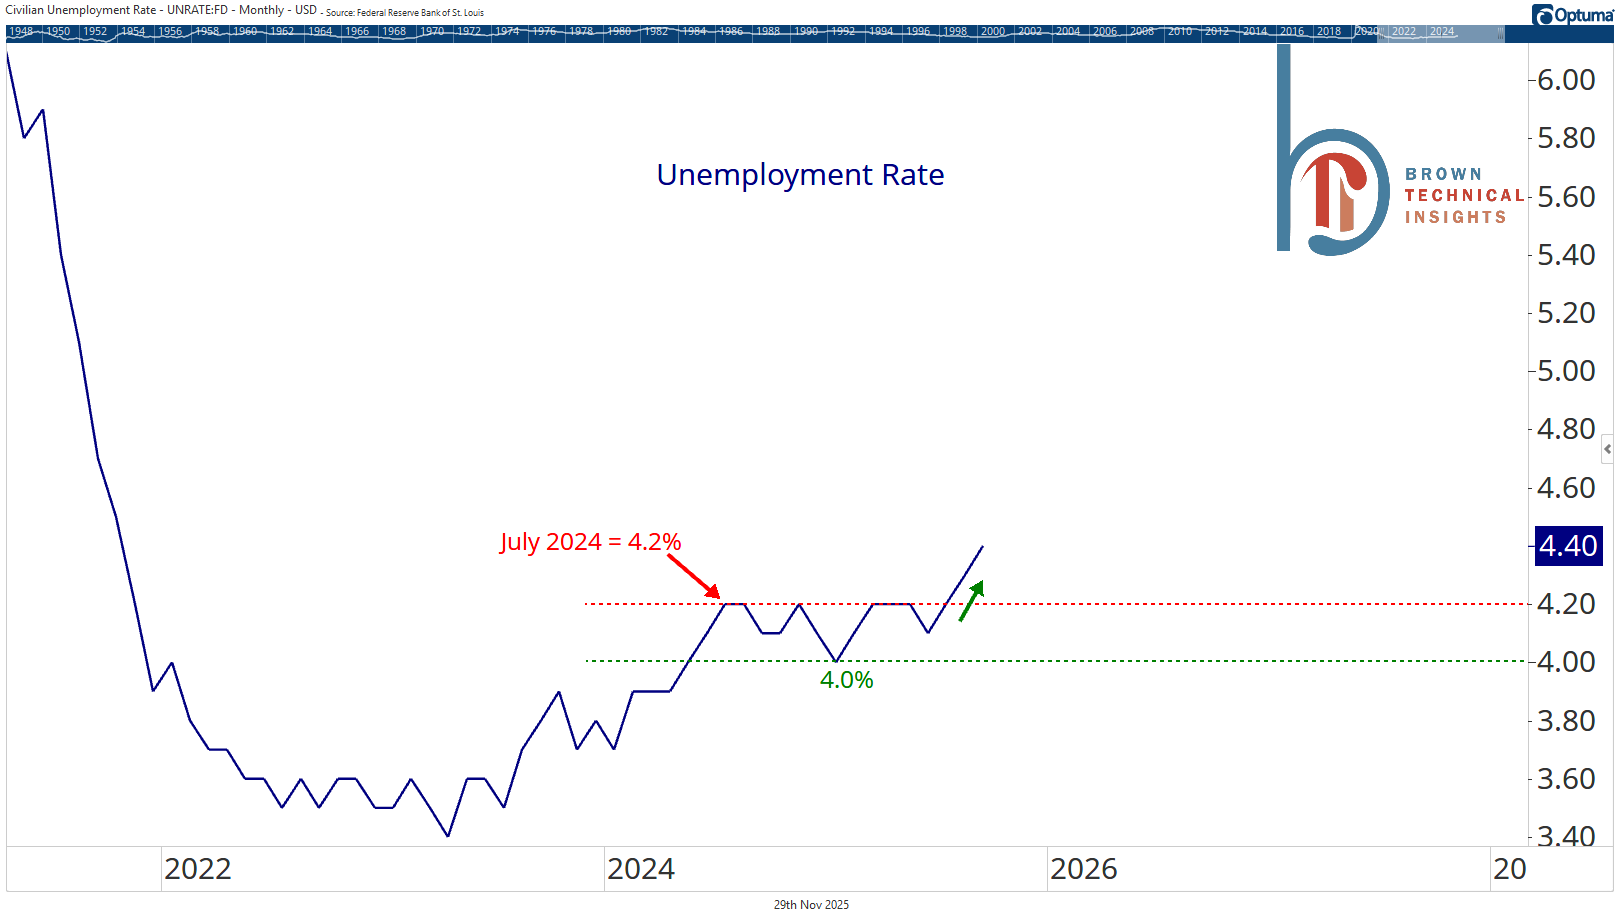
We don’t dabble too much in the economic fundamentals here, but I know a thing or two about charts. Once unemployment bottoms, the lowest the rate has ever gone to before rolling over has been 6.1% 👇
Meanwhile, inflation expectations and oil have rolled over
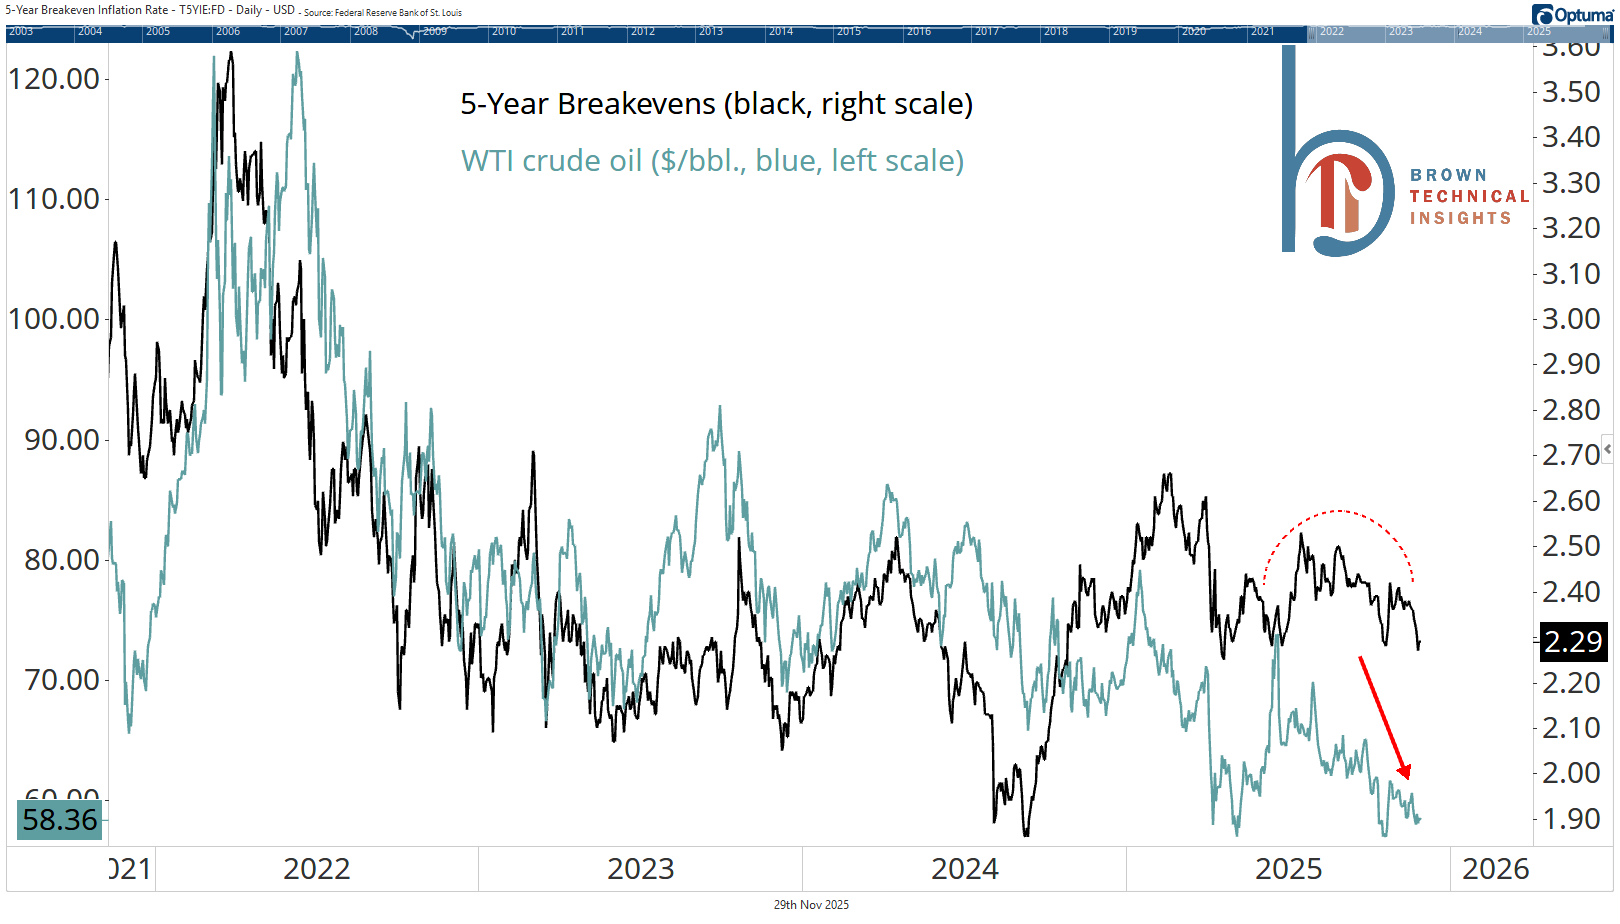
5-year breakevens hit their lowest level since April last week and sit at just 2.29%.
The market is leading the Fed funds rate lower
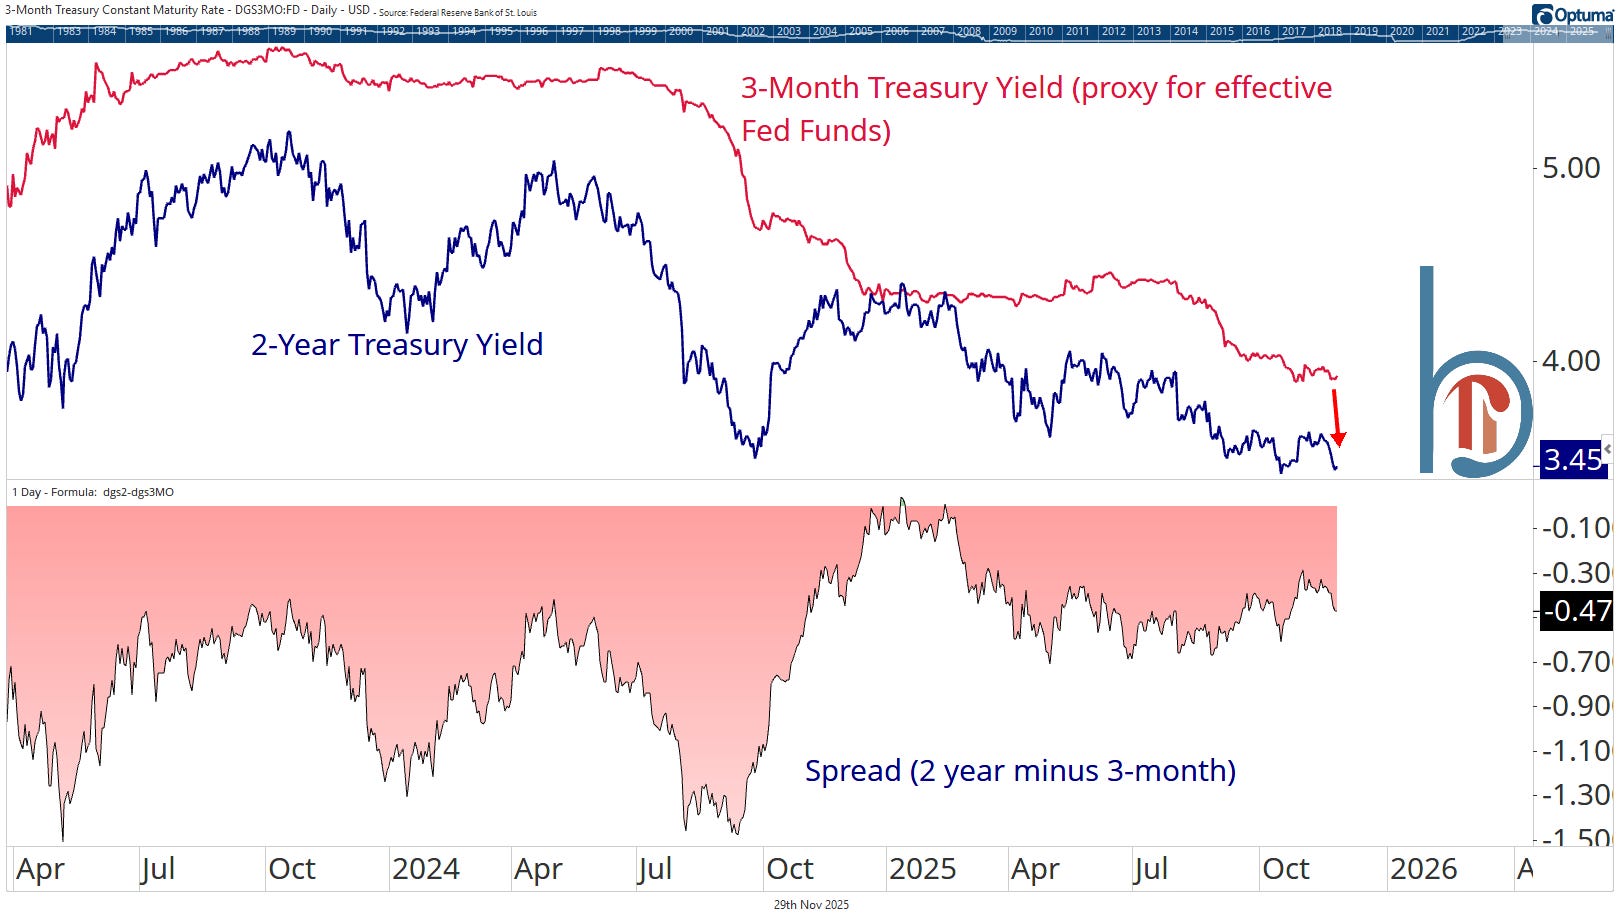
The 2-year yield is approximately 50 bps below the effective Fed funds rate and clearly trending lower. It ended last week just 4 basis points above its October lows, which were the lowest level since August 2022.
Long-term bonds responding to support
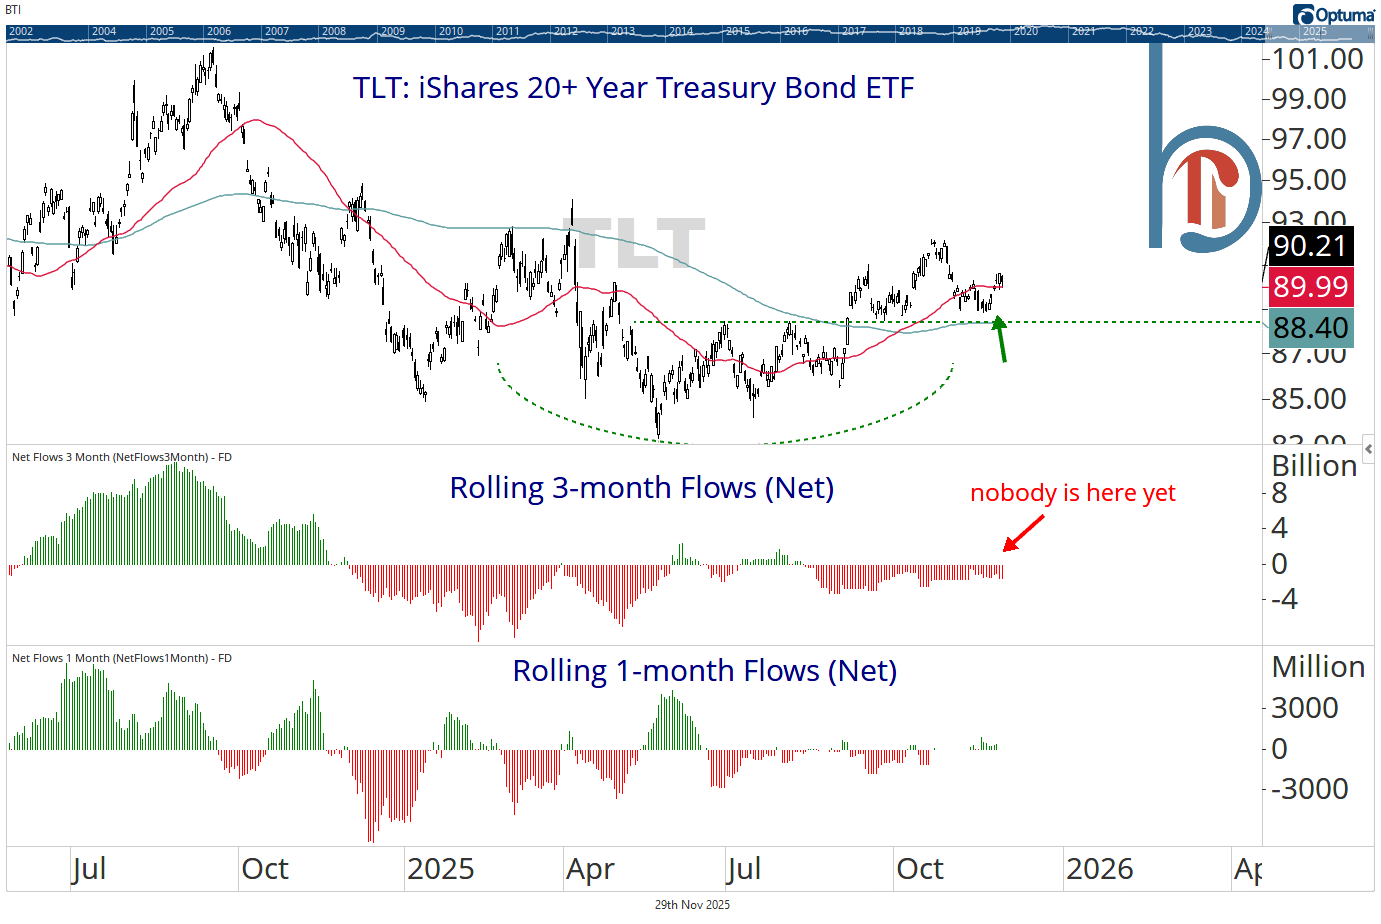
This means yields are holding below resistance. Overweight duration is the right move here. And focus on Treasuries because credit spreads are too low and have more disproportionate risk to the upside.
Why does what they’re supposed to do matter?
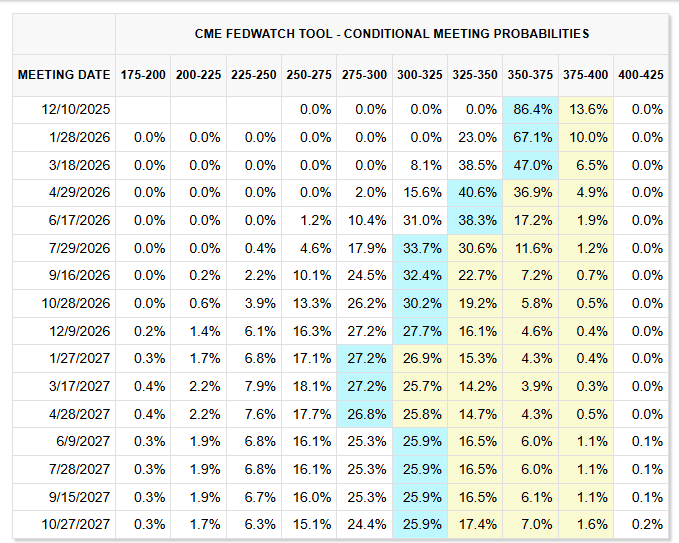
Because Fed fund futures show they’re likely on hold through the first quarter of next year.
Implications of a breakout in the dollar
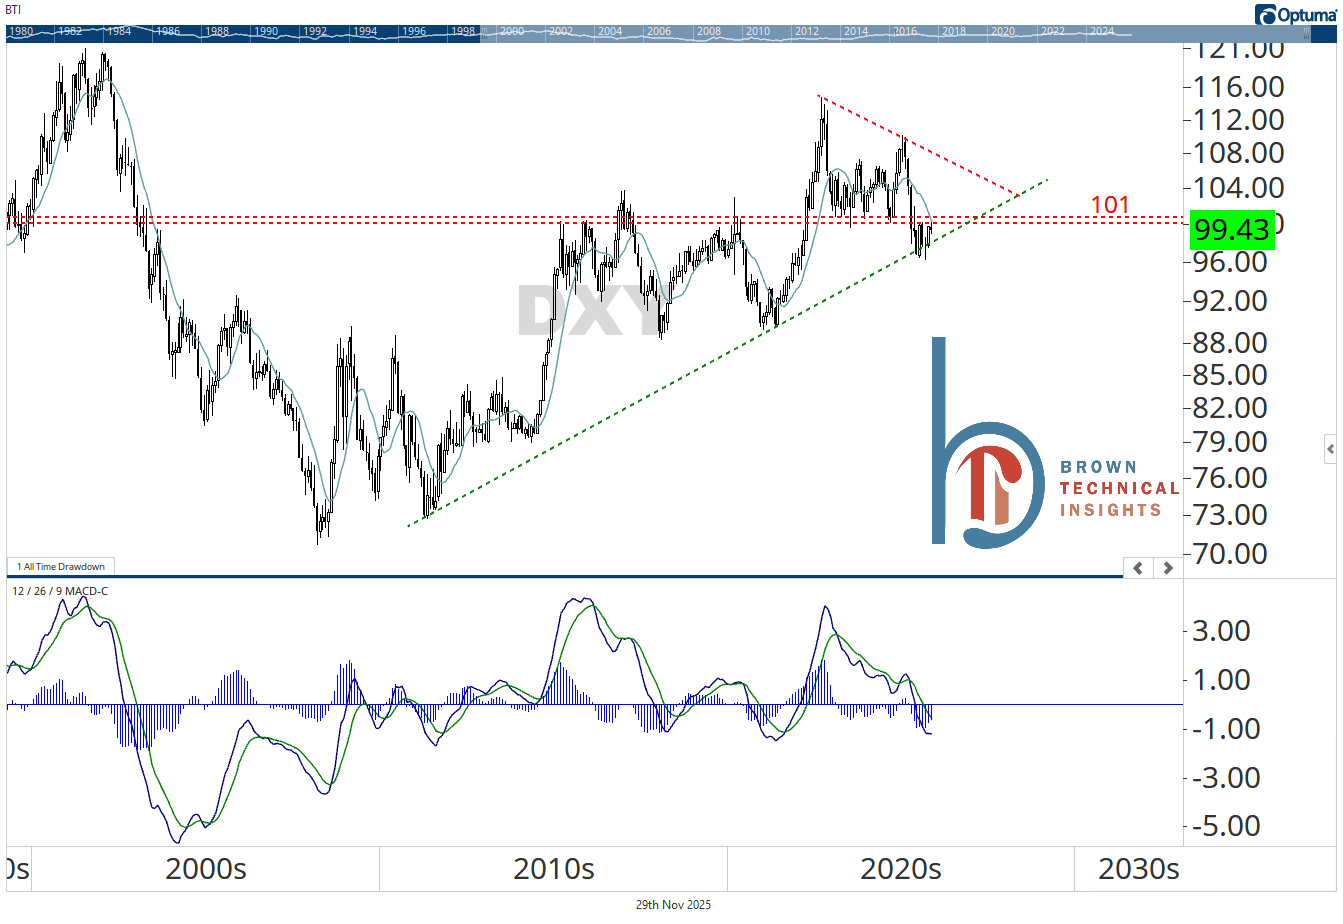
Dollar holds support, but still struggling with resistance near 101
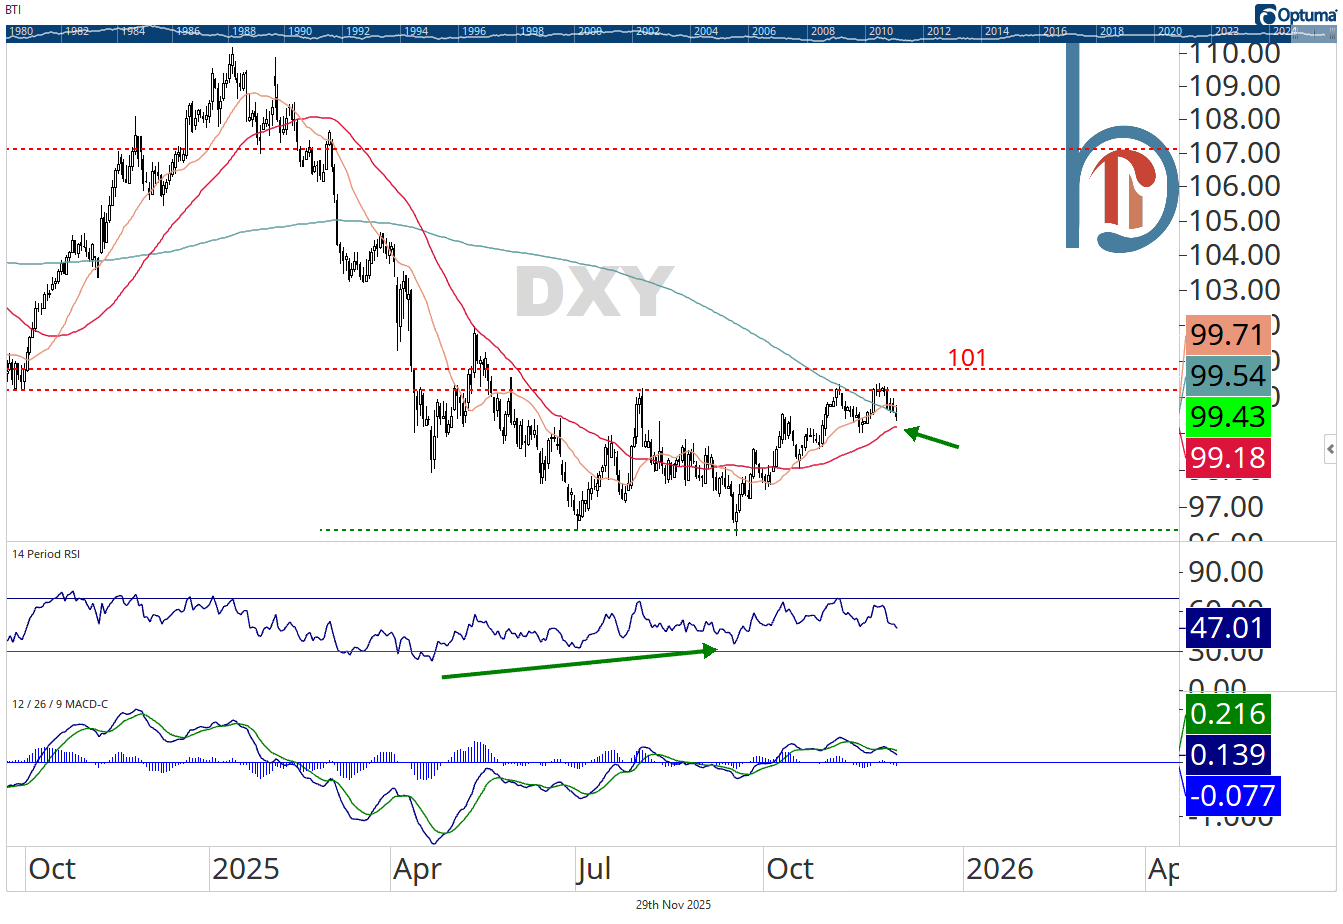
DXY held support while we were away, but failed again at 101. Ultimately, which direction this 5-point box (96-101) resolves is hugely important to the long-term chart 👇
Don’t bet on international outperformance if the dollar breaks out higher
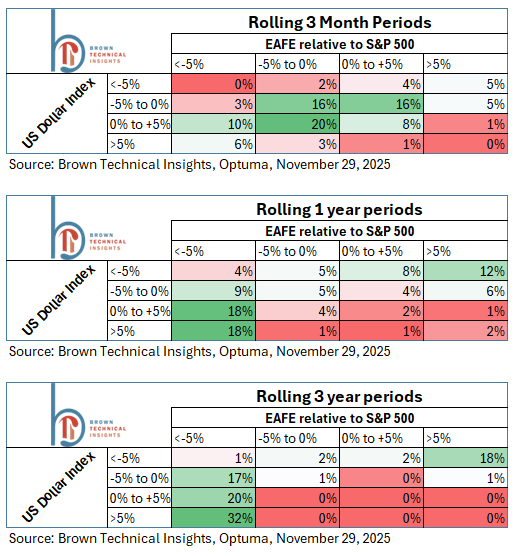
For some background, the study above was in response to a Mailtime question, but I wanted to save it for this report. Essentially, the question was: Are there any time periods where the dollar has strengthened and international equities have outperformed?
And the short answer is no.
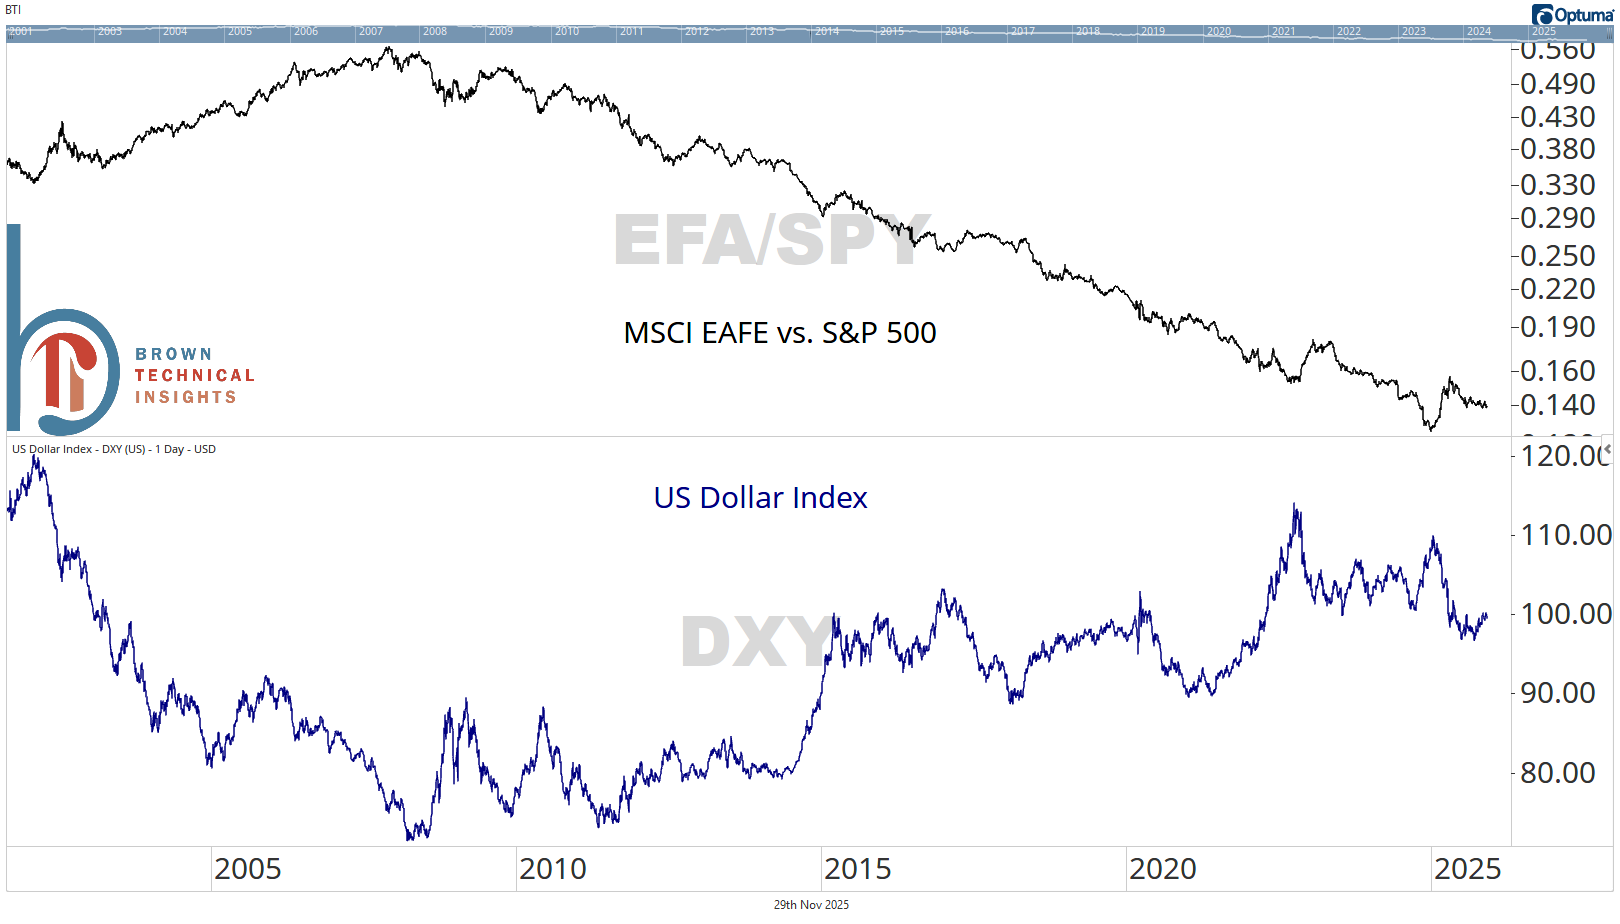
The inverse correlation is clear across all time periods and the times where the dollar is up, and foreign stocks have outperformed (lower right) is bright red in all three graphs.
A few important notes and takeaways:
The above study was run using EFA, the iShares MSCI EAFE ETF, which is the oldest diversified international stock ETF (2001 inception)
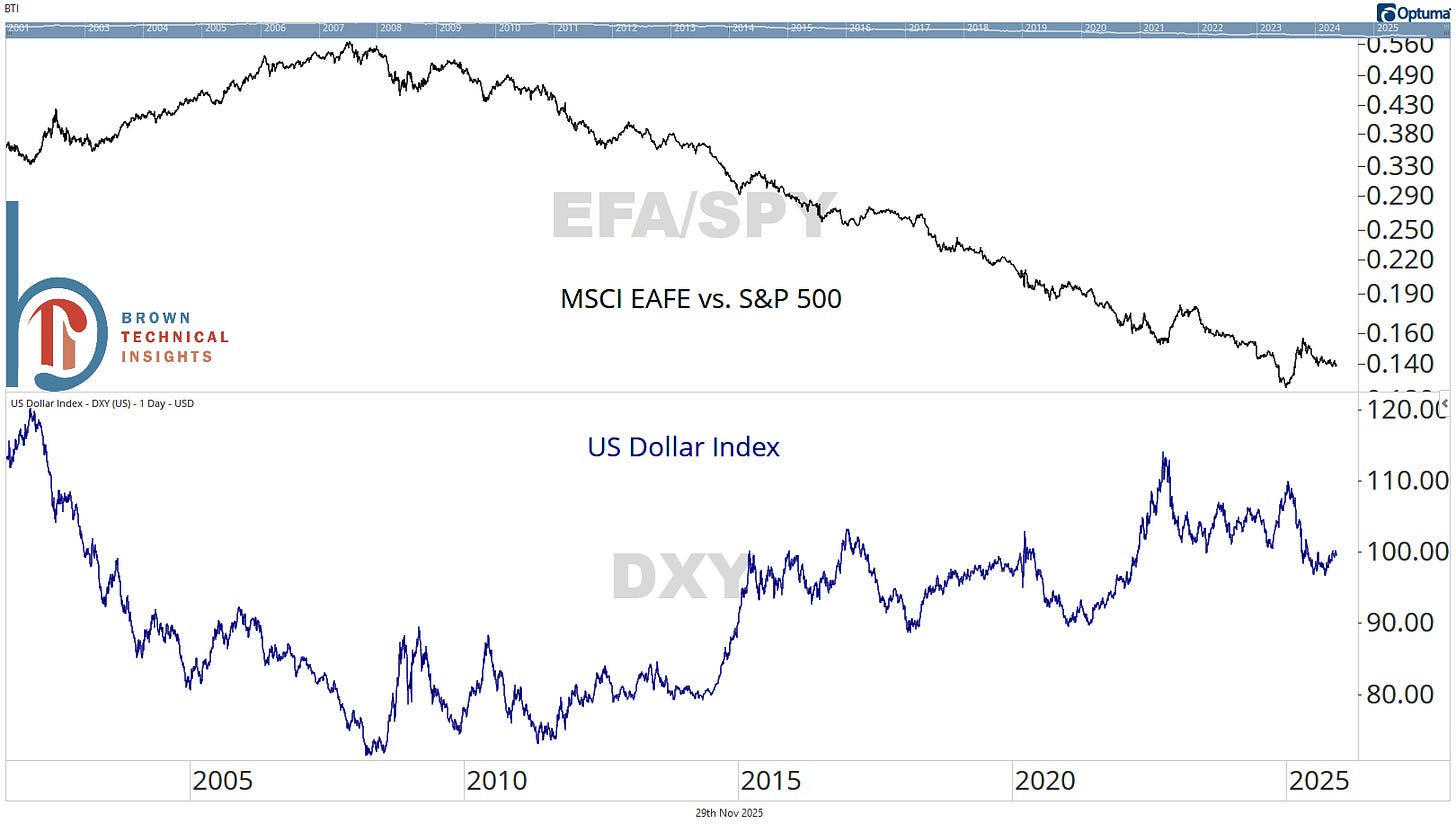
The results are skewed toward US outperformance, and on a rolling 3-year basis, EFA hasn’t outperformed since November 2009
The investment takeaway is that a weaker dollar has been a requirement for foreign stock outperformance, but a weaker dollar does not guarantee foreign stock outperformance
It rounds to 0%, but there is exactly 1 single day (in January 2007) on a rolling three-year basis where the dollar was positive at all (+0.2%) and international equities outperformed over the same time period
Coming Tomorrow: The Trade Report
December updates to the Ultra-Growth and Balanced ETF portfolios.
November recap
The S&P 500 rallies, extends monthly winning streak to 7
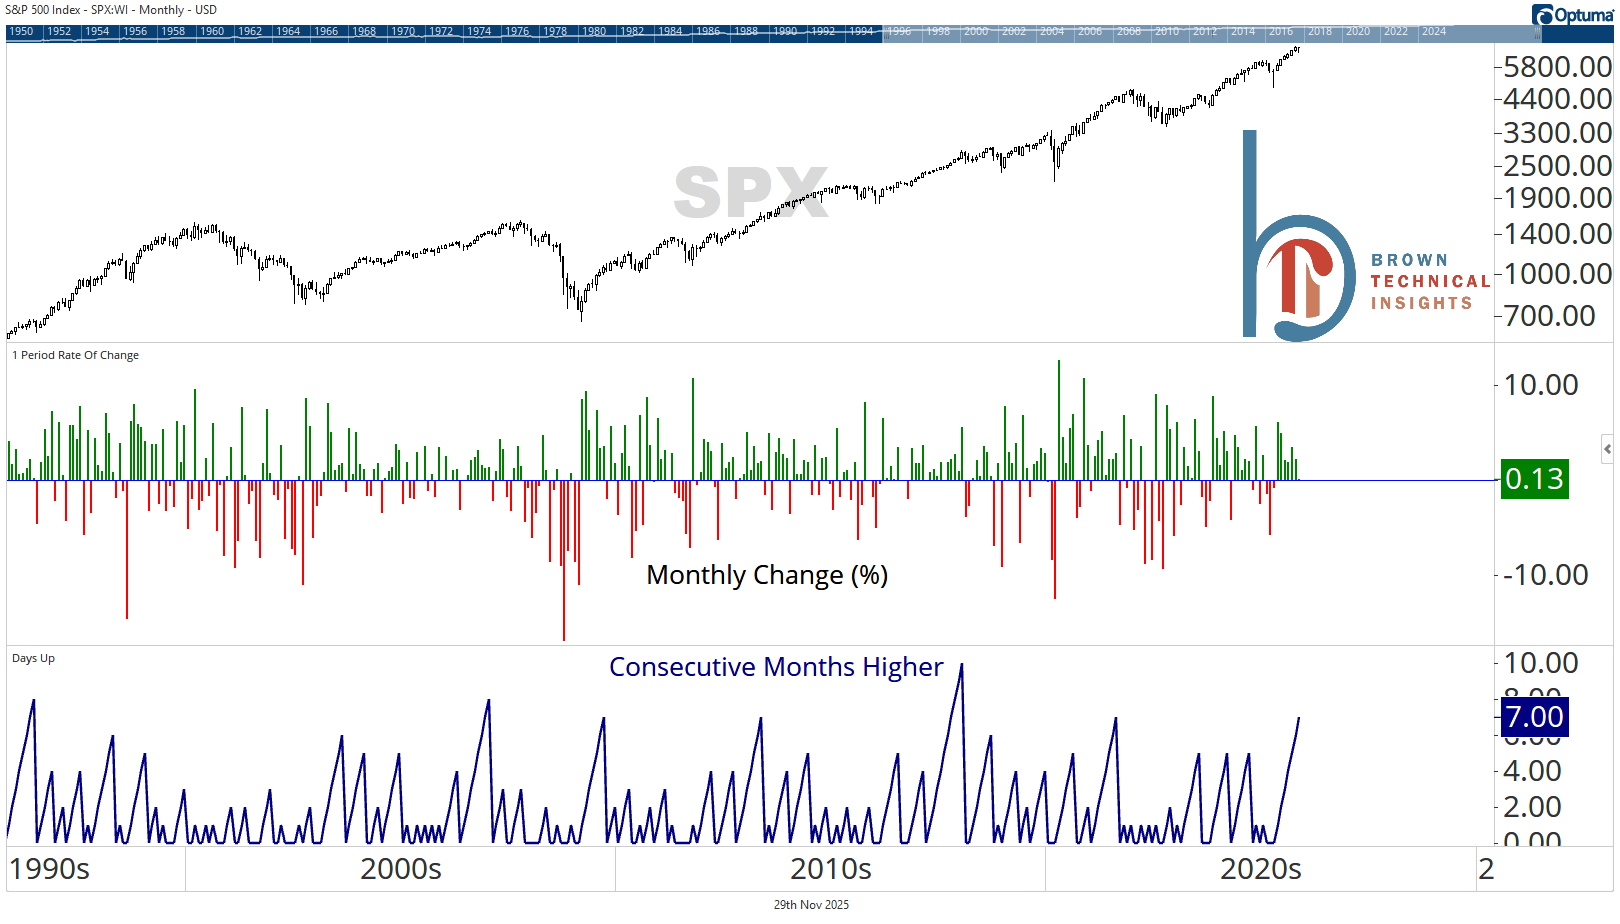
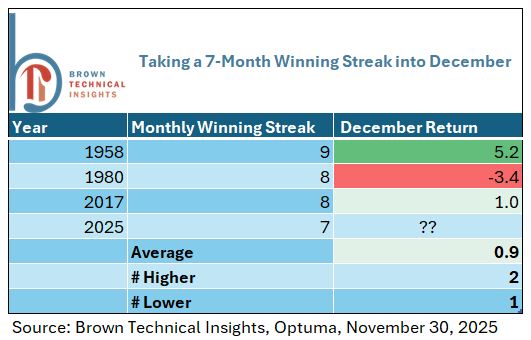
The S&P 500 miraculously ended November higher, gaining 0.13%. That saved and extended the index’s monthly winning streak to 7, the longest since one that ended in August 2021. If we can gain ground in December, it would be the longest monthly winning streak since 10 from April 2017 to January 2018.
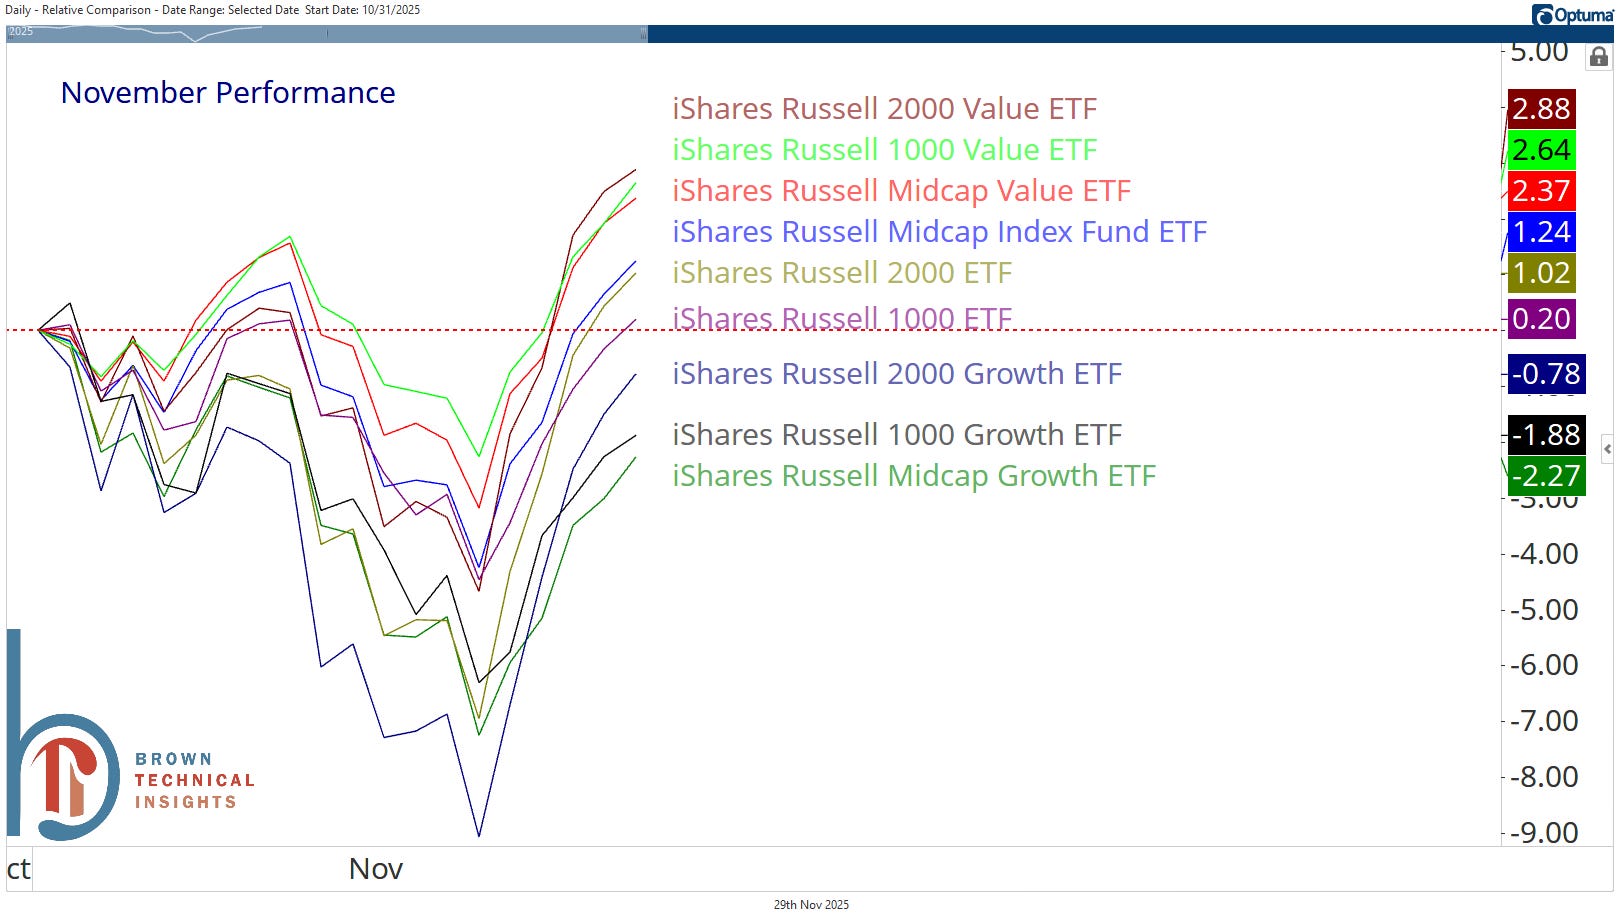
Value leads the way, growth indexes not quite able to recover losses
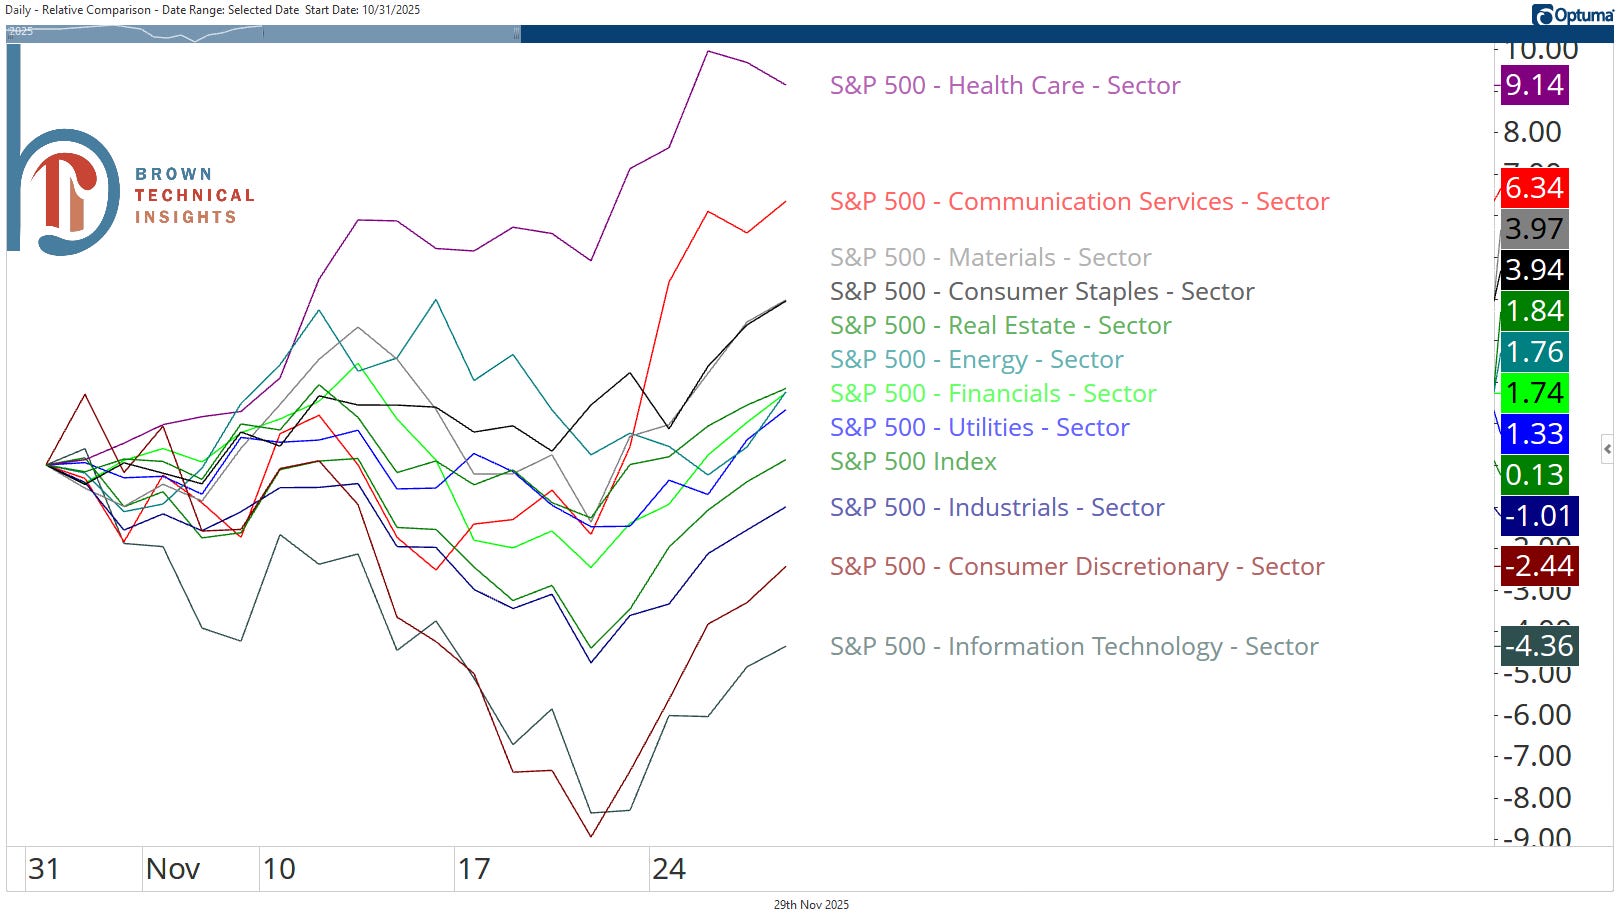
Healthcare the top-performing sector while tech lags
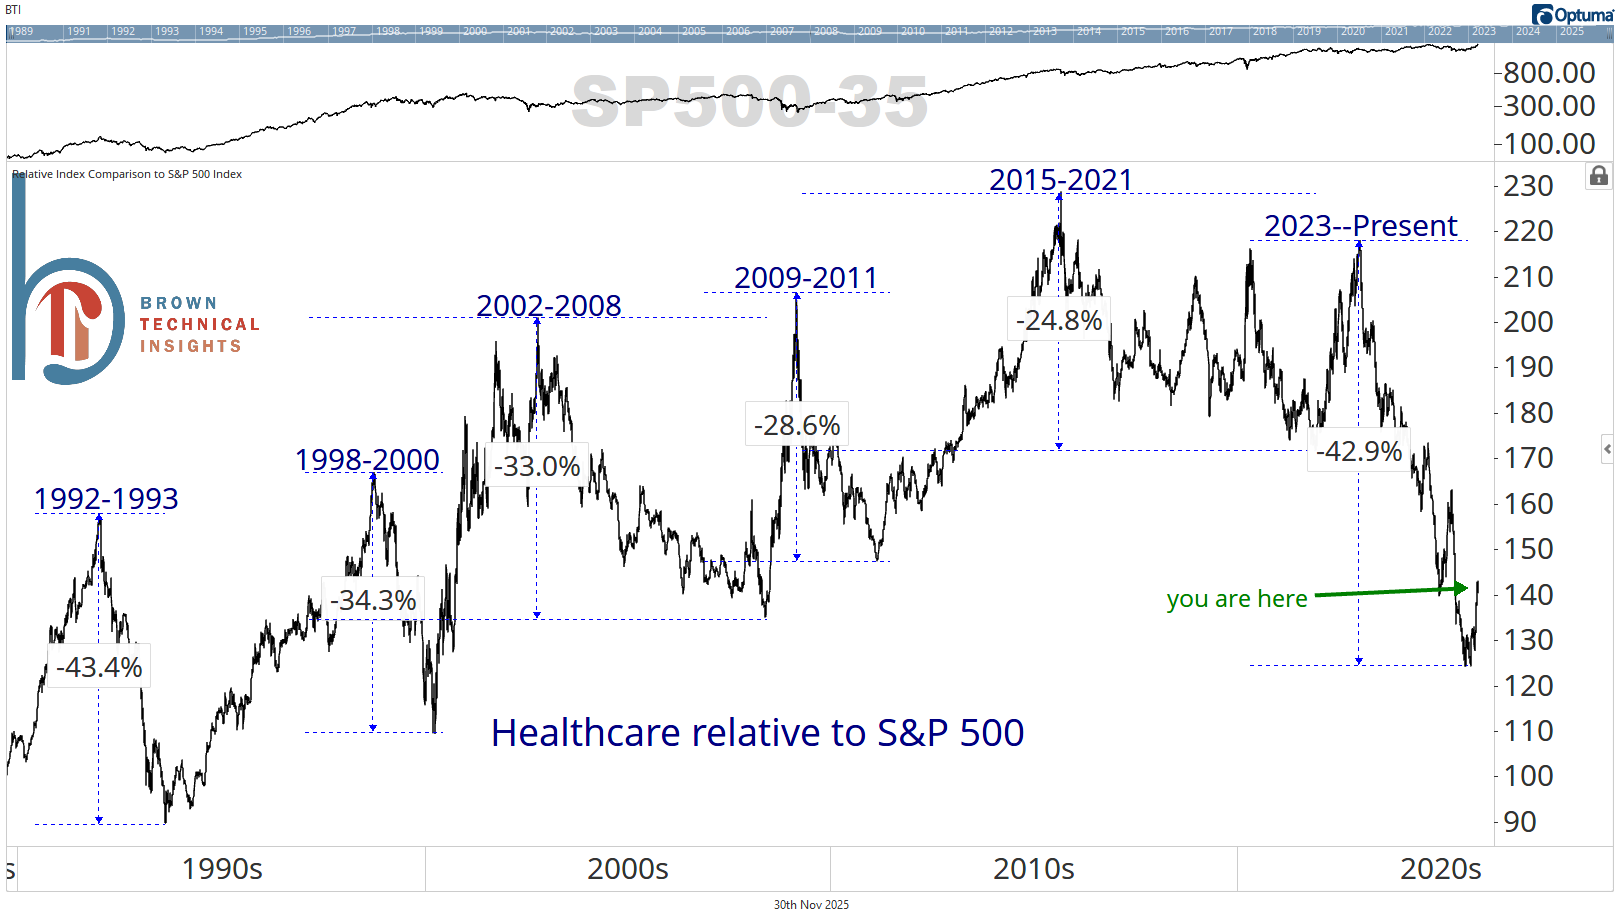
Long-term bullish, short-term be careful chasing healthcare
Still plenty of runway in the long-term healthcare relative performance chart
But we’re at resistance
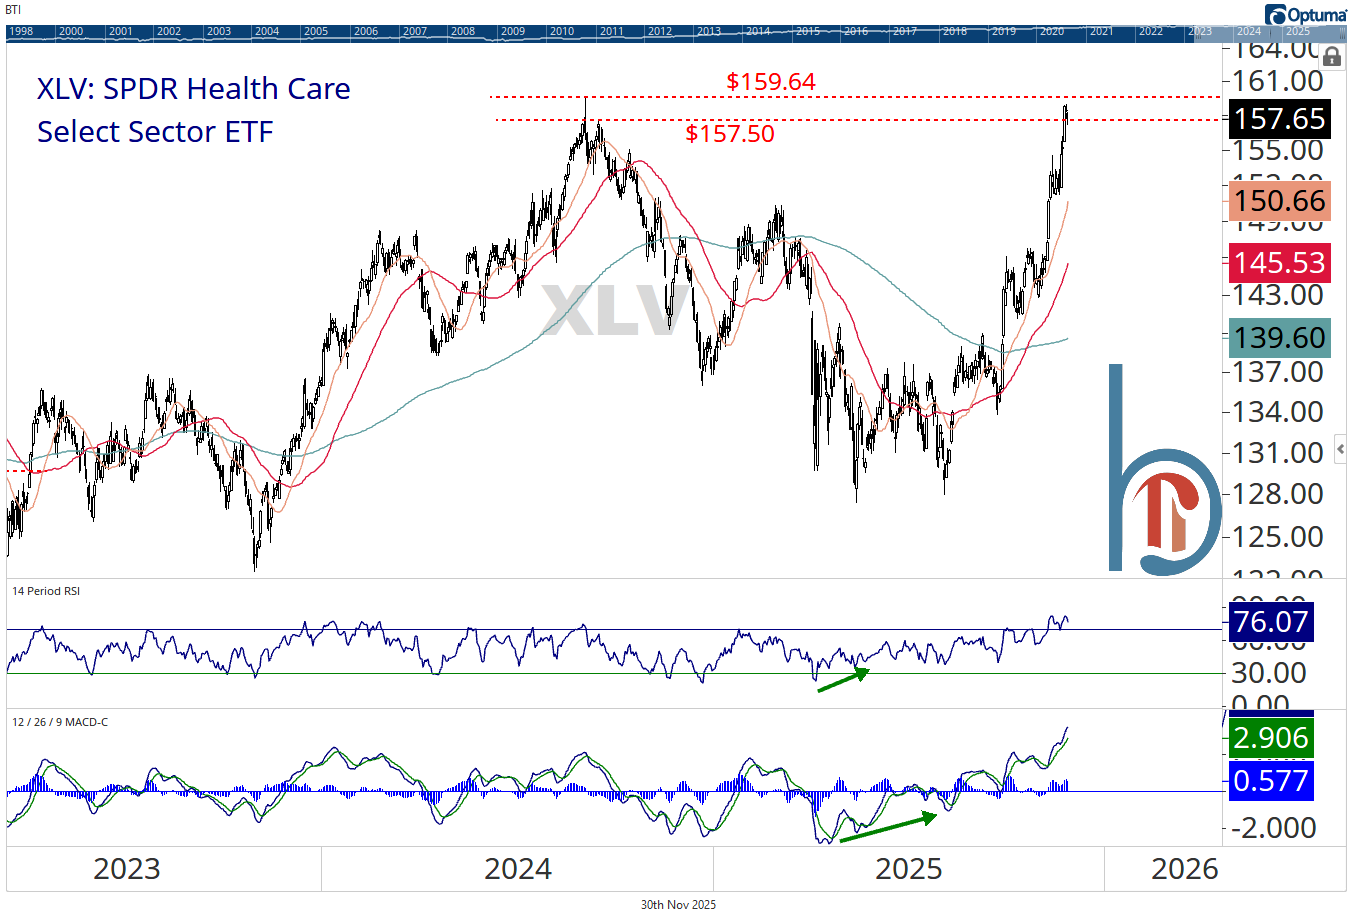
Extremely overbought
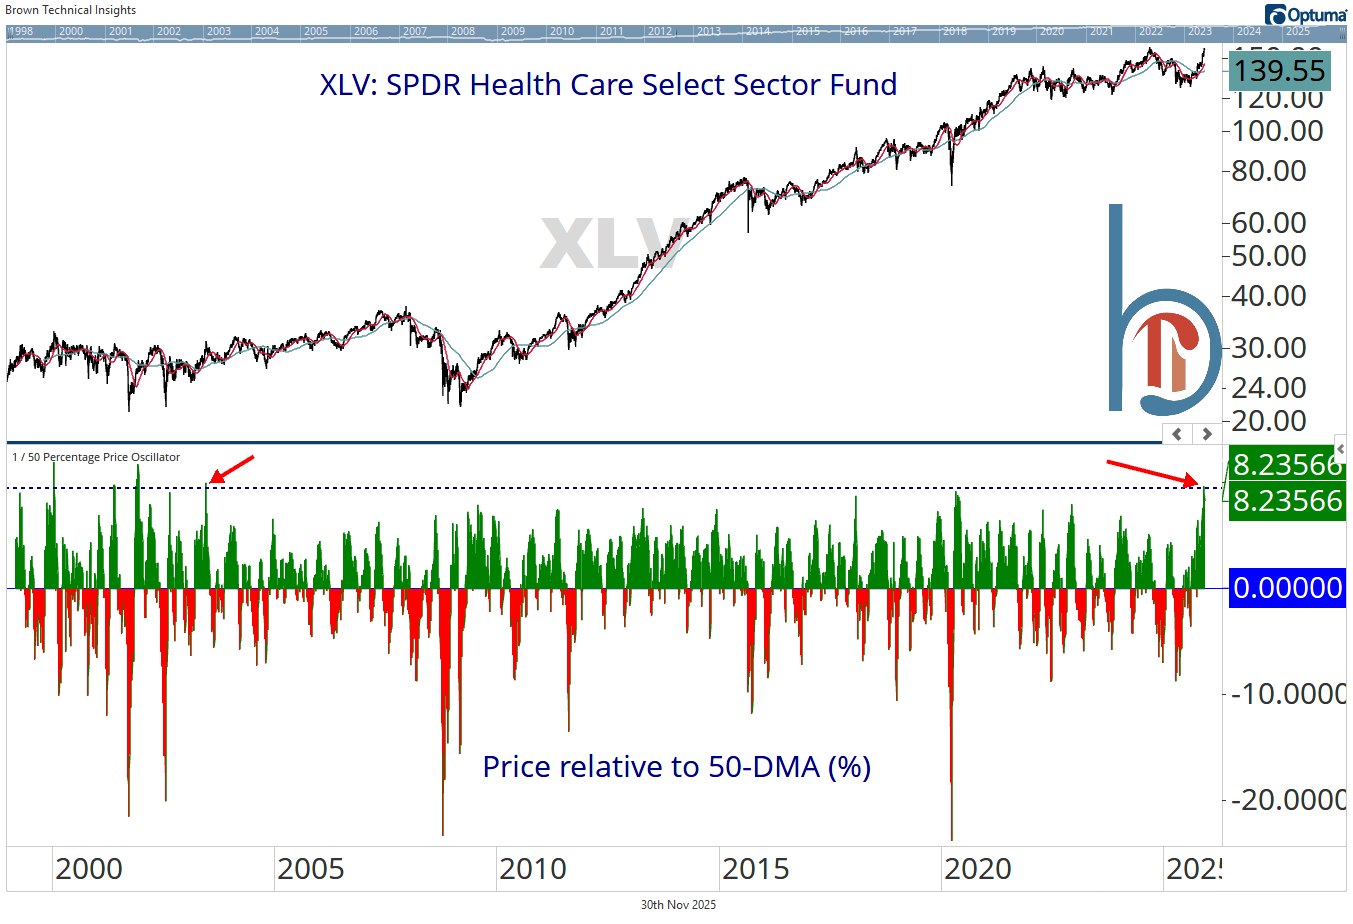
Most stretched above the 50-DMA since 2003.
And flows suggest sentiment has now gotten too aggressive
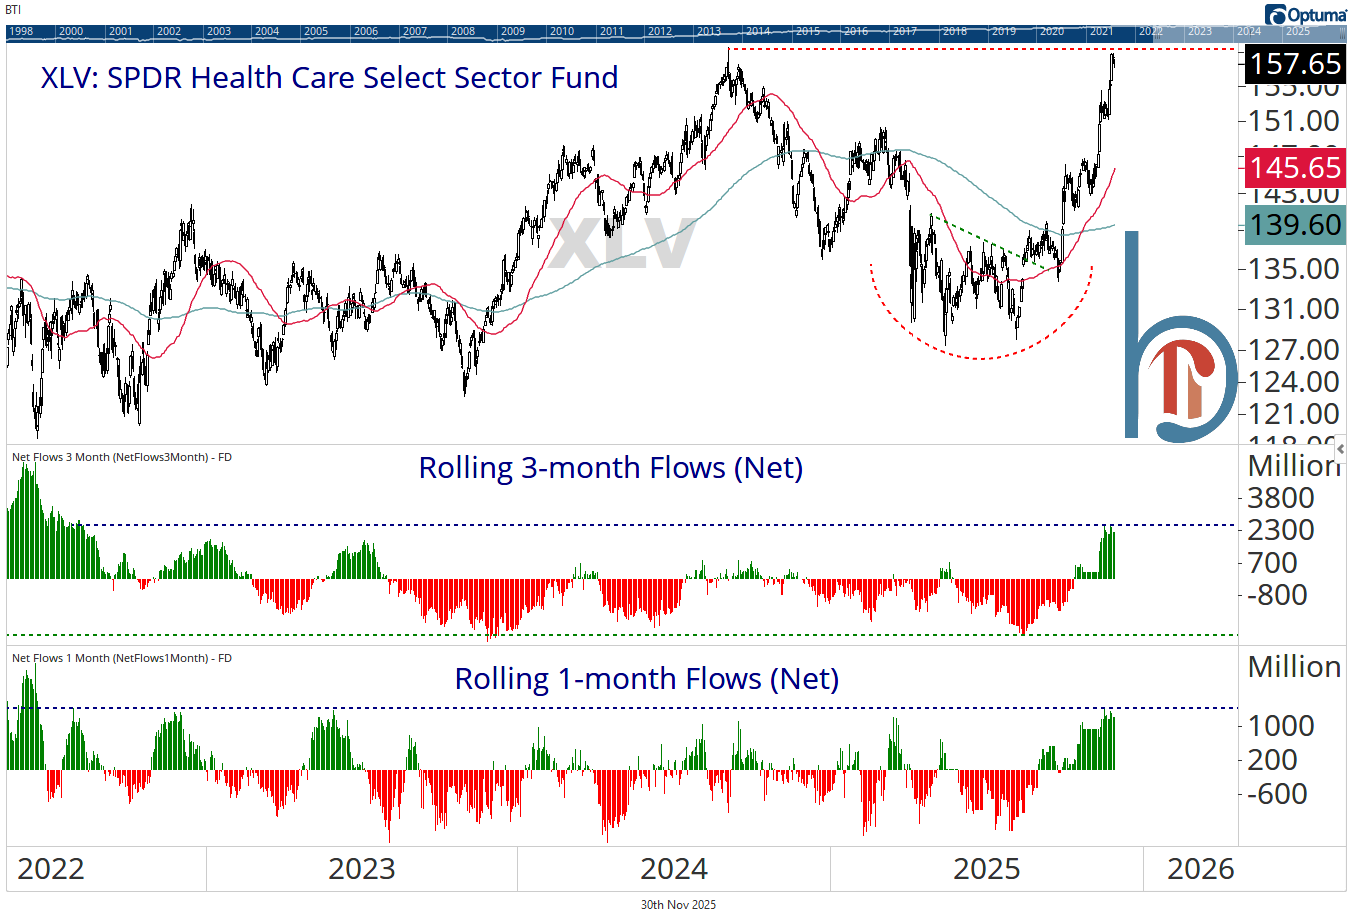
Most one and three-month inflows into XLV since 2022.
Biotech flows have gone parabolic
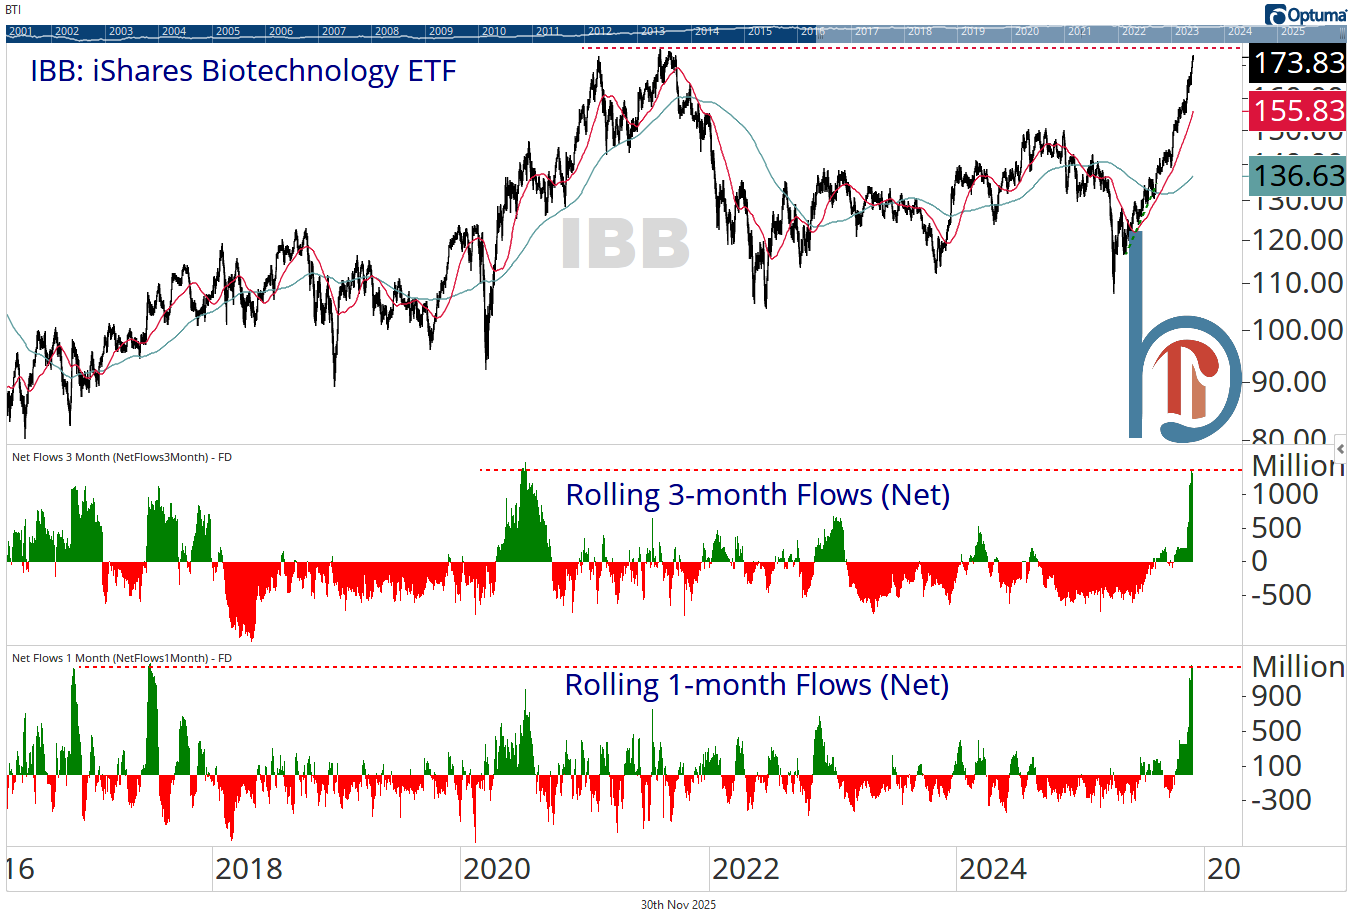
IBB is also at a logical place for a pause. This ETF has been in our models since the beginning of August, but will be under review for tomorrow’s trades.
December seasonality and studies
December historically strong, weaker recently and in Year 1 of the Presidential Cycle
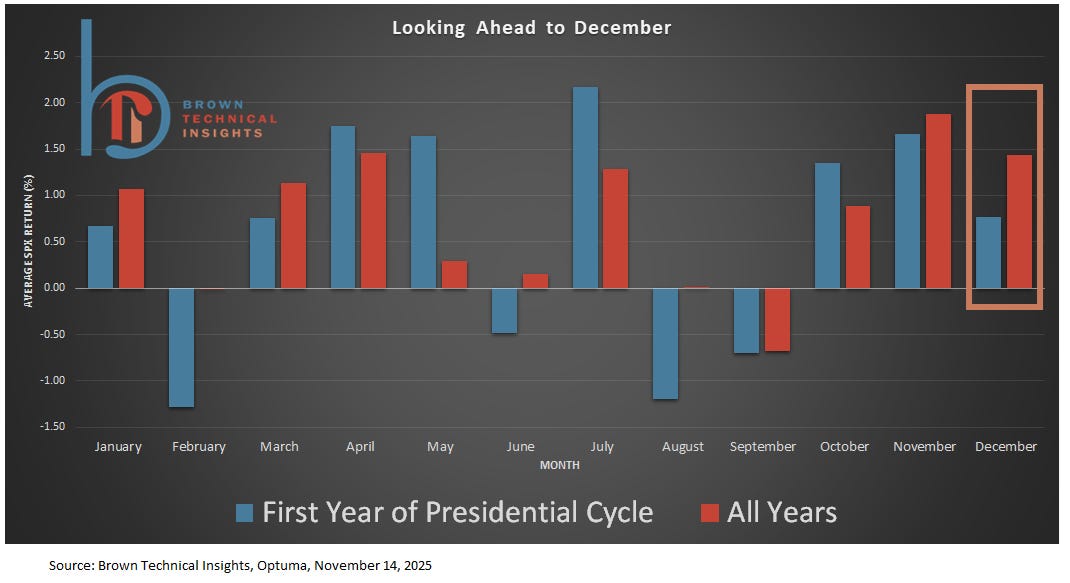
December is a bullish month in general, with a 1.4% gain on average since 1950, though that drops to +0.76% in Year 1 of the Presidential Cycle. More recently, December has been mixed, falling in 3 out of the past 8 years and averaging a 0.3% decline over that time.
Just the 4th time we’ve taken a 7-month winning streak into December
Up at least 15% through November
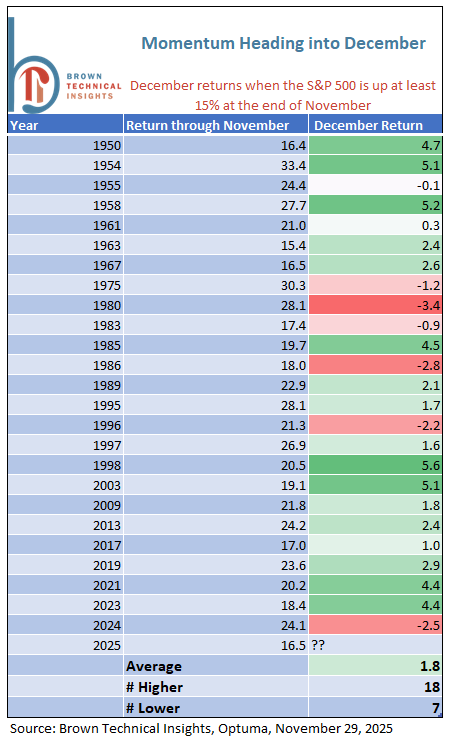
The S&P 500 is up 16.5% YTD. Above are the 25 times when the index has been up at least 15% through the end of November. Bulls couldn’t deliver last year, but December has gained in 9 of the past 10 scenarios and delivered an average 1.8% gain since 1950.
The S&P 500 broke the 50-DMA two weeks ago today
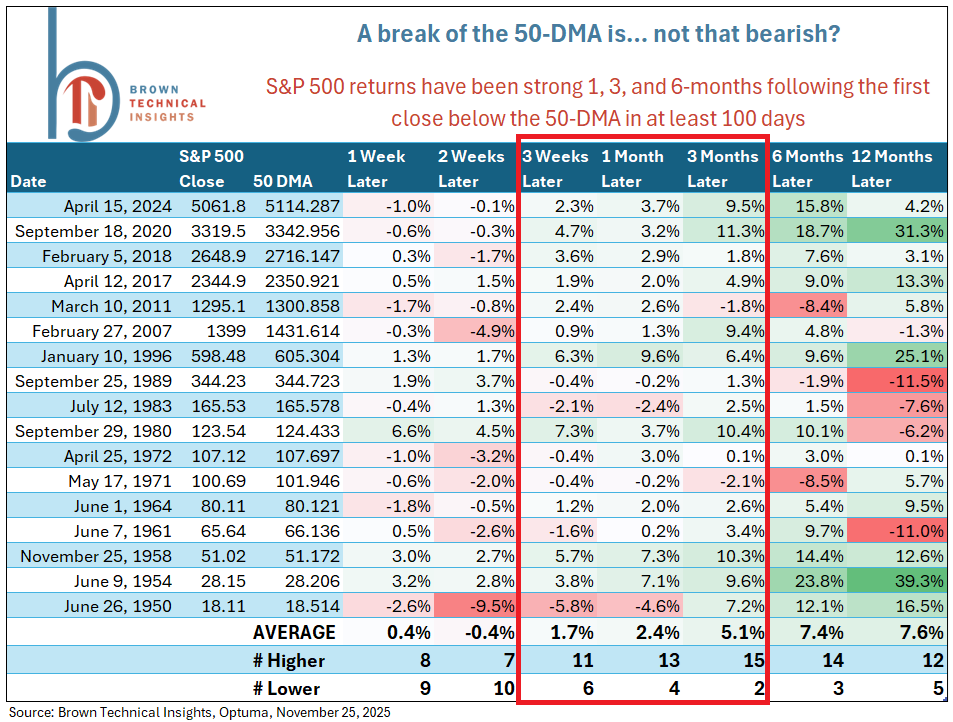
Historically, now is when things begin to stabilize, though of course, we turned around much quicker this time, with the S&P putting in its closing low just three days after the 50-day break (Thursday, November 20) and its intraday low one day after that.
Of the seven prior times the index was positive two weeks after the 50-DMA broke, the three-month average gain was +6.5% and higher than the initial break all seven times.
Sector alpha has been hard to come by since 1990
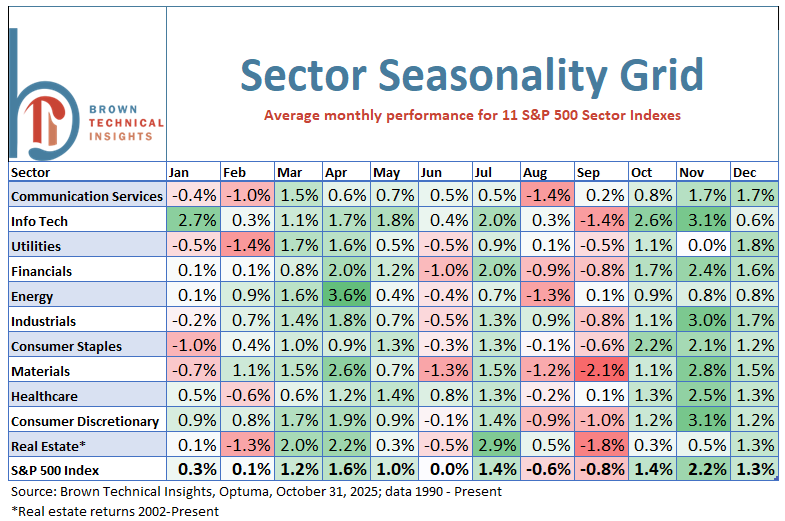
Sector returns have been strong across the board in December, with 9/11 sectors averaging gains between 1.2%-1.9%. Only technology (+0.6%) and energy (+0.8%) have gained less than 1% on average.

Quick hits
Have to be skeptical of Bitcoin
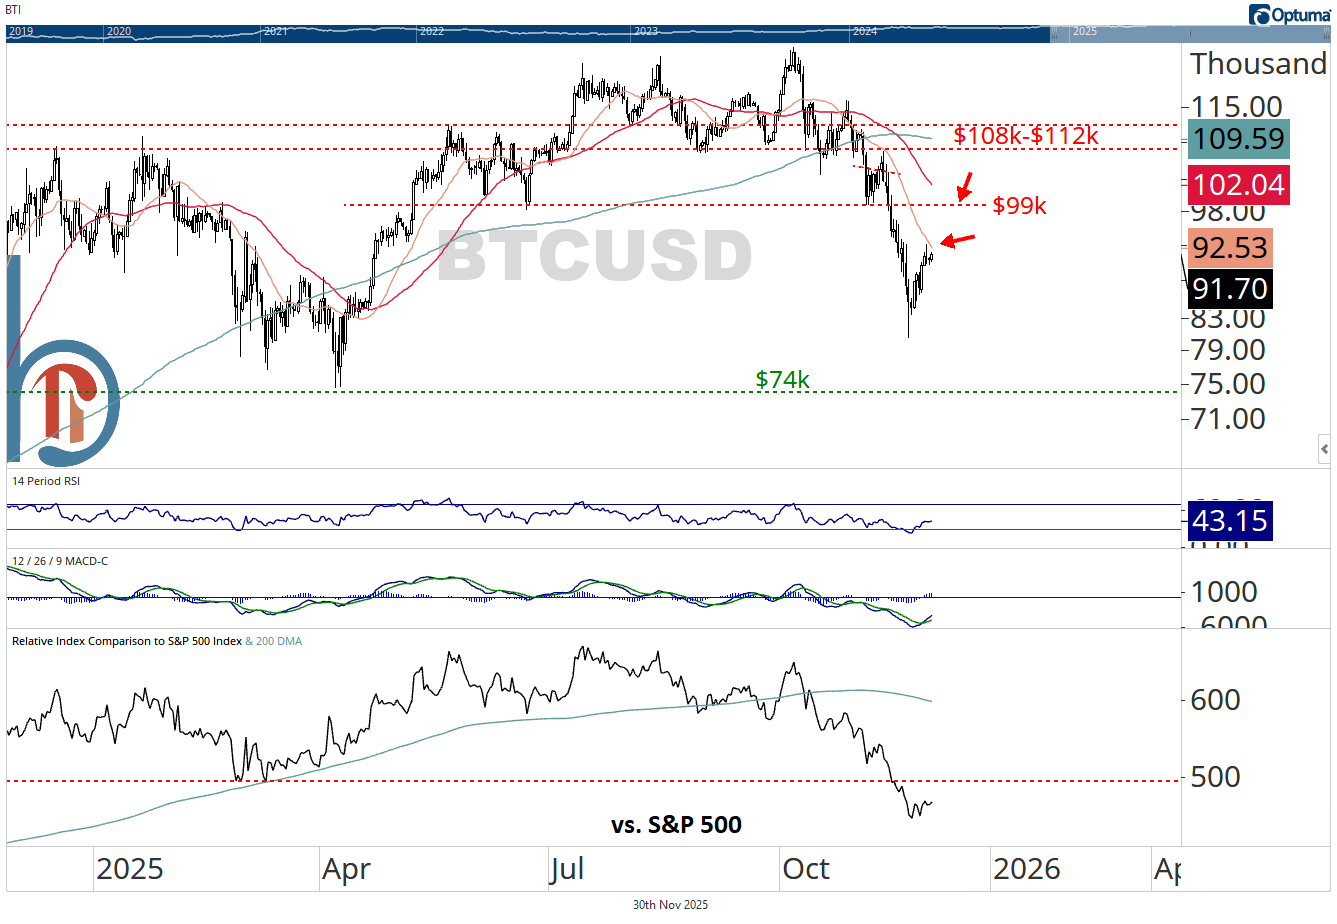
Rallies into resistance in downtrends are not to be trusted.
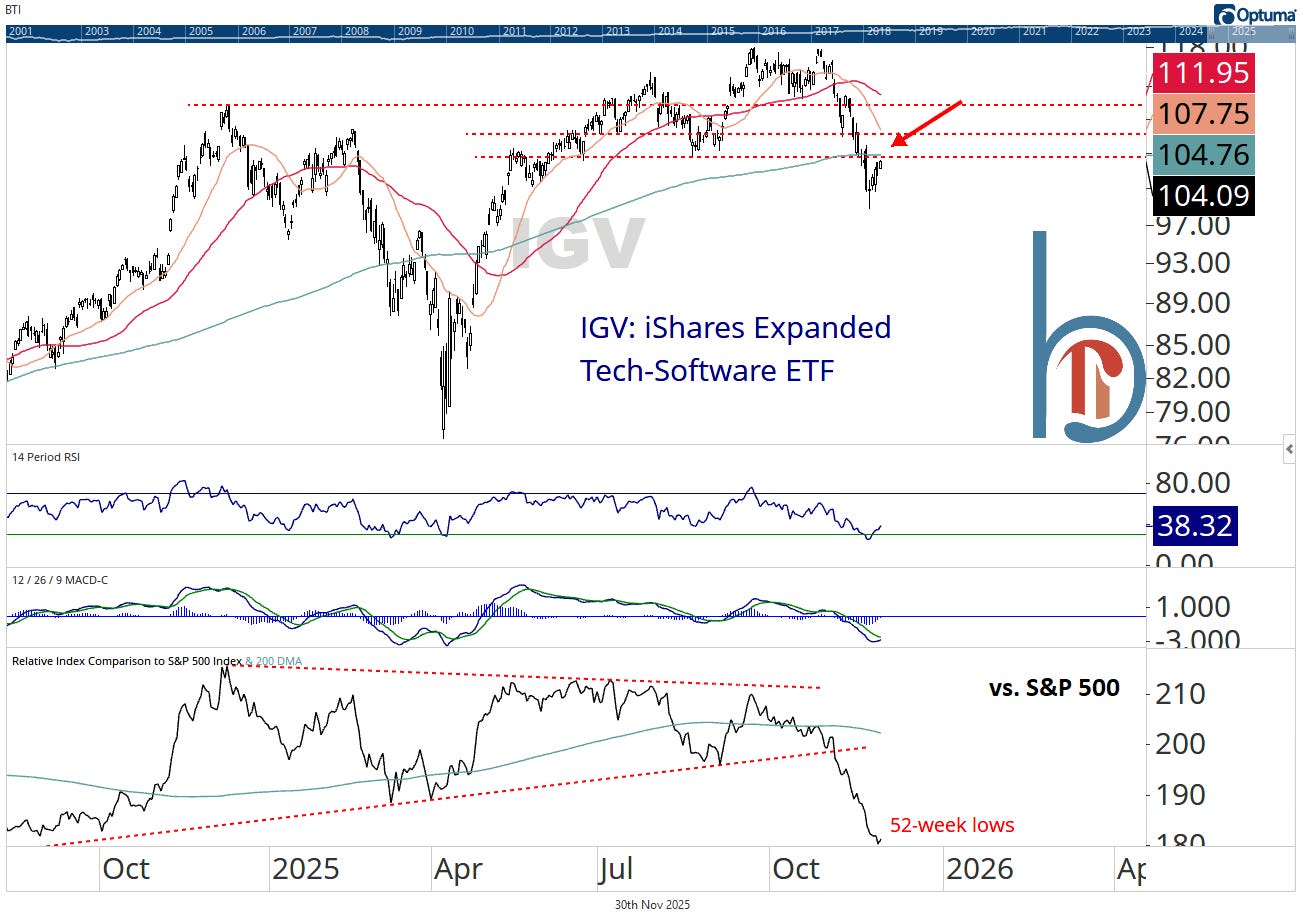
Software has a similar look and problem
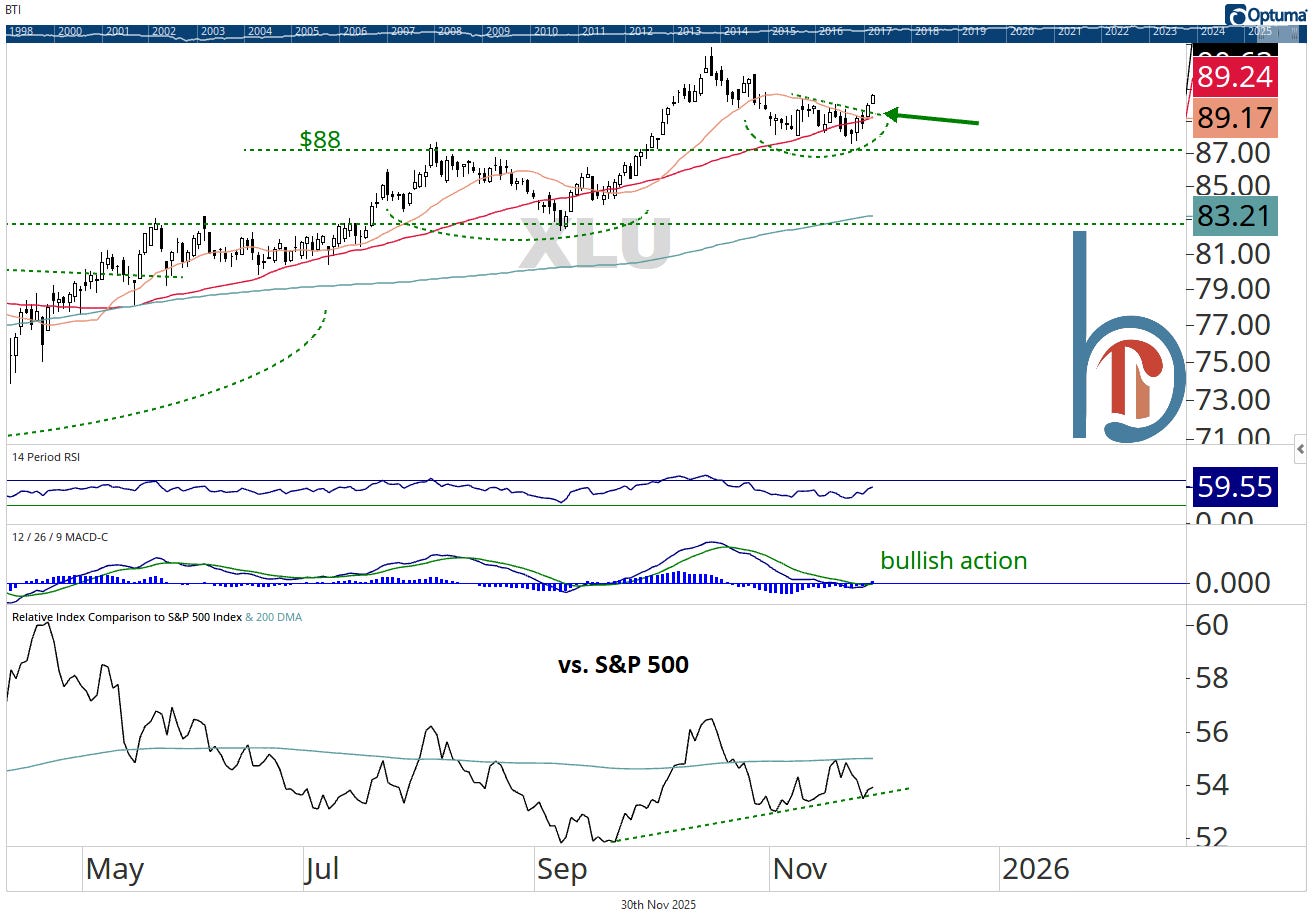
Utilities breaking out
Staples approaching a big spot
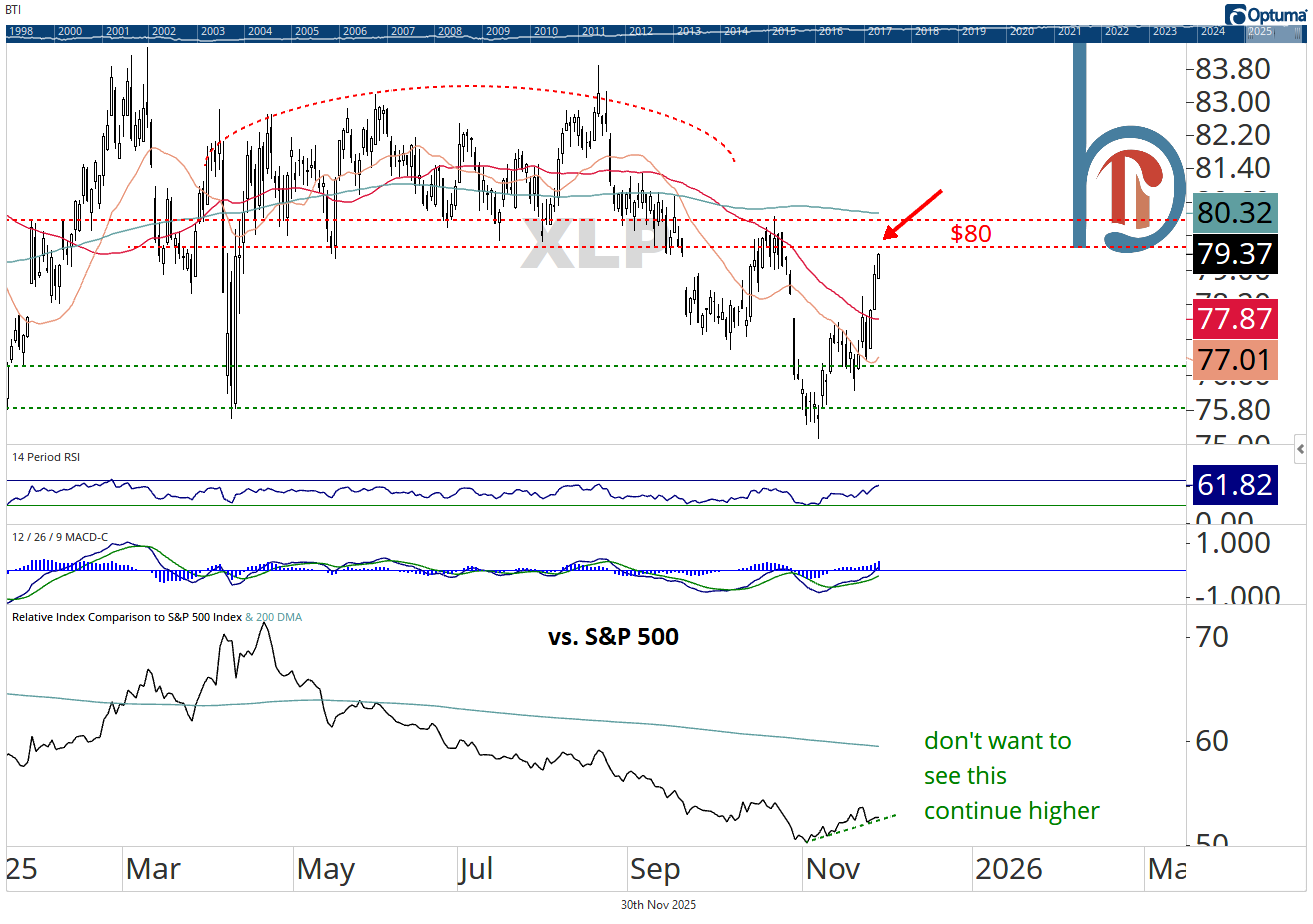
Want to respect the bounce back in gold miners
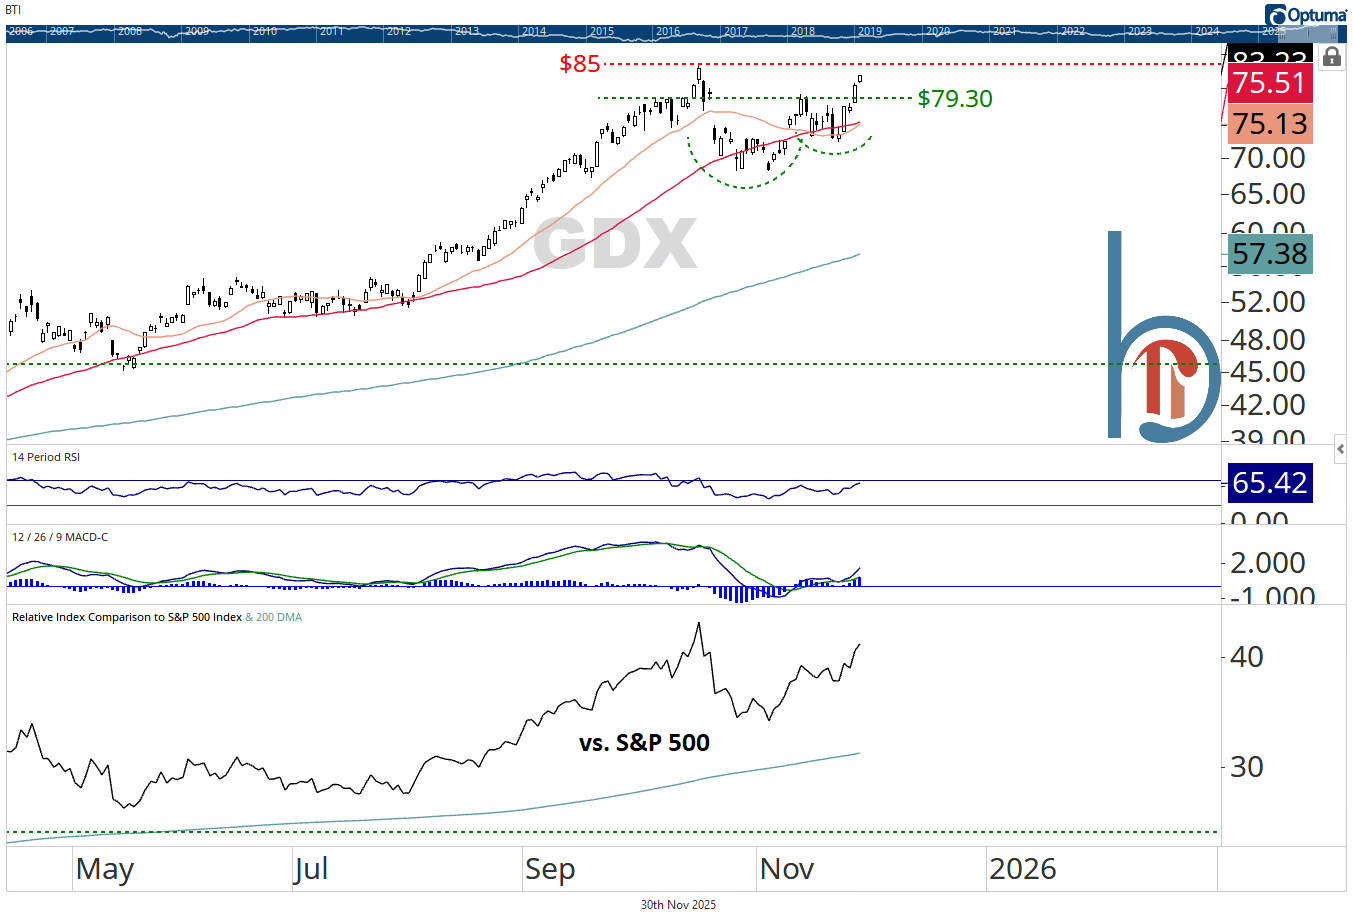
I’ve been negative here, but the move above $79 is cup-and-handle breakout. $85 is the only resistance left.
$4,230/oz. is the big level on gold
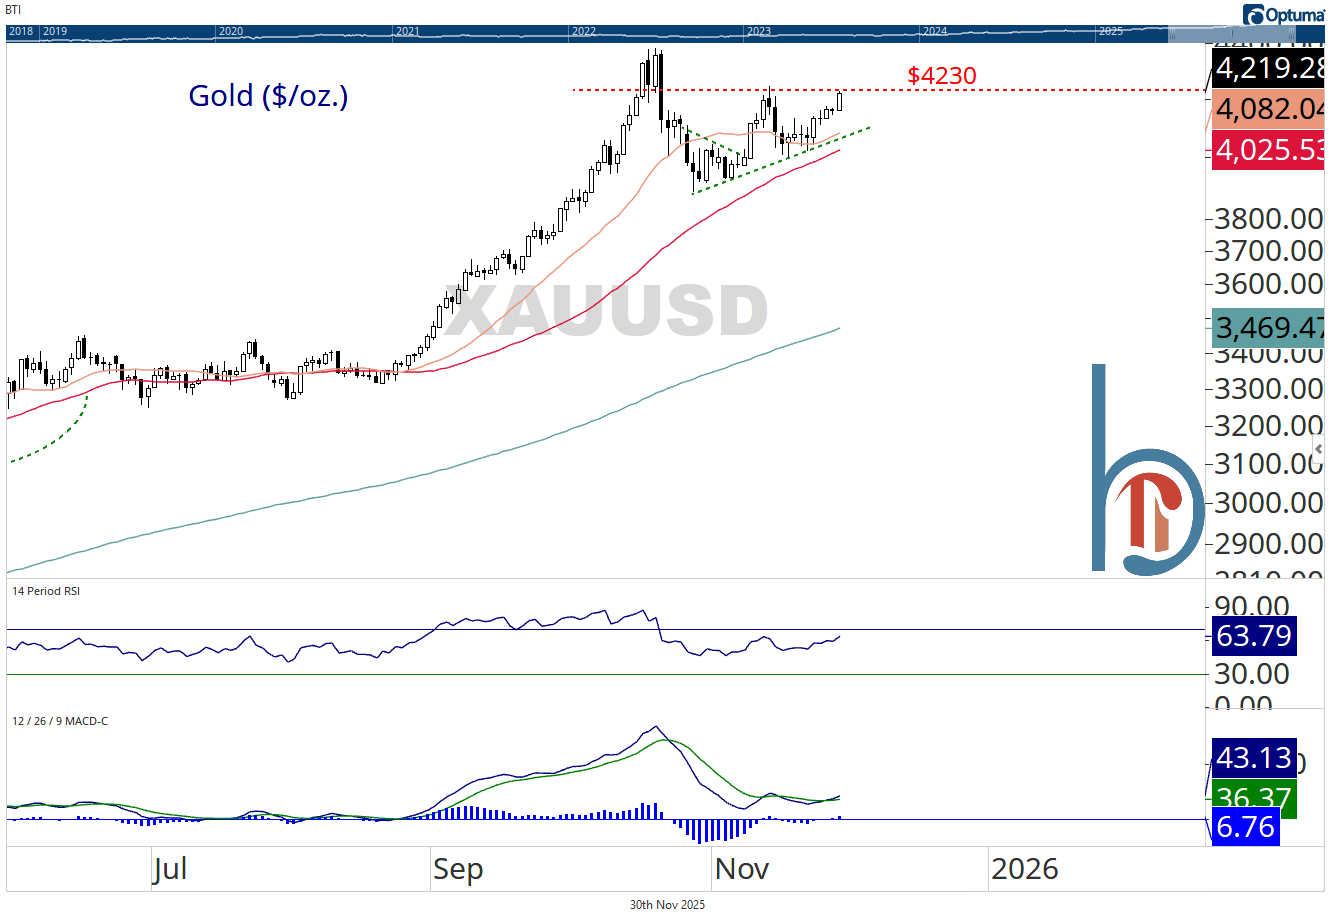
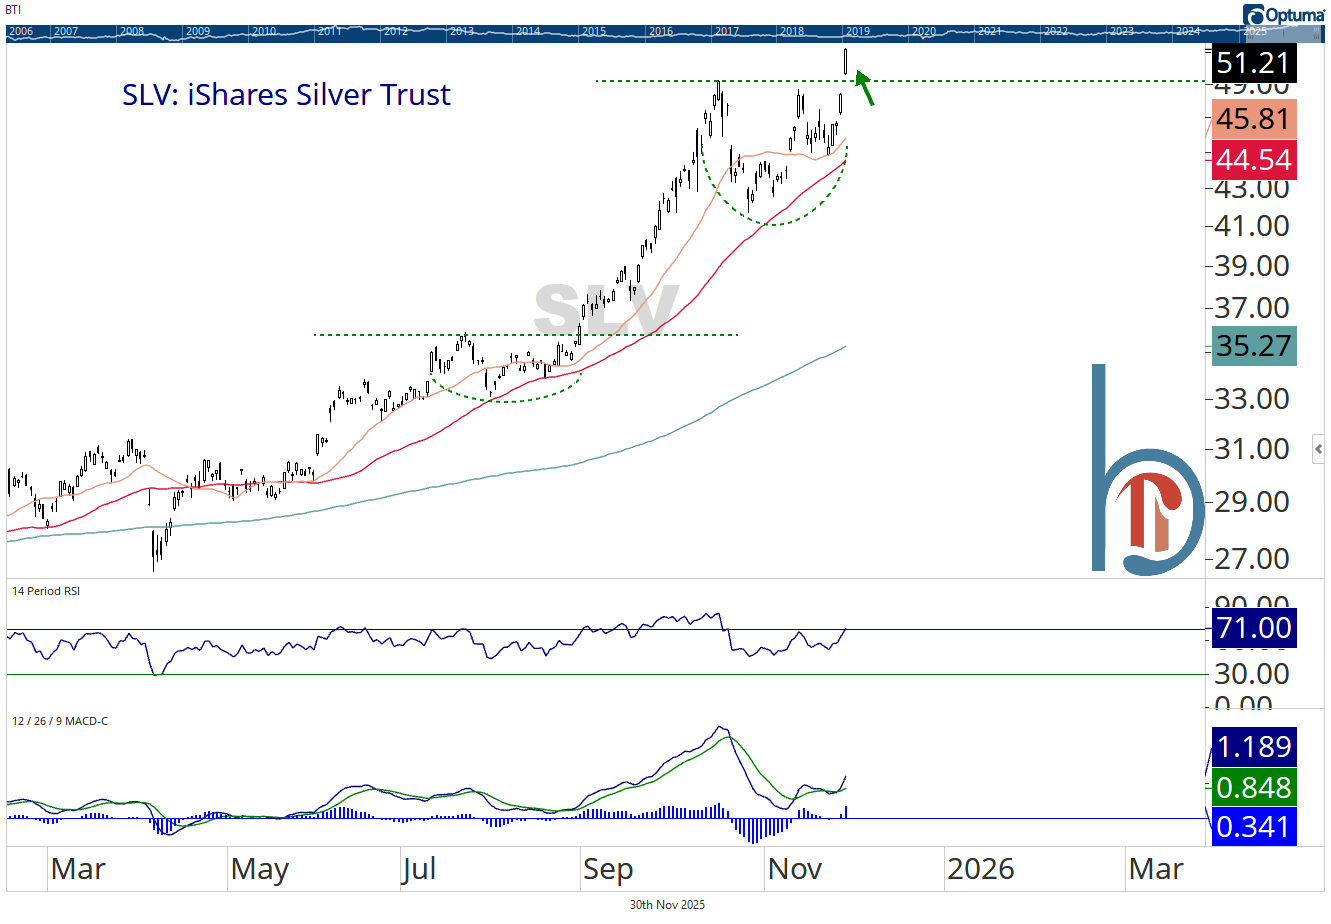
GDX leading and silver making new highs 👇 suggests we probably take it out.
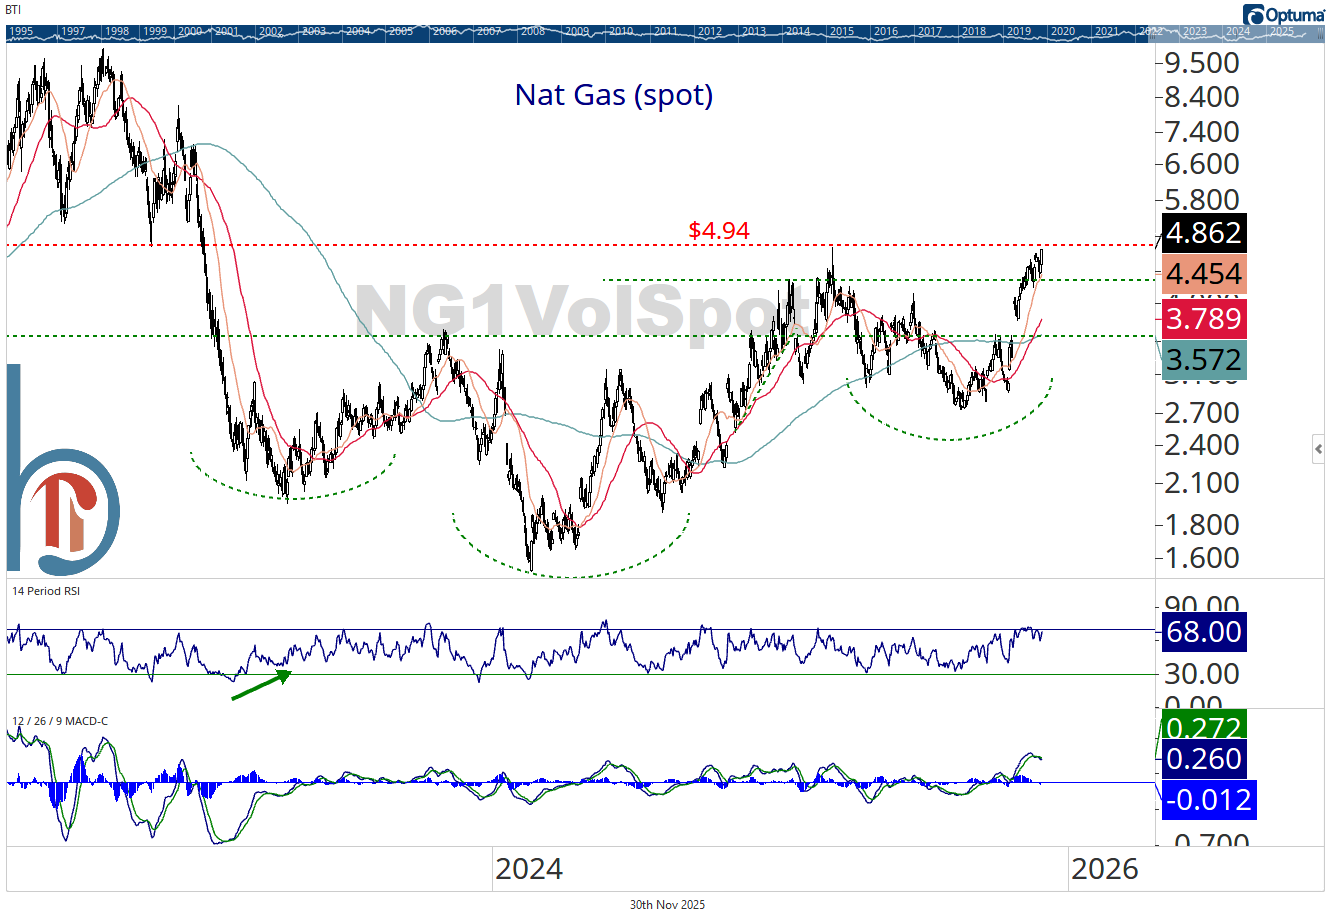
Nat gas on the verge of a major breakout
Fall publishing schedule (note recent changes)
Week of December 22-26: Stock Trends will be released on Wednesday, December 24.
Week of December 29-January 2: Monday Morning Playbook (only) will be released on December 29. No Overtime or Stock Trends.
Week of January 5-9: No Monday Morning Playbook. Trade Report (January 6) and Stock Trends (January 8) will be released on the normal schedule.
Thanks so much for reading and have a great week!
Scott
Scott Brown, CMT
Founder, Brown Technical Insights

Essential insights into market trends, technicals, and opportunities
