

This week’s Monday Morning Playbook is being made available in full to free subscribers. I believe the market is at an important inflection point and the charts in today’s report will highlight why. If you’d like to follow along with this call, please consider upgrading to a paid subscription. A 20% discount is available for the next week to all free subscribers.
Thank you,
Scott Brown, CMT
Founder, Brown Technical Insights

Good morning,
The S&P 500 broke out to another new high last week, powered again by the Magnificent 7.
They say the market will do the most obvious thing in the least obvious way, and the “rotation” from Nvidia into all the other largest stocks on earth has been objectively hilarious, active management headwinds aside.
However, I believe we have reached the breaking point for the rest of the market.
This is NOT a leadership call. There are no signs that the top growth stocks are ready to give up leadership relative to small-caps, value, or other lagging area of the market.
But, as I’ve tried to opine in past discussions of market breadth, what is unsustainable is most of the market moving outright lower, while the stocks leading the market higher become fewer and few.
And we’re definitely seeing the latter with just 3% of the S&P 500 hitting a 52-week high Friday.
But the real key to this is that many of the lagging groups, sectors, and indexes are clinging to support and on the verge of breaking down.
While mathematically possible, I believe it is highly unlikely the S&P 500 can continue higher if most of its components are actively breaking down.
And while it is the charts that are telling me now is the time for cyclicals to respond, we have clear fundamental catalysts as well. Powell testifies before Congress on Tuesday and Wednesday, June CPI is reported on Thursday, and Q2 earnings kick off with the big banks on Friday.
It’s do or die for the rest of the market and we are either going to see a strong bullish response or the beginning of an equity market correction.
This week’s report will review:
Last week’s breakout and narrow breadth
Key cyclical set-ups
Interest rates
Bitcoin breaking down while gold breaks out
Sentiment
and more!
View the presentation slides
The Plays
Modest overweight to stocks over bonds
Opportune time to add to bonds/extend duration
Use stops for cyclicals groups at their June lows
Growth is leadership but at risk if cyclicals break
Gold and metals and mining stocks are timely longs
Last week: Tesla (+27%) and the Magnificent 7 led the S&P 500 to a 2% gain and a new all-time high but most of the market continued to stall. 5 sectors were lower with energy (-1.2%) falling the most and small-caps down 1%. Rates were slightly higher on the week but declined sharply on Friday following a soft jobs report. Gold gained 7.2%, its best week since May 17.
This week: Hugely eventful week with Powell testifying before the Congress’s Joint Economic Committee on Tuesday and Wednesday, CPI for June reported on Thursday and banks kicking off earnings season on Friday. PPI is also reported on Friday and the week is littered with other Fedspeak as the market looks increasingly anxious about the timing of the first cut.
Key Earnings: (courtesy of @ewhispers)

This week’s level to watch
$120 on XLI, the SPDR Industrials Sector Fund
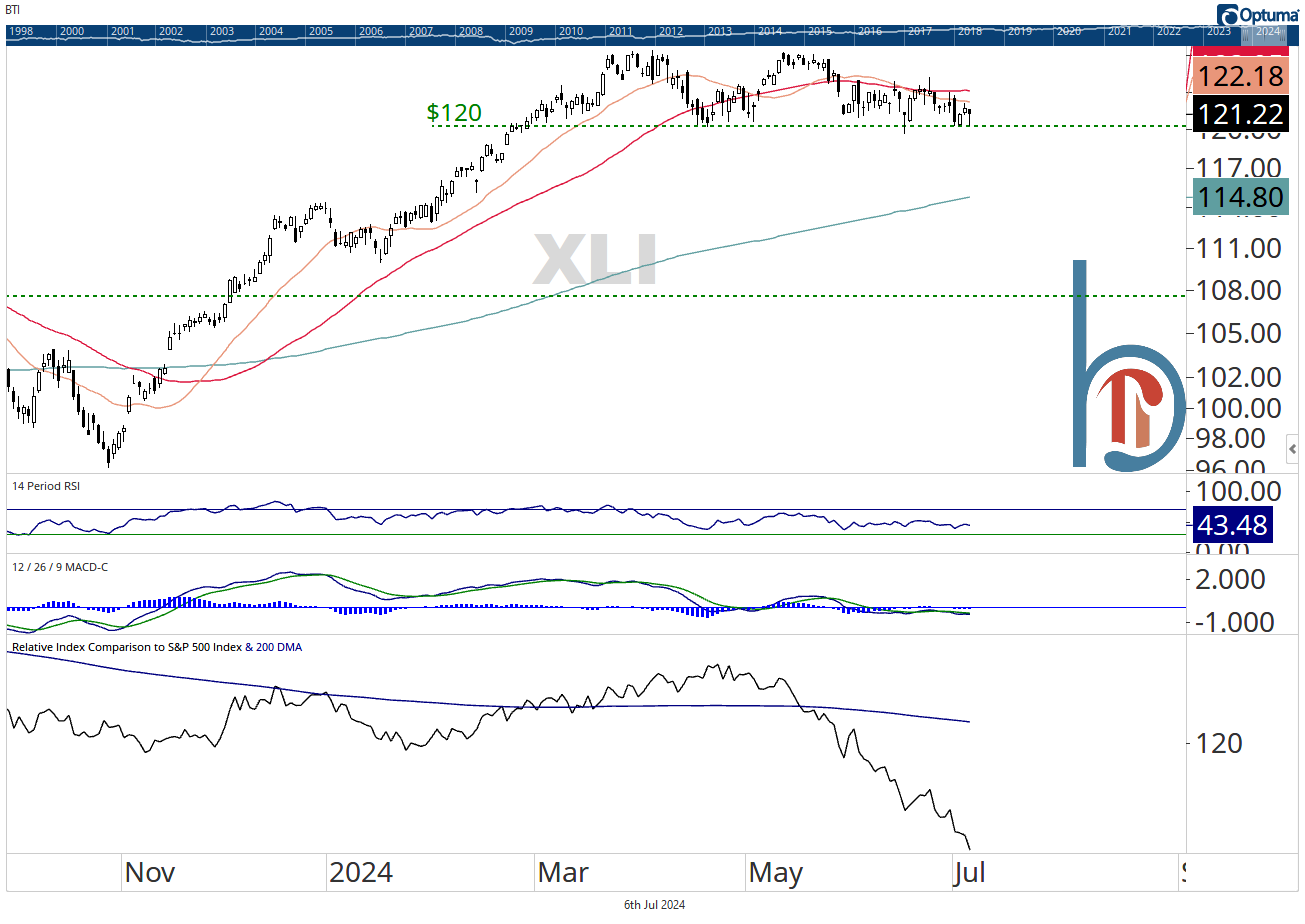
This week’s level to watch is $120 on XLI. As today’s report will highlight, many cyclical groups and the equal-weight index are clinging to support and on the verge of multi-month lows despite the S&P 500’s new all-time high. If this support level breaks, and we remain below $120, it becomes significantly more likely that the breadth problems do lead to a market pullback.
Leaders lead as the S&P 500 breaks out
SPX breaks its consolidation to the upside
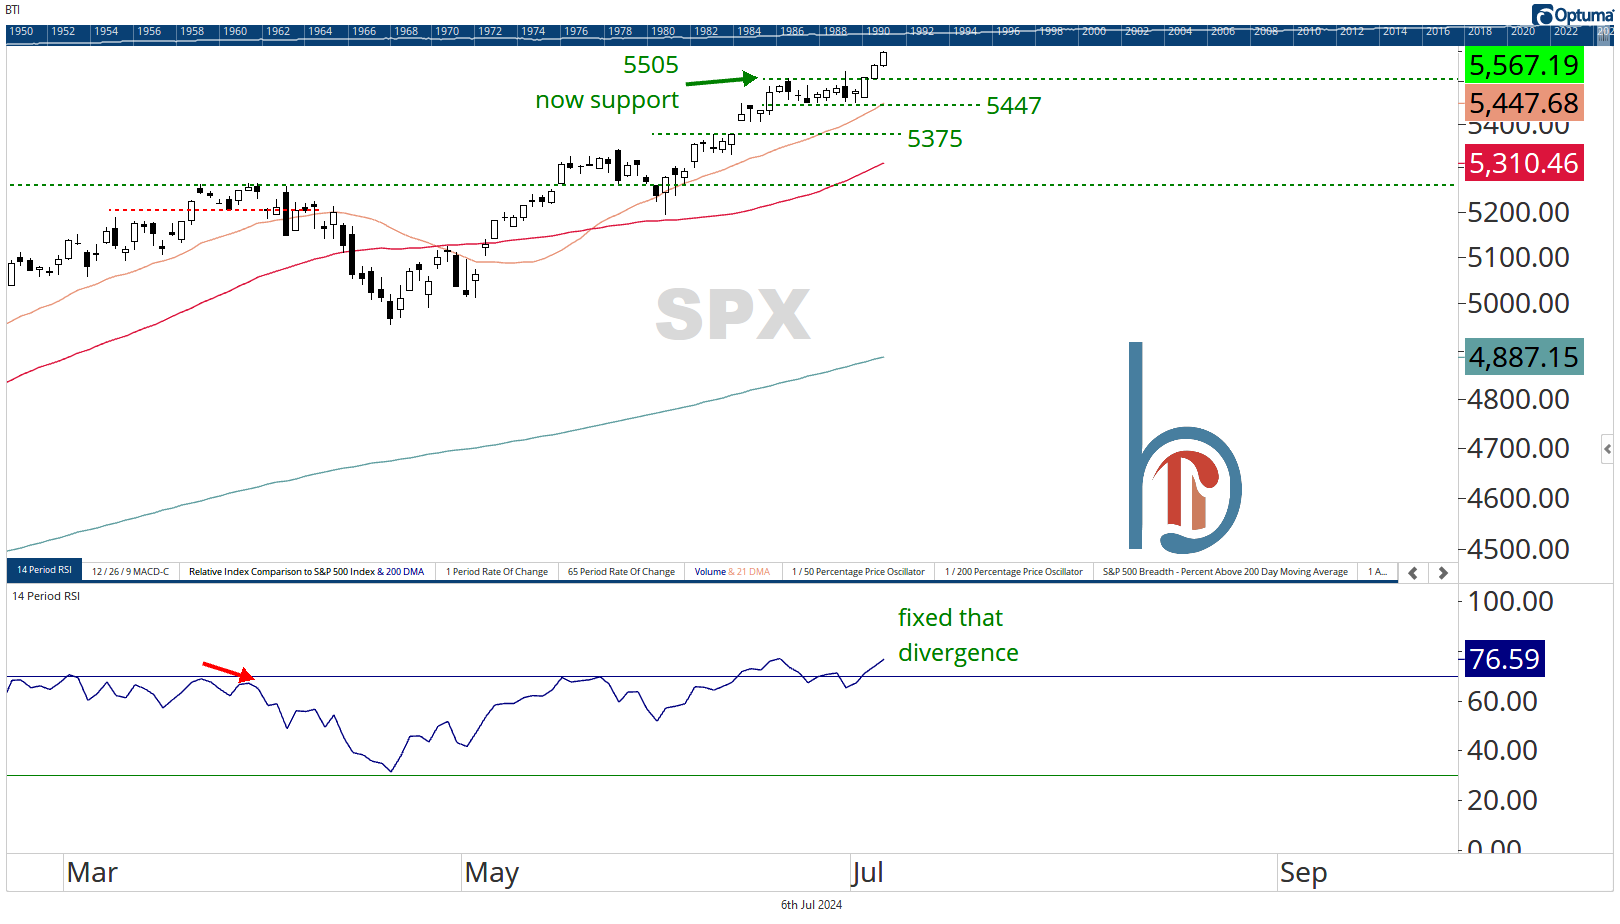
The S&P 500 broke out decisively above resistance last week, ending a 2-week holding pattern for the cap-weighted index and fixing a bearish momentum divergence highlighted last week.
All gains led by the Mag 7 again
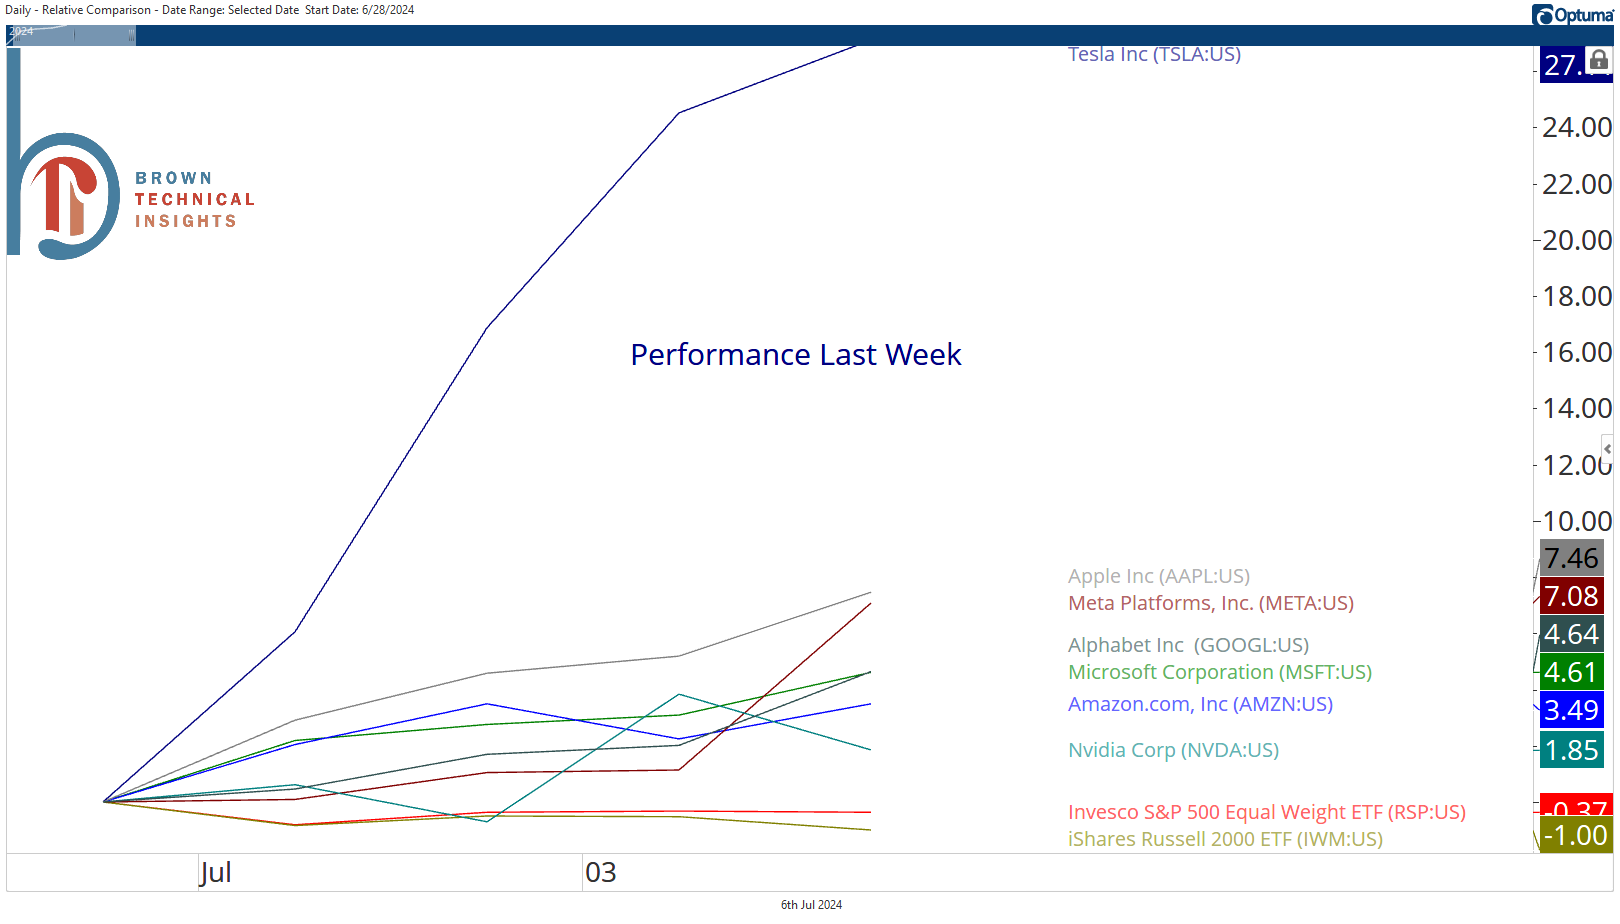
Trends trend and the S&P 500’s move was once again led solely by the Magnificent 7. All 7 stocks were positive on the week with an average return of 8%, meanwhile the equally-weighted S&P 500, small-cap Russell 2000, and 5 of 11 sectors were outright lower on the week.
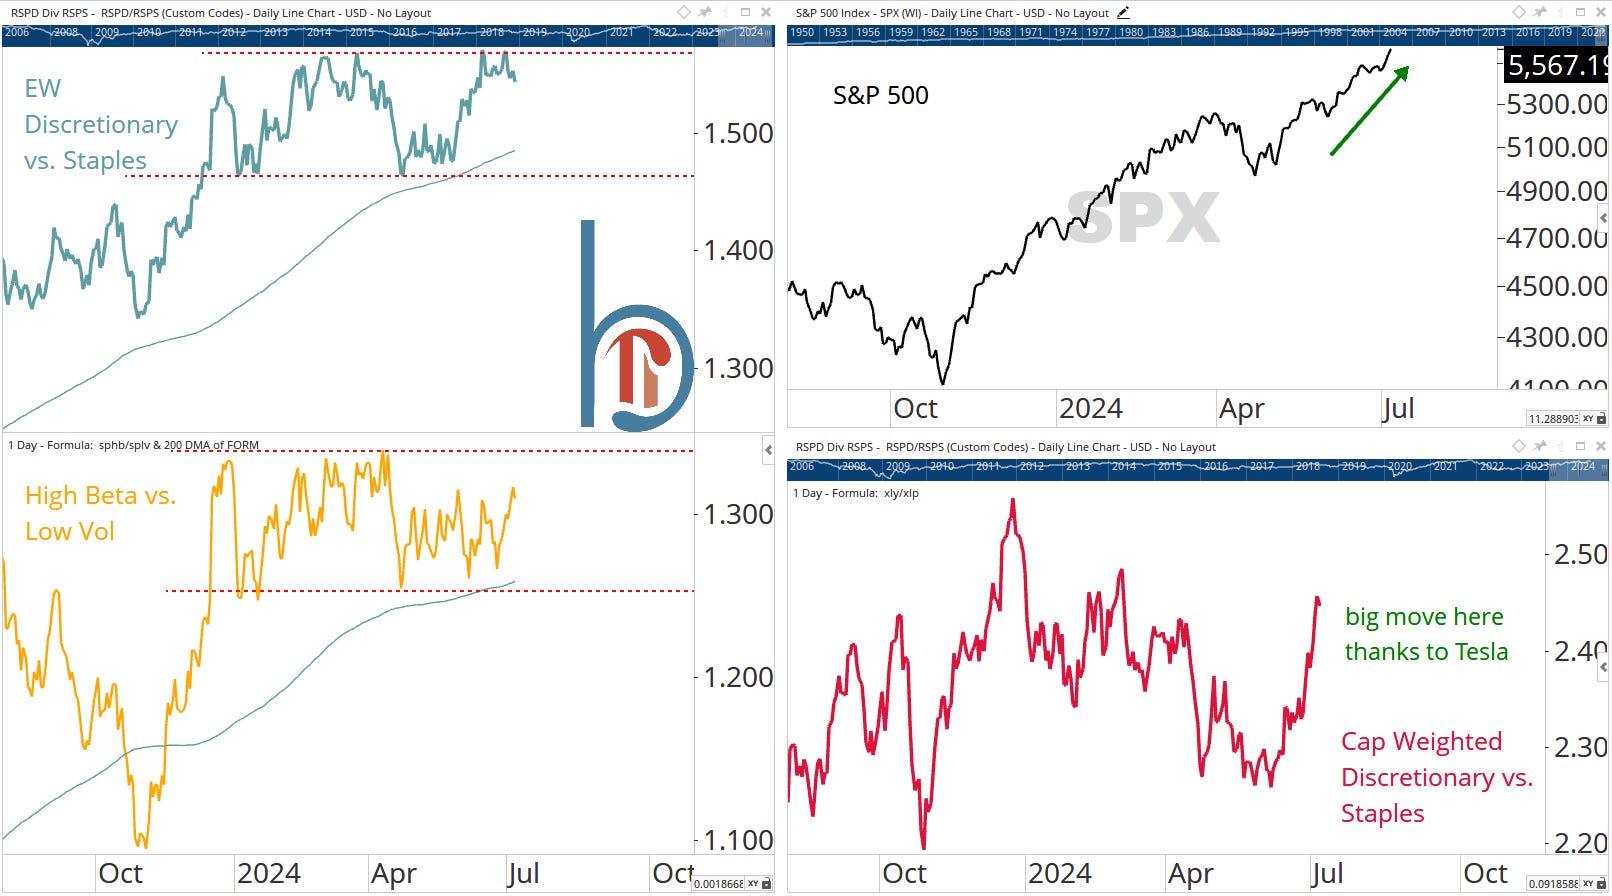
Consumer discretionary breaks out
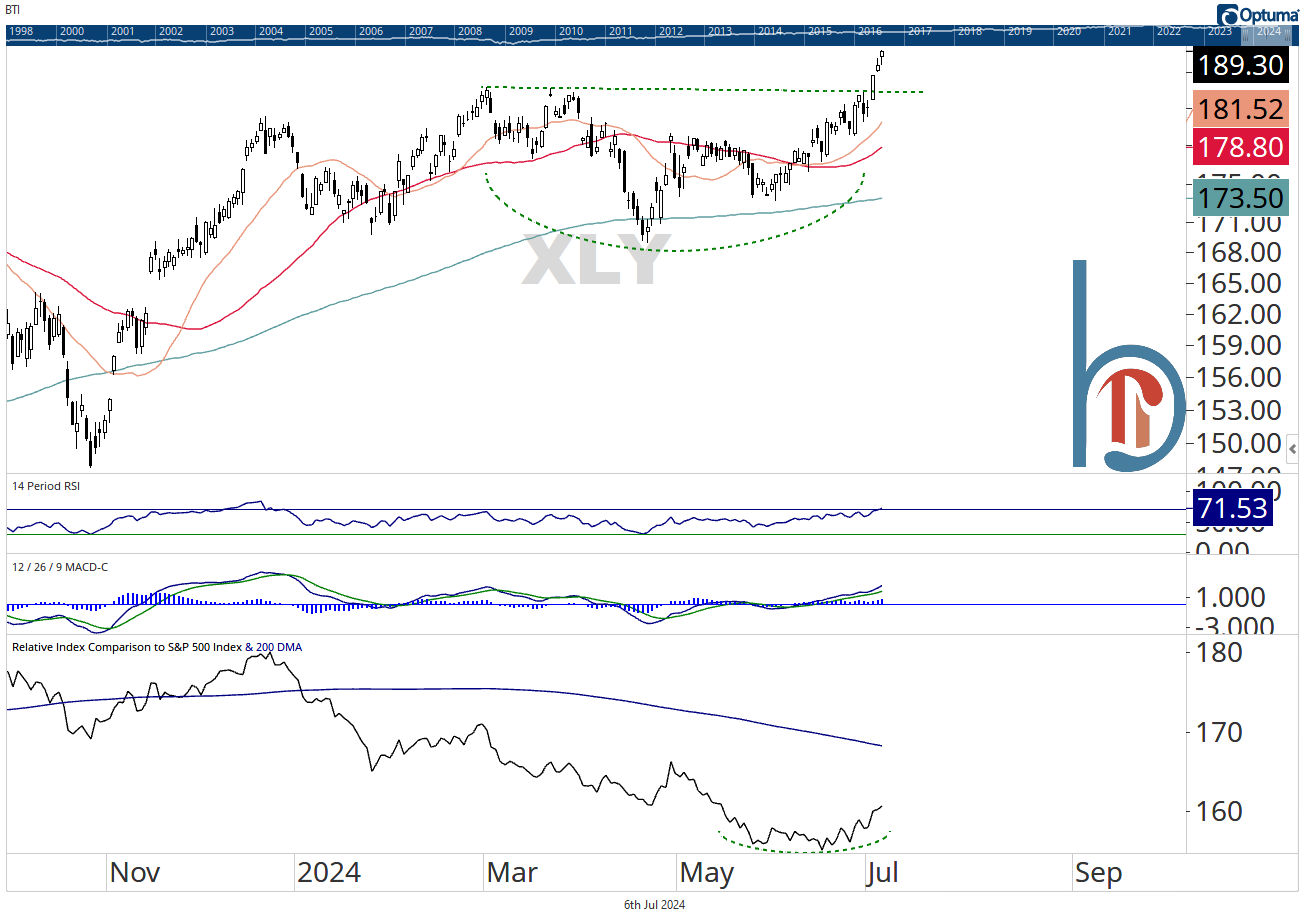
As part of the July trades for our ETF models, we increased exposure to the consumer discretionary sector. That Tuesday turned out to be the breakout day for XLY, and while it is fair to gripe that this is mostly a two-stock story (Amazon and Tesla), the fact is this is another sector outside of technology that is breaking out higher, not lower. That’s bullish overall.
We’ve only seen this once before
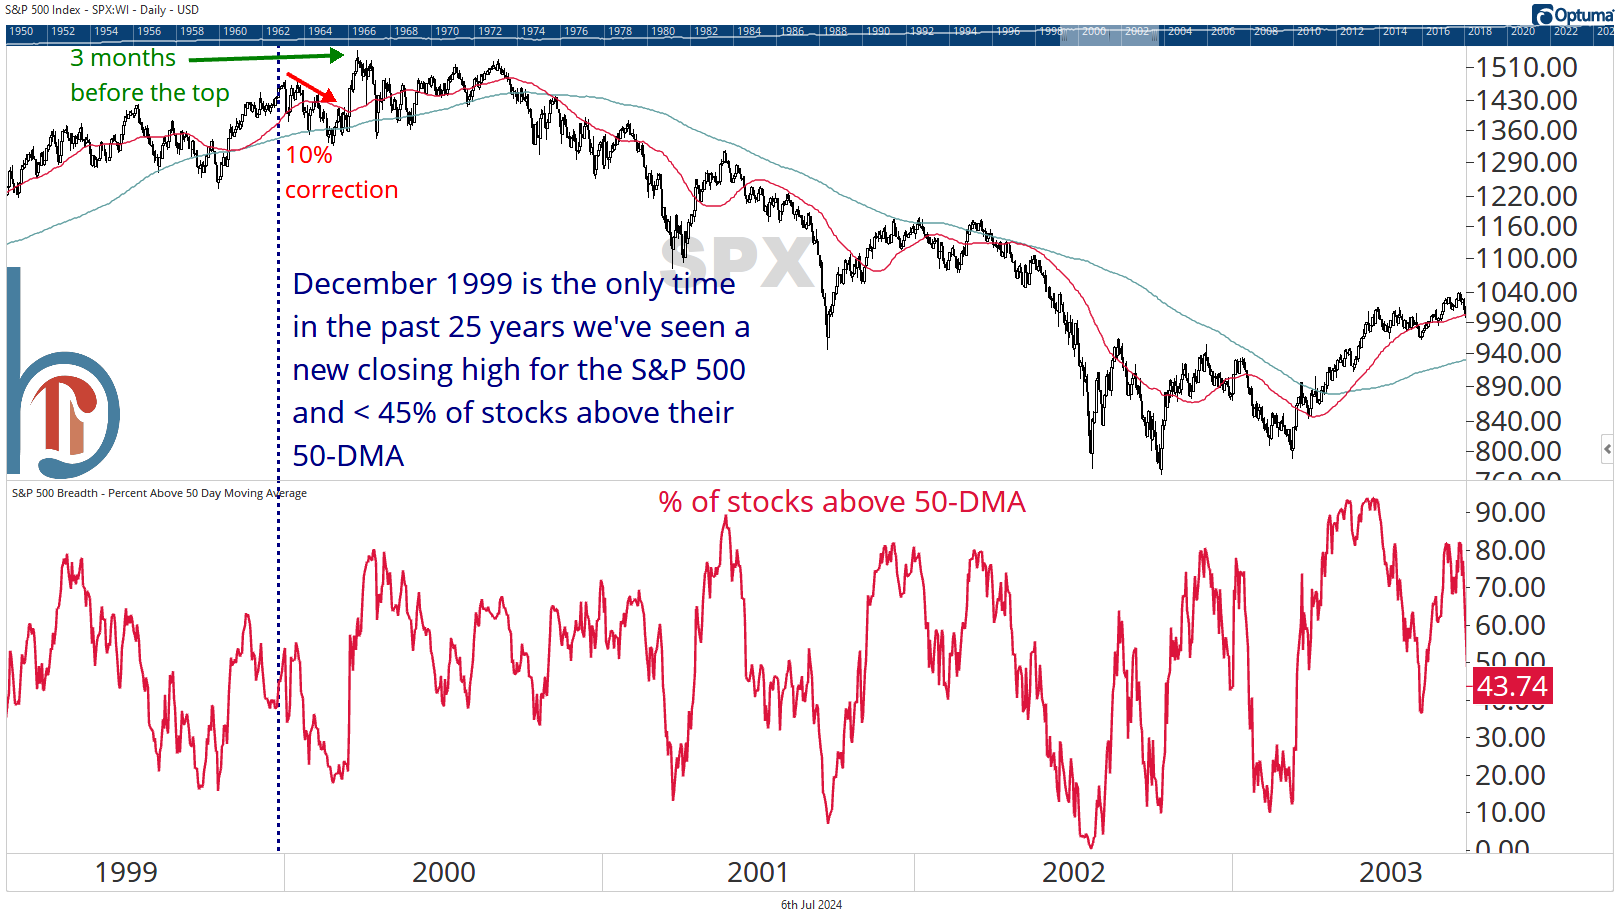
On the one hand, everybody knows about the breadth problems. On the other hand, we really are dealing with negative extremes. Just 43% of SPX components are above their 50-DMA right now, and the only time in the past 25 years we’ve seen an all-time high with less than 45% was December 1999.
The equal-weight index is clinging to support
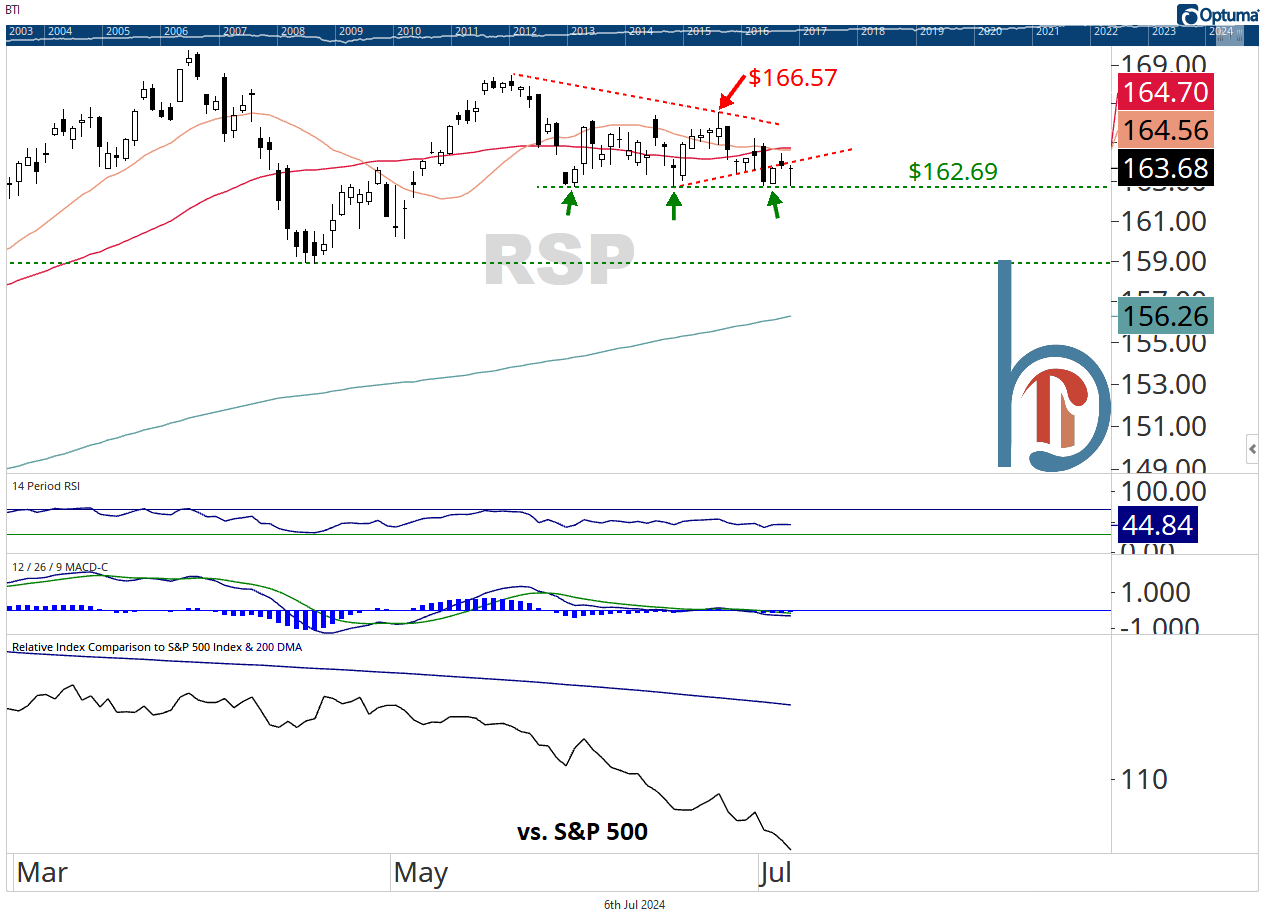
A proxy for the average stock, RSP is clinging to support for the fifth time since late May. While mathematically possible, I believe it unlikely that this ETF can break support here and the cap-weighted index can continue higher.
Never short a dull market
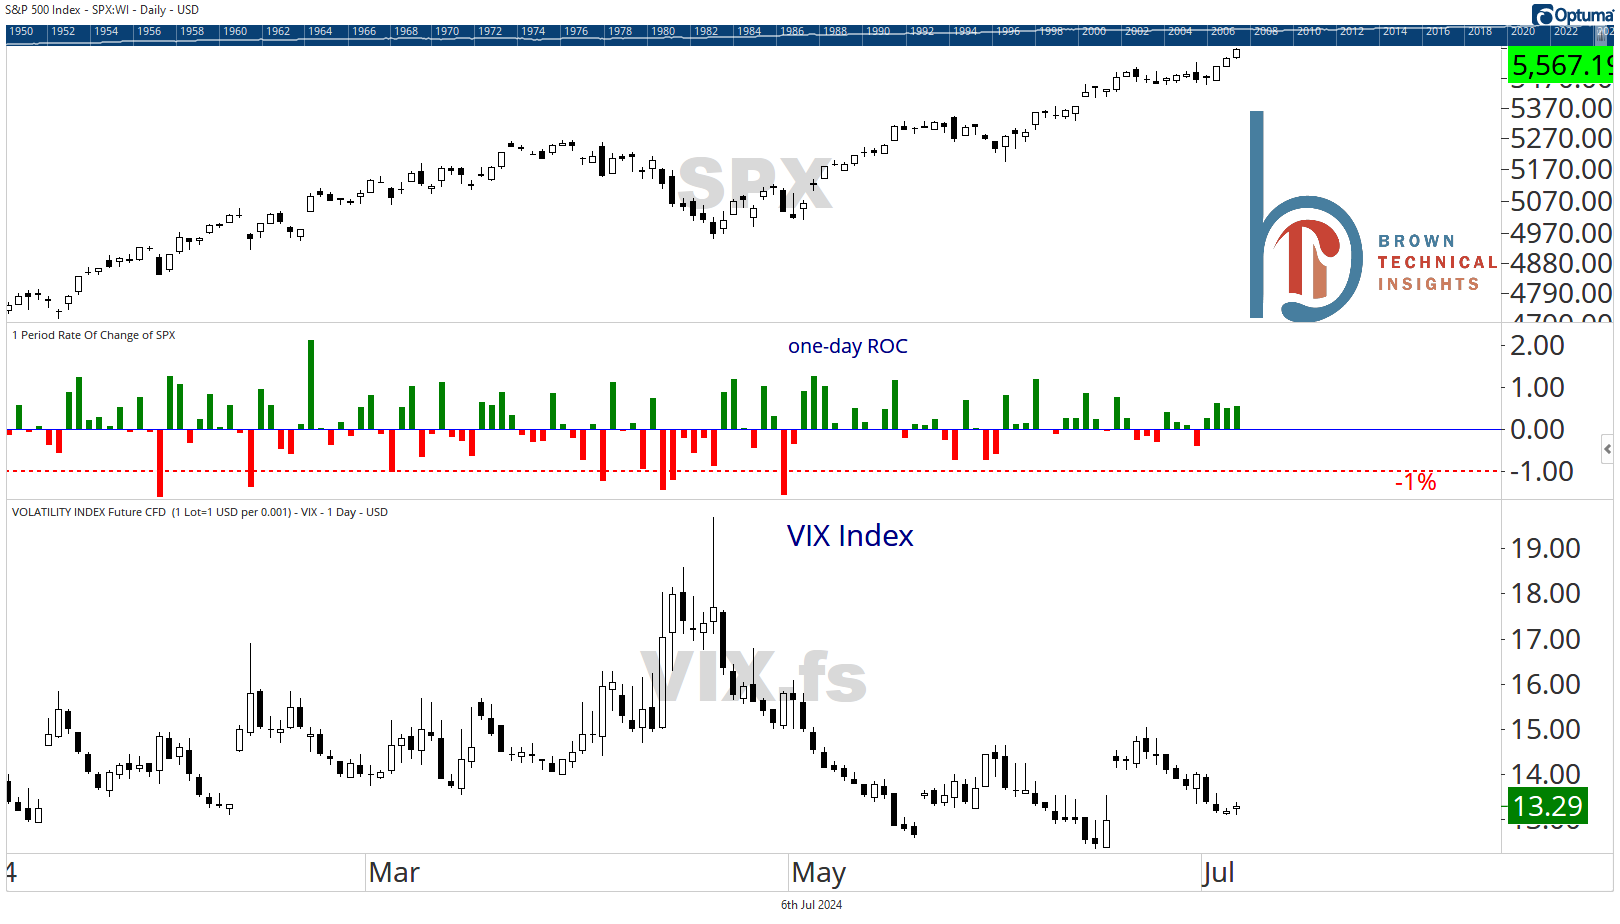
One point in favor of breadth and the lagging sectors catching higher is that this market has been incredibly quiet. The old saying is “never short a dull market” and you tend to see volatility increase before major peaks. But the S&P 500 hasn’t had a 1% decline since April 30 and the VIX is at just 13.
Going into Overtime: This vs. That
Tomorrow’s report will cover: Ratio/relative strength charts covering a range of asset classes and sectors.
Do or die for the rest of the market
Financials pushing up to 2022 highs
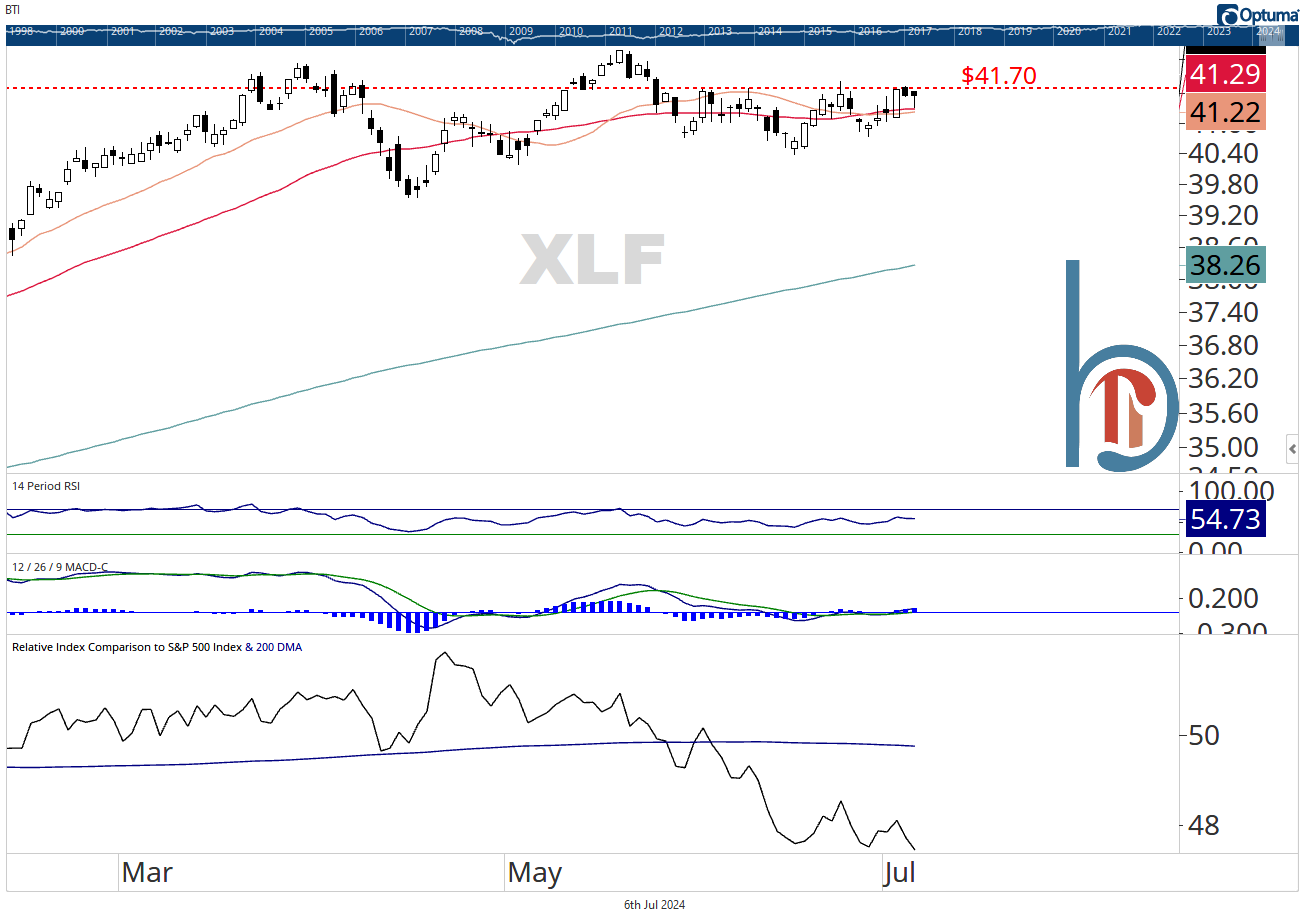
Financials aren’t leadership compared to tech but while many cyclicals are clinging to support, financials are trying to push through resistance. $41.70 is exactly the January 2022 highpoint for XLF and it has been a strong ceiling since late May. With bank earnings starting Friday, bulls have a potential catalyst. Now they just need to push XLF to new all-time highs along with tech, communication services, and most recently, consumer discretionary.
Big banks continue to ride a rough uptrend
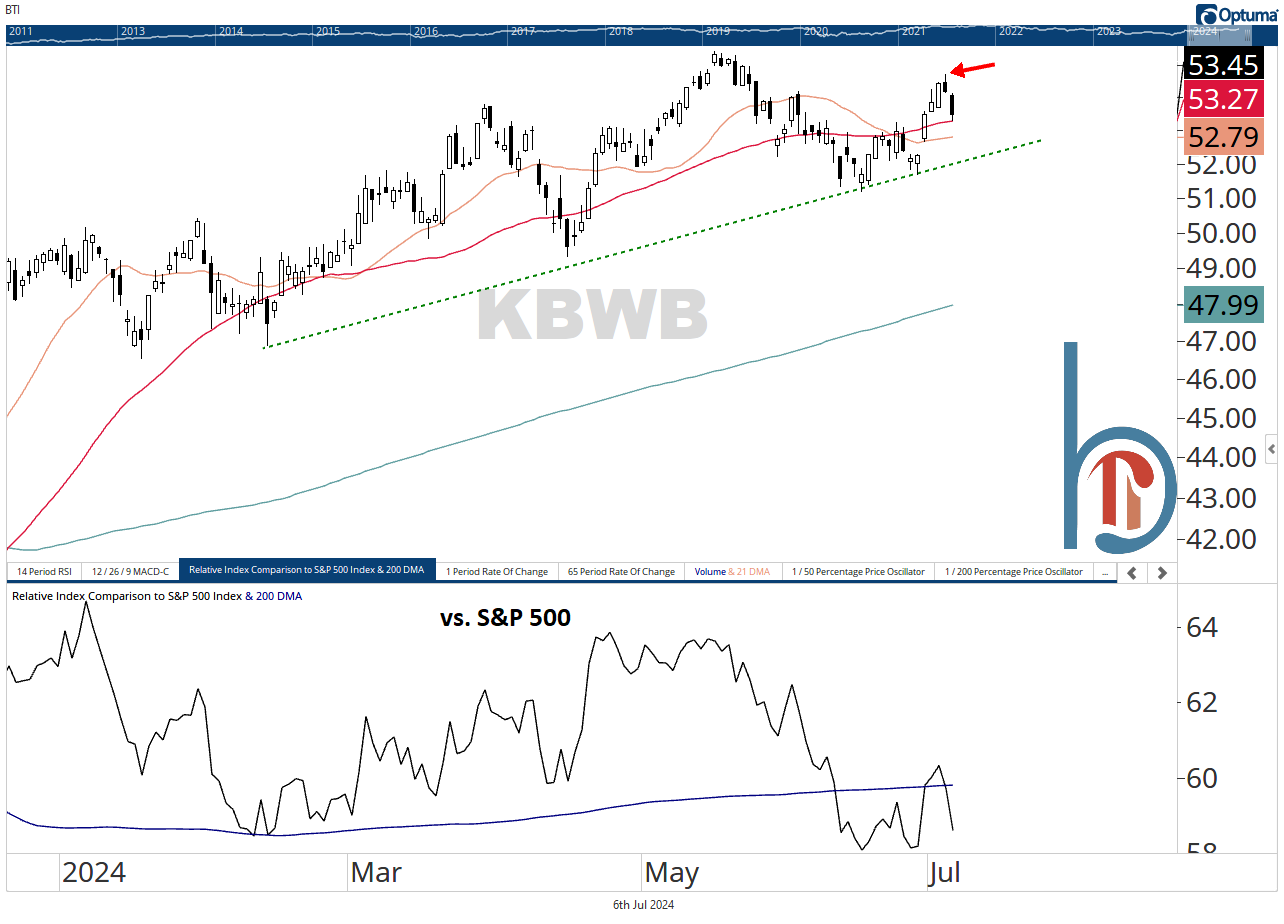
Last week’s high of $54.74 is first resistance for the KBW Bank ETF.
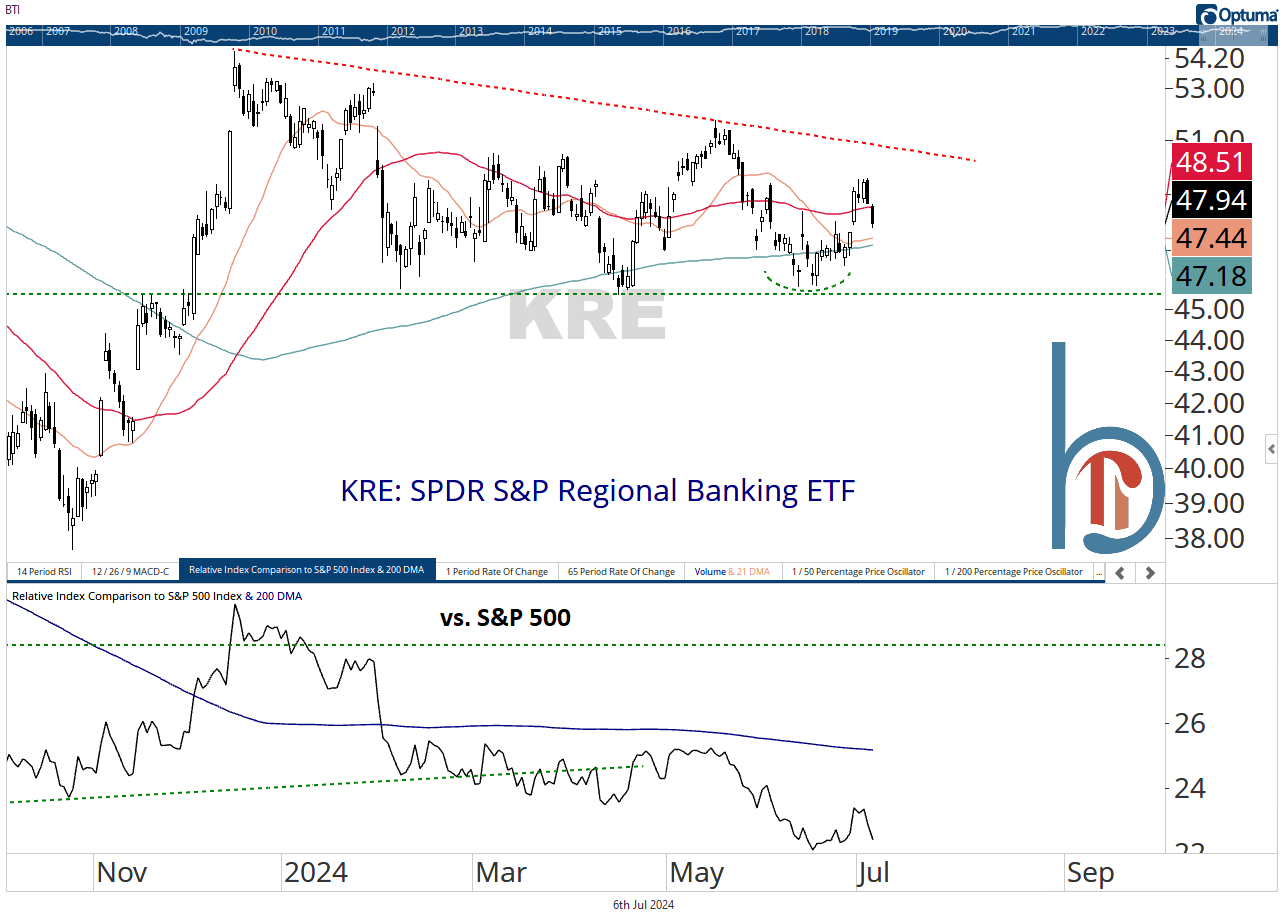
While regionals ride a downtrend
Real estate is setting up for a big move
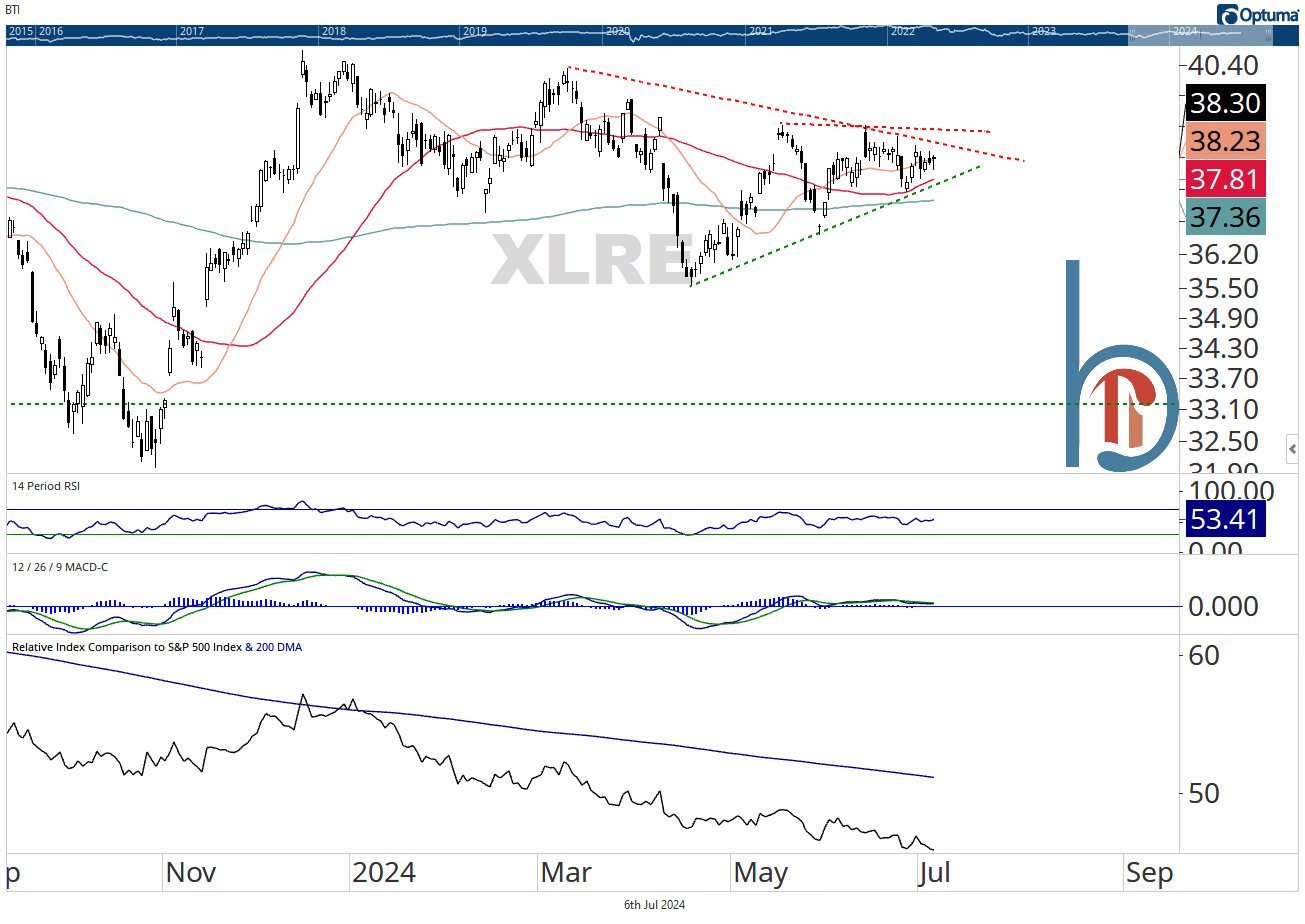
It’s the been the worst sector so far this year.
Homebuilders break down
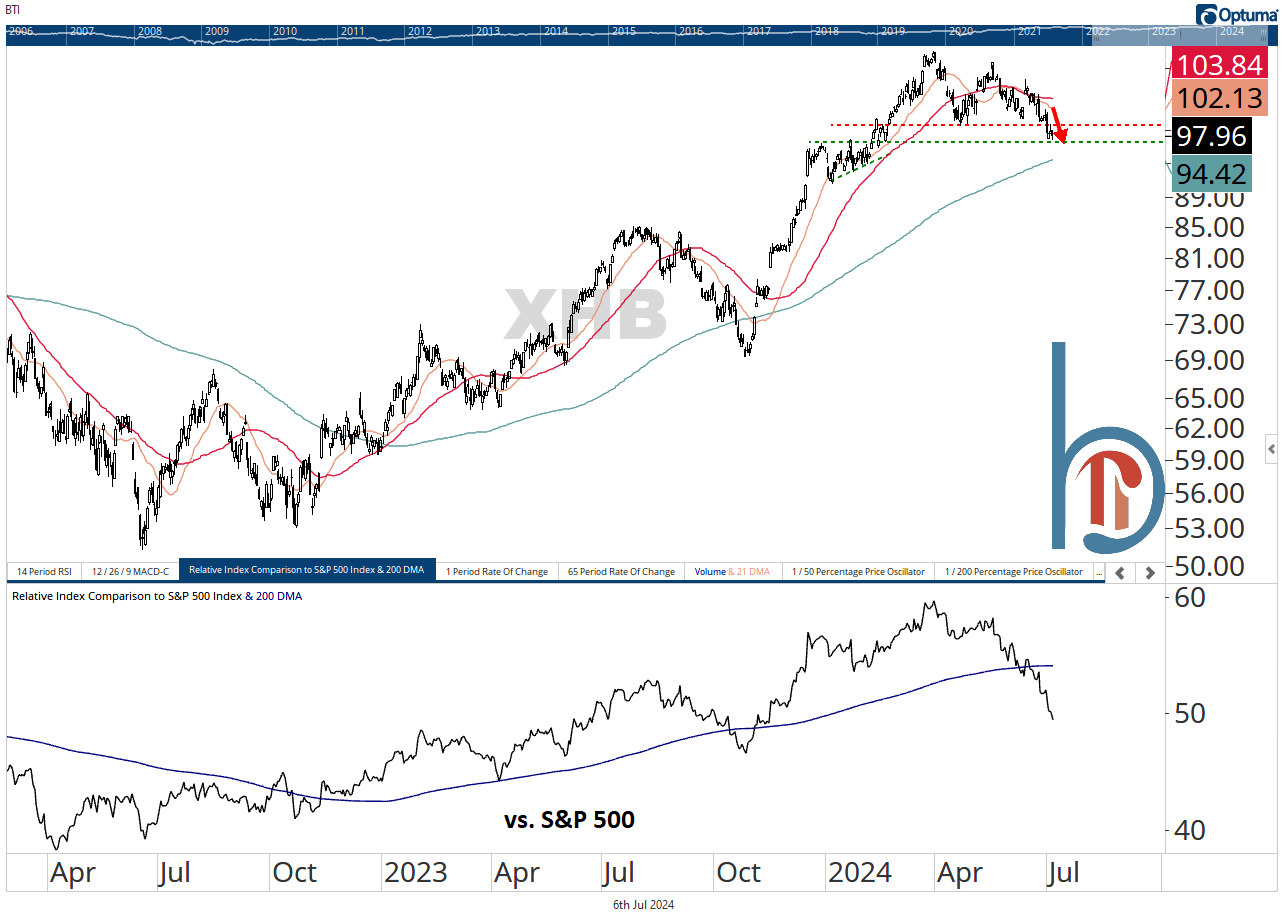
Many of the lagging groups are still above support, but one group already breaking down is homebuilders. XHB broke below its April lows and made its first 3-month low since the October bottom last week. There’s a range of secondary support between $94-$97 but a technical breakdown from what has been a bull market leadership group shouldn’t be ignored.
Twice as many stocks making 3-month lows as 3-month highs
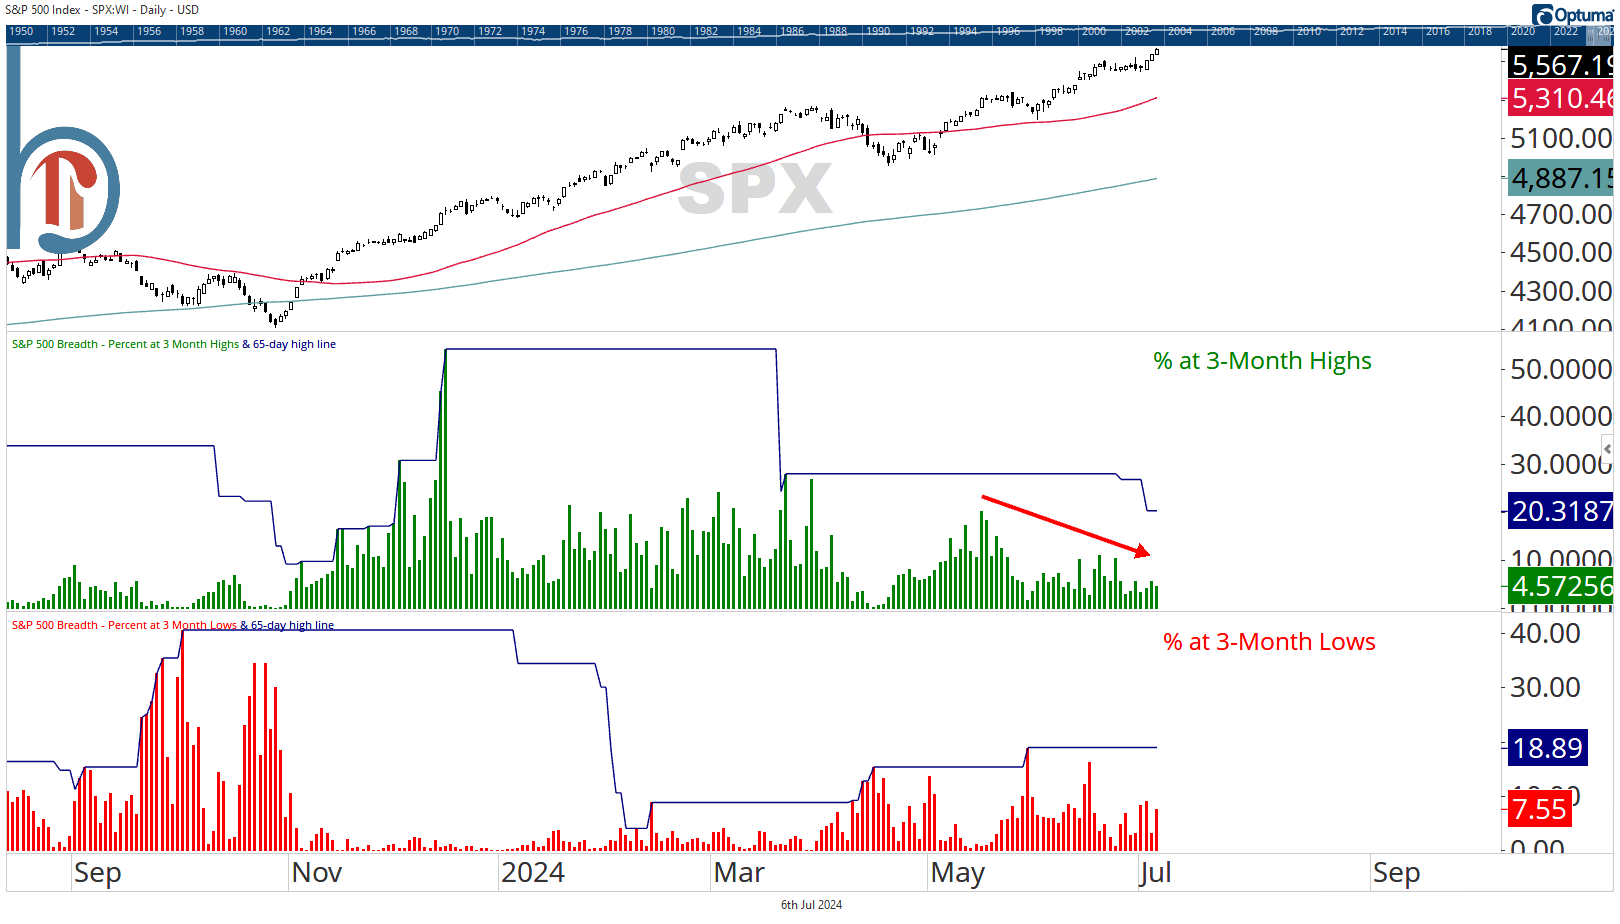
Homebuilders are a very small group, but they aren’t the only stocks breaking down. 9% of SPX components traded to a 3-month low last Tuesday, while just 4.5% of stocks hit a 3-month high with the index on Friday. Bulls can’t afford to see an expansion in new lows when new highs continue to decline.
Payrolls save the day for bond bulls
Huge weekly reversal for 10s
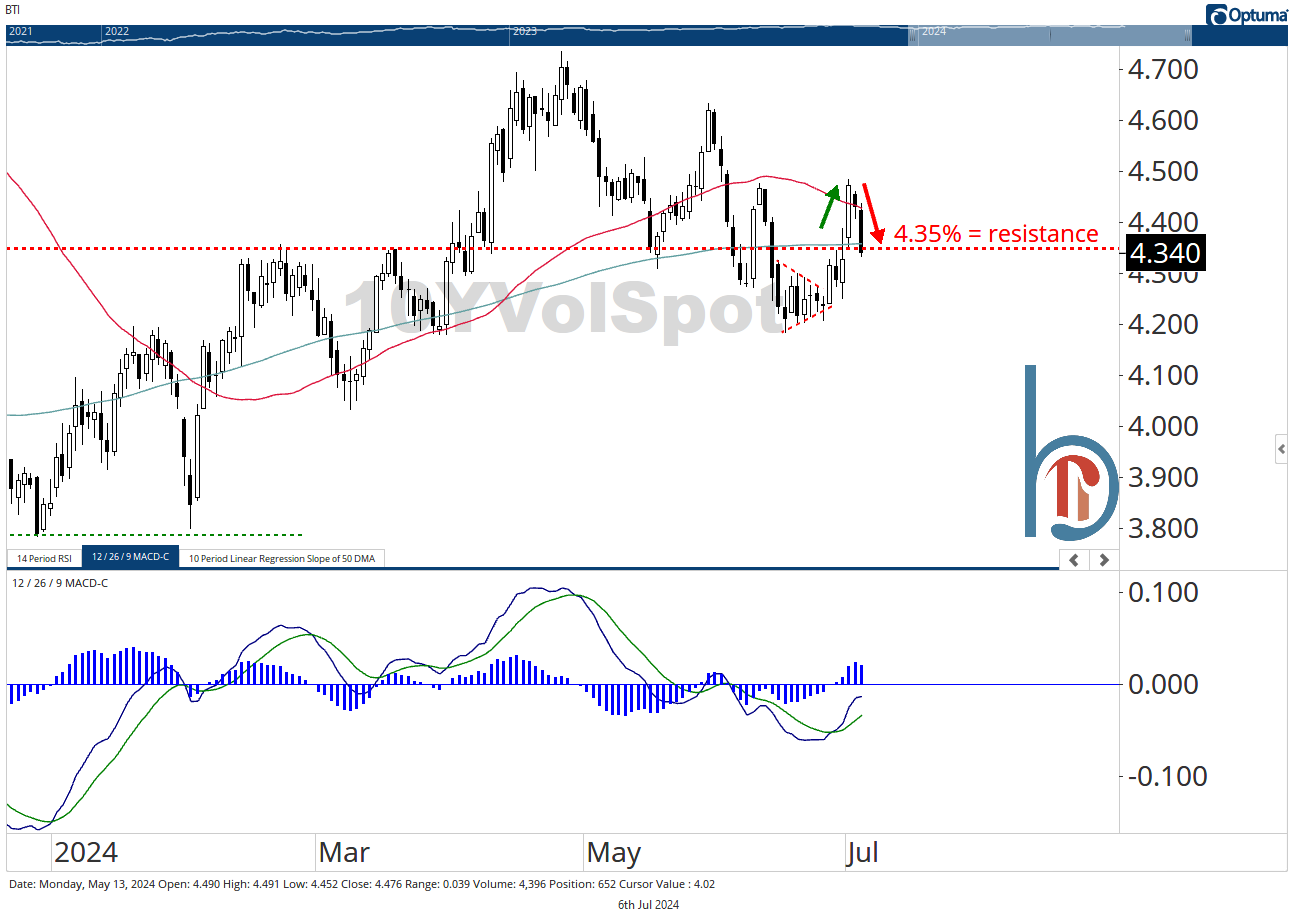
The 10-year got as high as 4.48% last week but closed below 4.35% after the soft payrolls report on Friday.
Odds of a September cut spike to over 70%
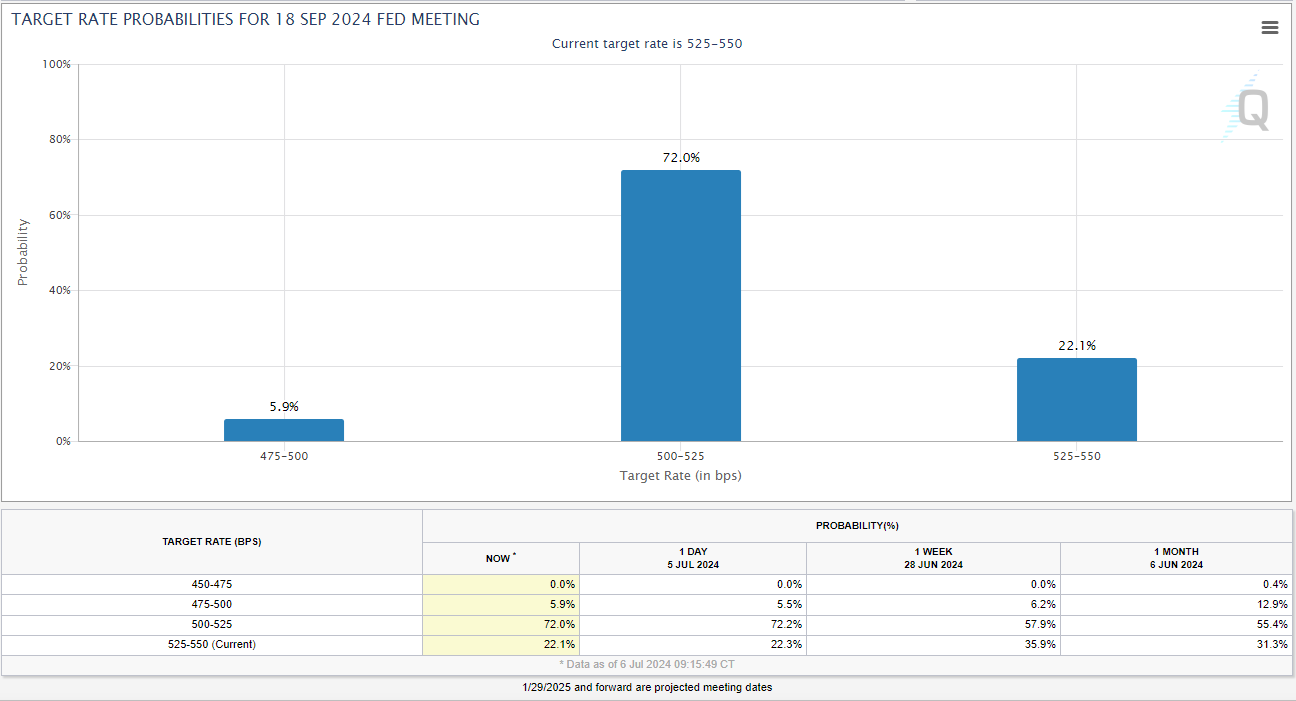
The Friday jobs report sent odds of a cut in September up 15 percentage points to over 70%. This combined with the reversal in the 10-year reiterates that extending duration is the right move here and bonds have asymmetric risk/reward vs. cash. Either rates fall because the Fed delivers with cuts or they fall because the Fed is strangling the economy and the odds of a slowdown or recession are increasing.
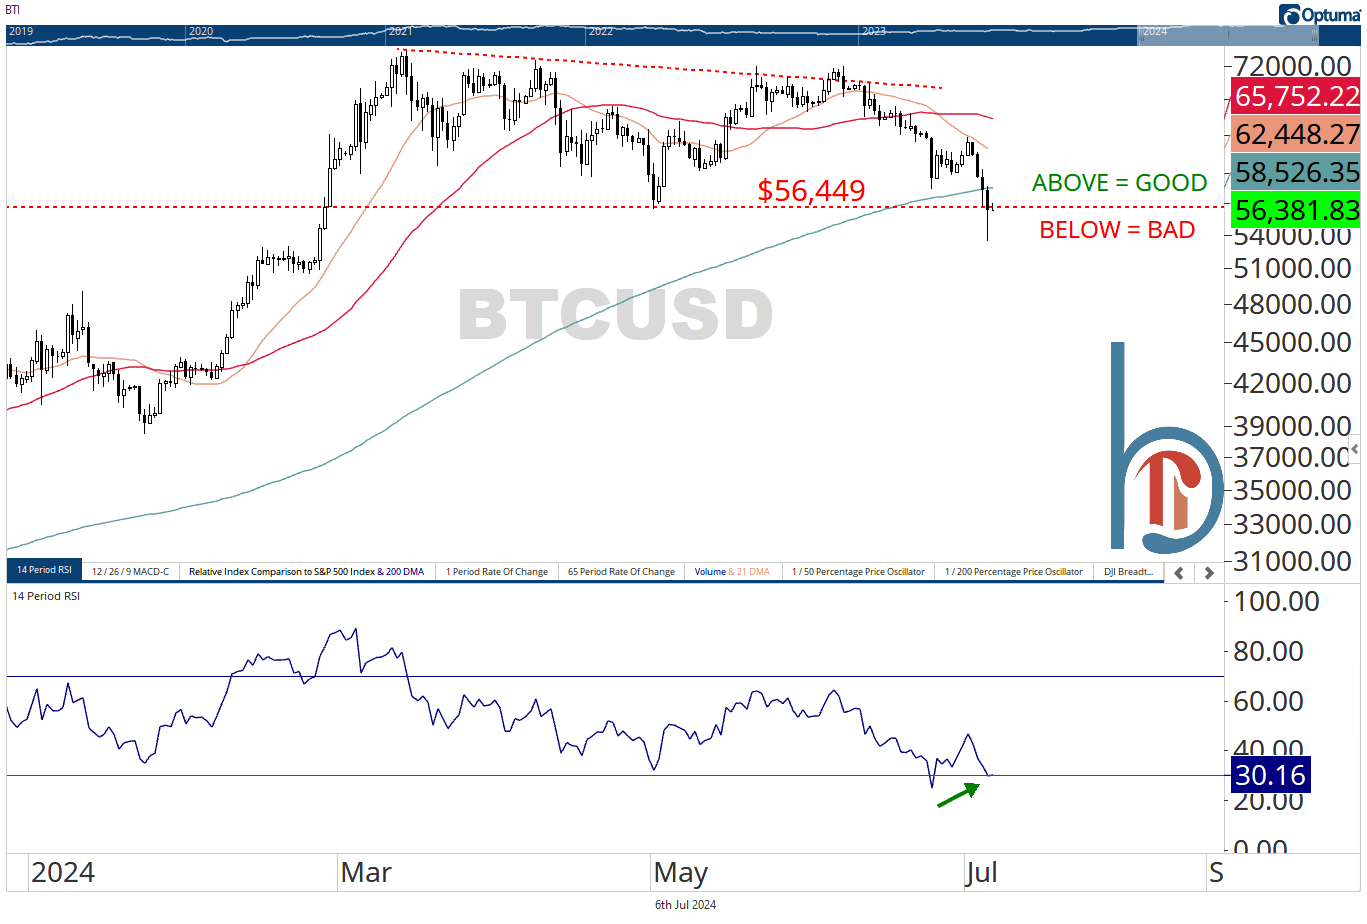
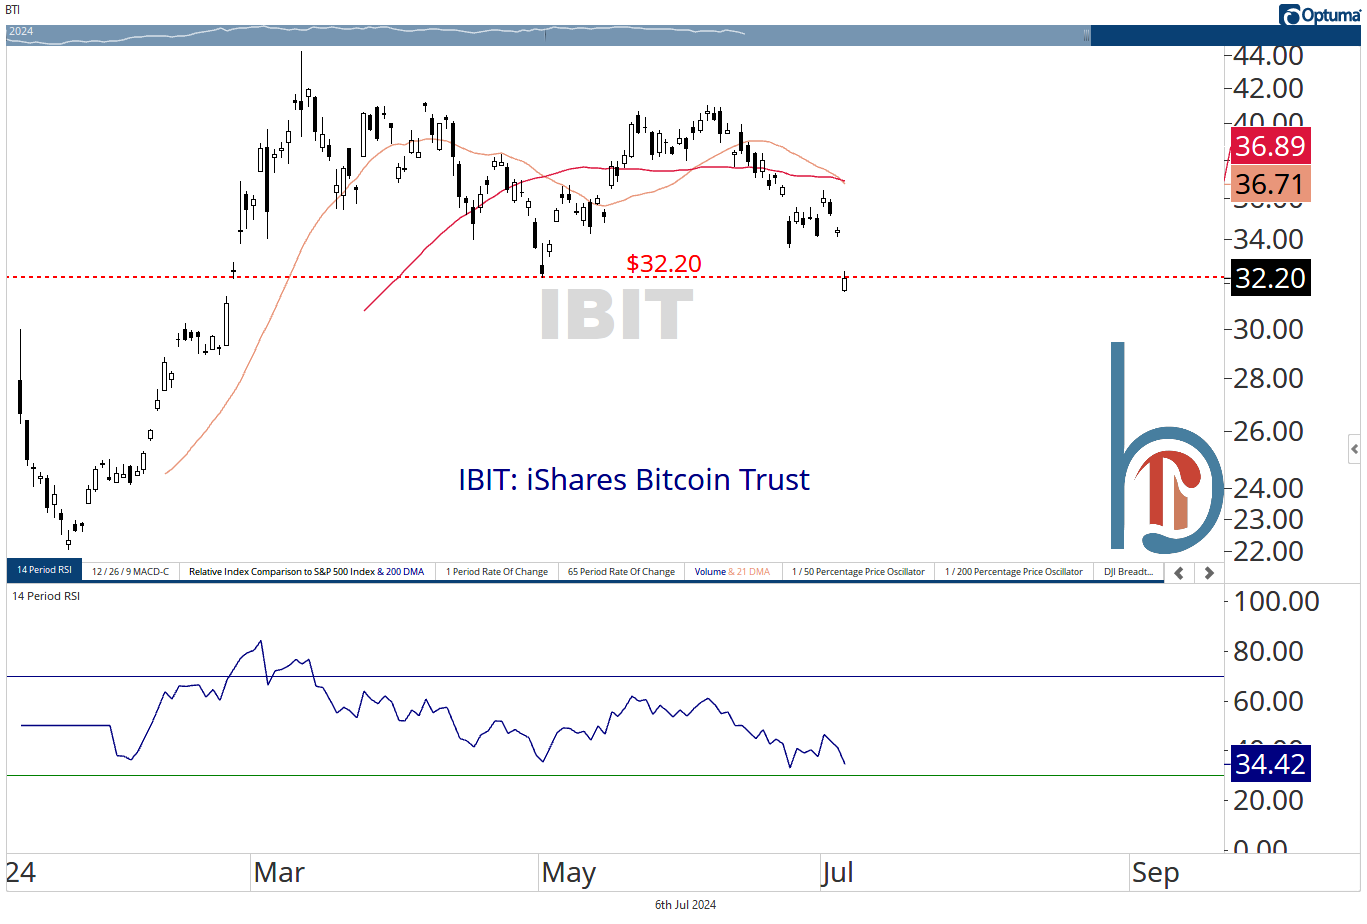
Bitcoin breaks down, gold breaks out
Bitcoin hits lowest level since February
IBIT closed exactly on its May lows on Friday
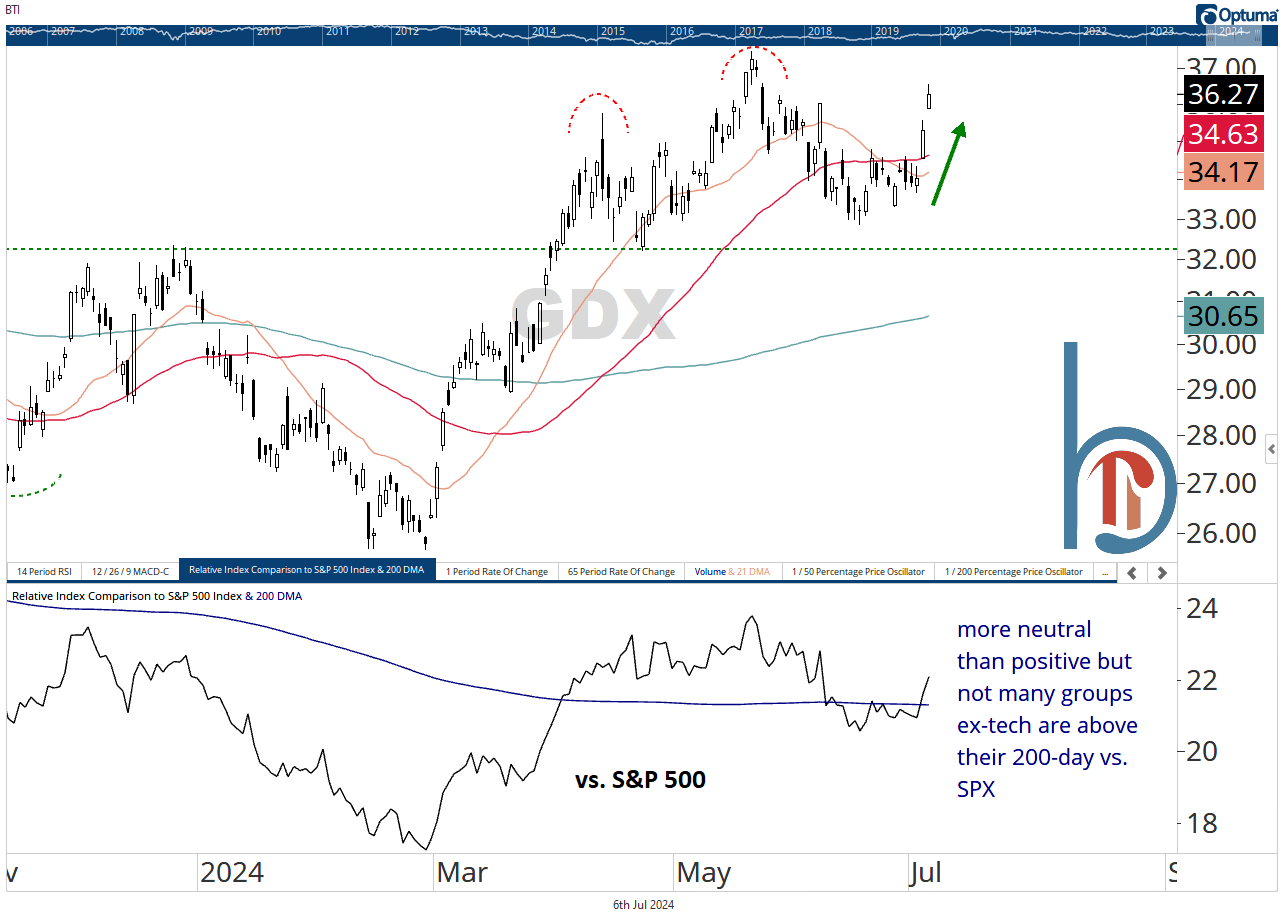
It was the old “not a top” formation for gold miners
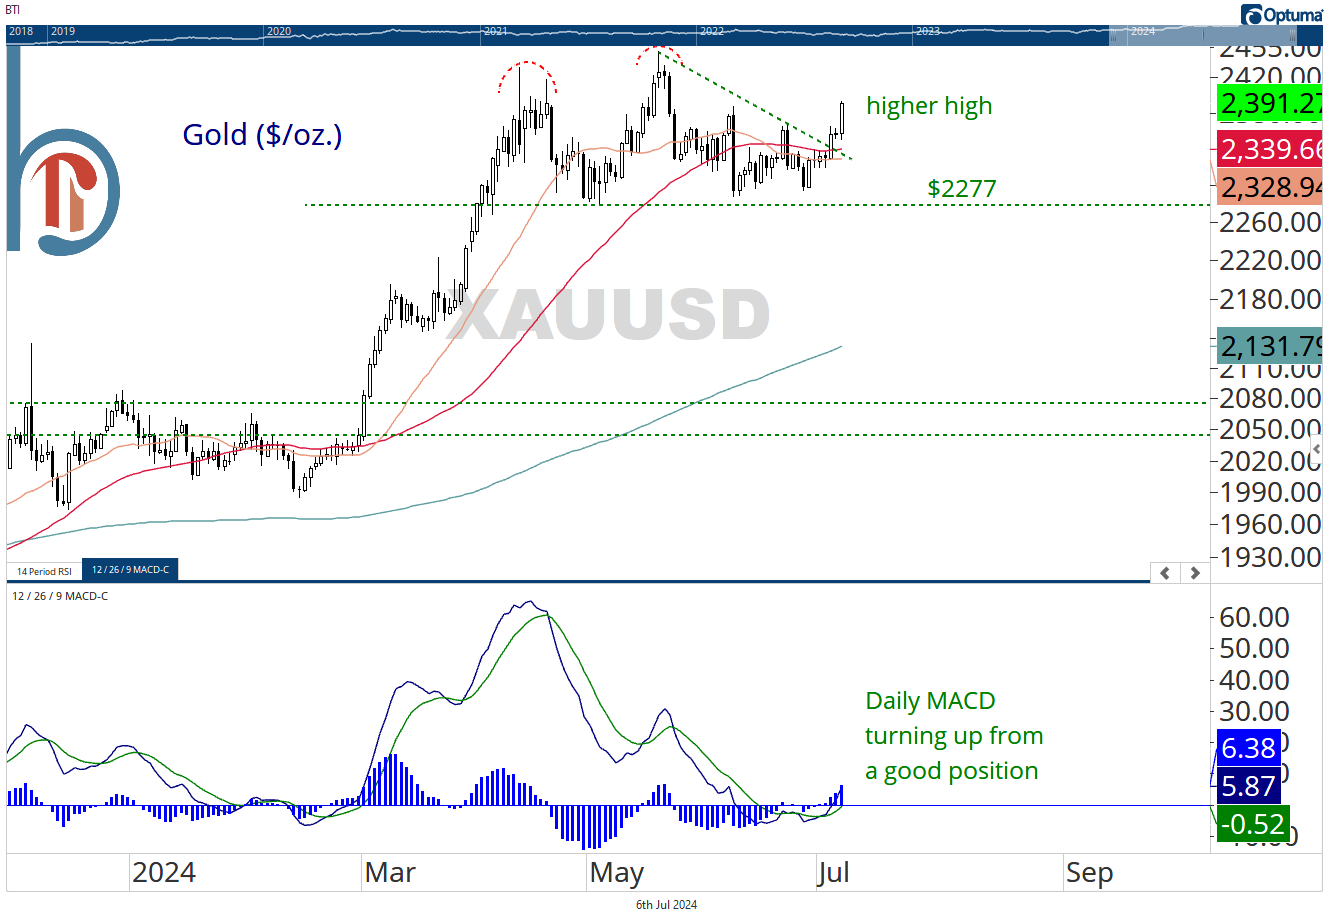
Gold makes a higher high
Silver back above the key $30 level
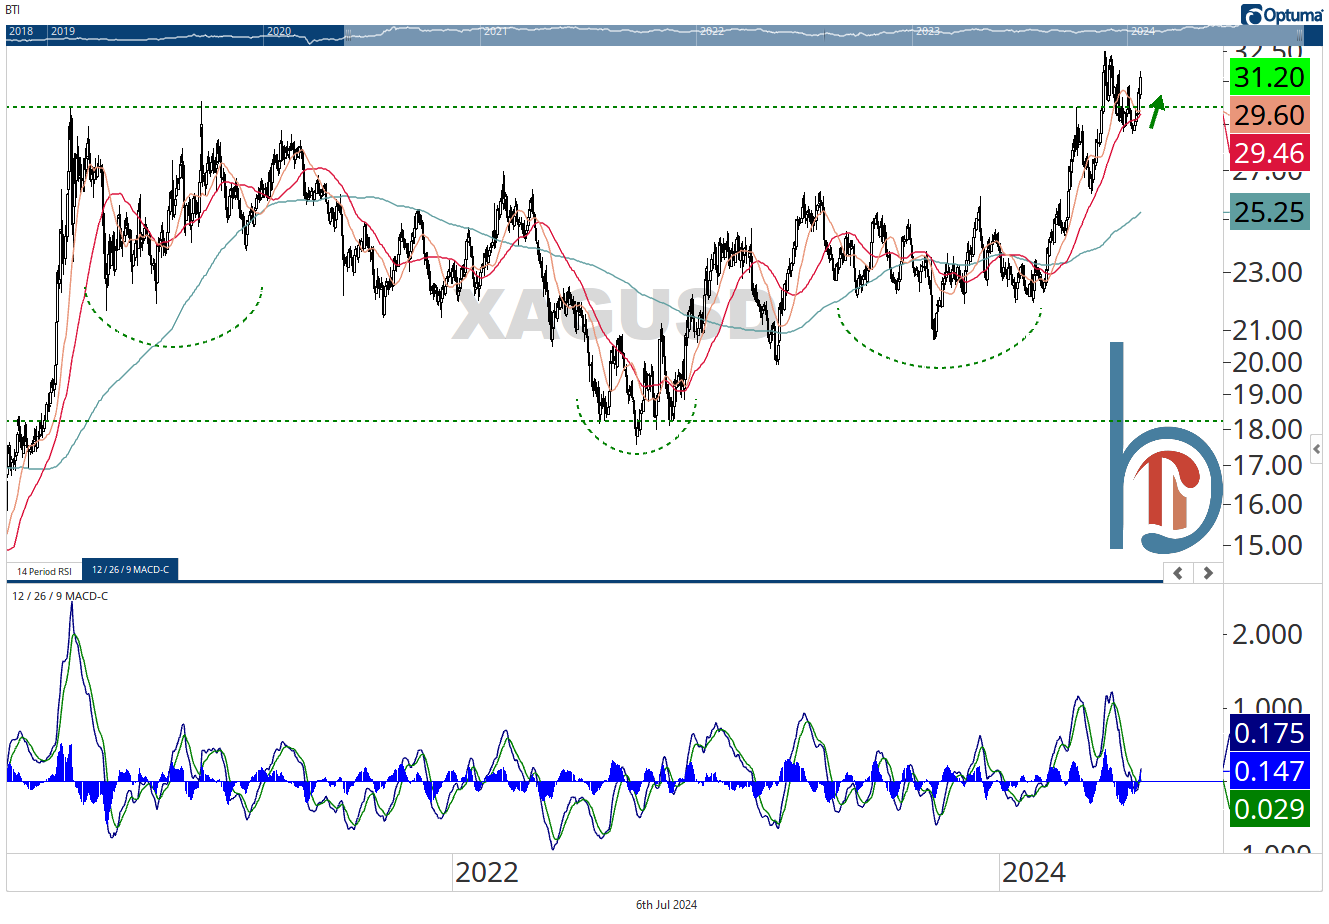
XME added to the Ultra-Growth portfolio last week
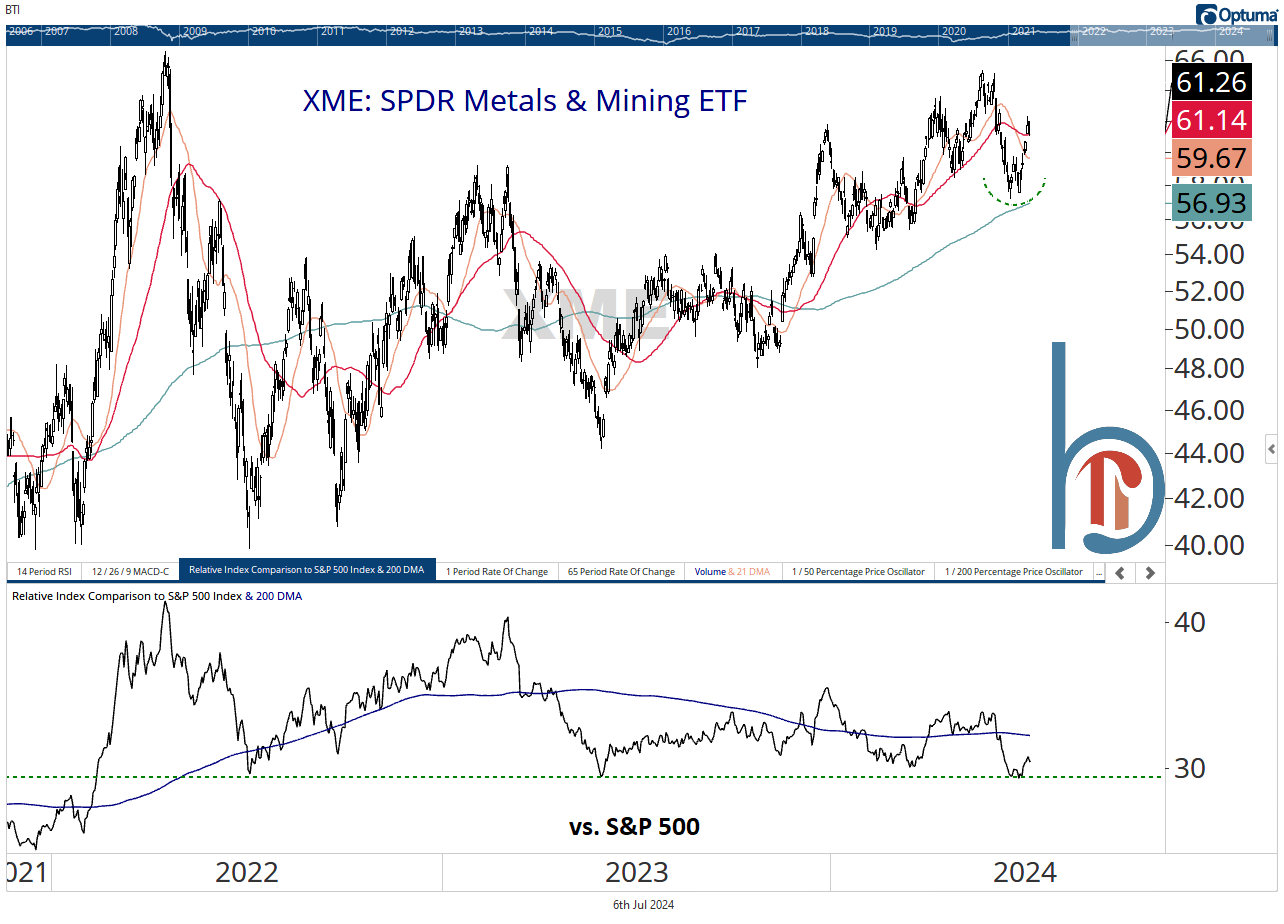
If silver is above $30/oz. and gold and gold miners are making higher highs we want to continue to have a bullish bias toward the metals and mining space. XME was added to the Ultra-Growth ETF model last Tuesday.
Sentiment check
You want a sentiment indicator? Kalonovic out at JPM
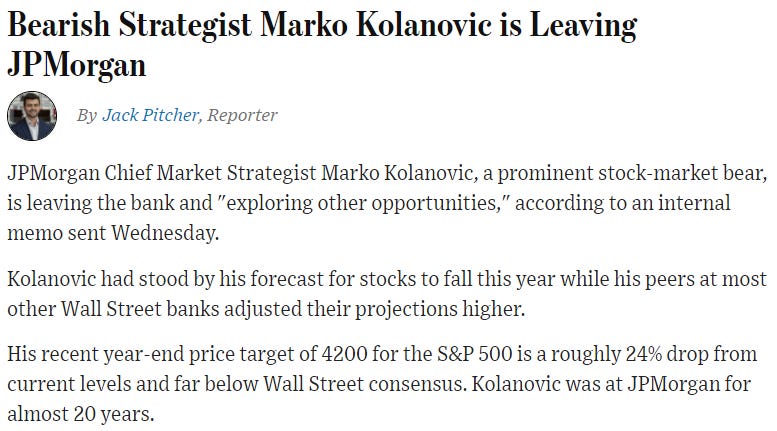
One the most vocal bears since the 2022 lows.
And Piper Sandler just gives up on price targets all together
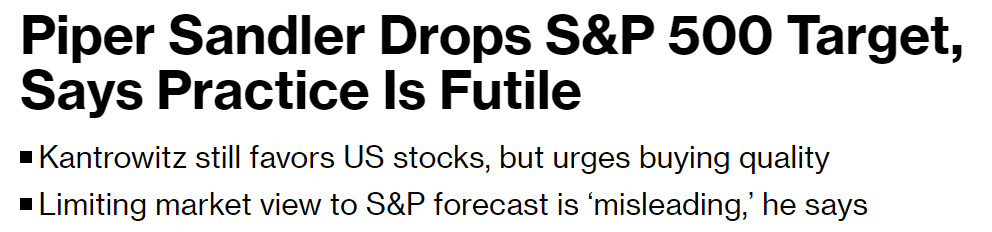
To be fair, it’s a stupid, unhelpful practice. But it does make you think about the timing.
CNN Fear and Greed says people are fearful. It’s wrong

The CNN Fear and Greed Index moved up to Neutral on Friday, but as recently as Wednesday was still in Fear mode. However, this index includes 7 components, most of which aren’t sentiment indicators at all. In fact, 2 are breadth readings, which show extreme fear because of how poor market breadth is.
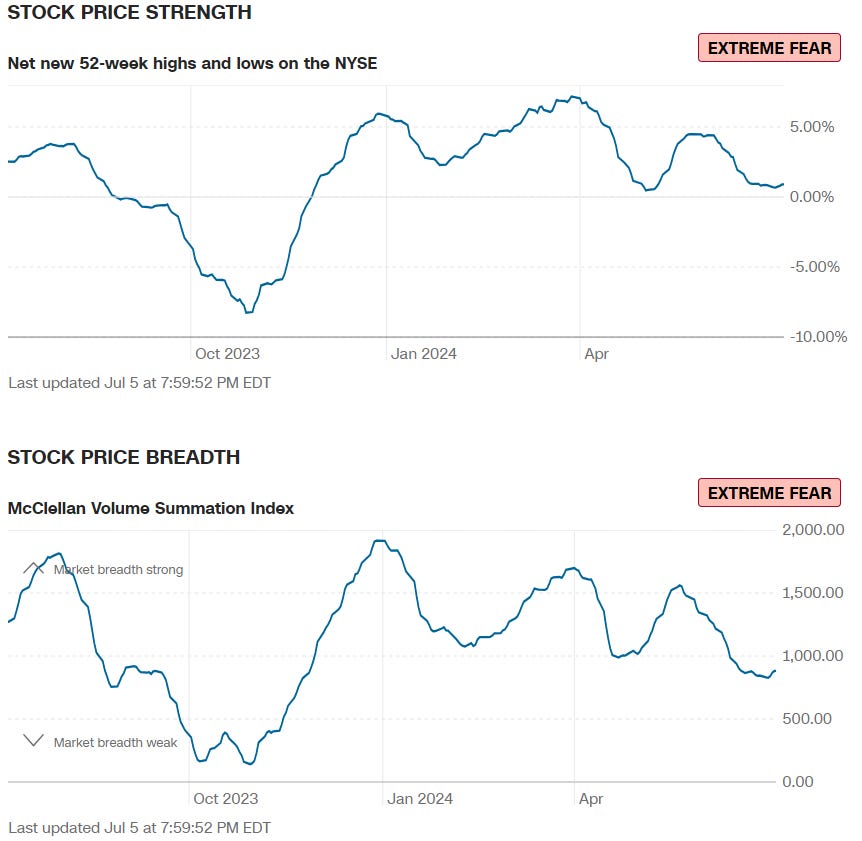
Meanwhile, one of the few components that does measure sentiment is showing extreme complacency.
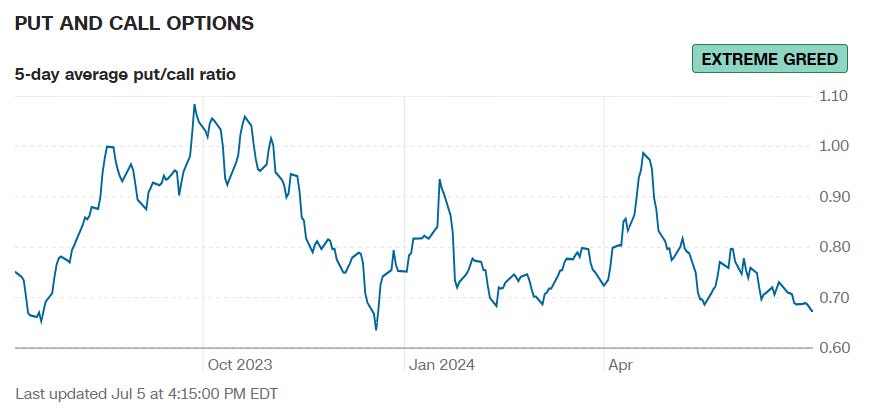
If sentiment was actually fearful with the S&P 500 at all-time highs, that would be bullish for the market and make me more bullish. But what we really have is poor breadth and complacency in the options market. Not a great combination.

Quick hits
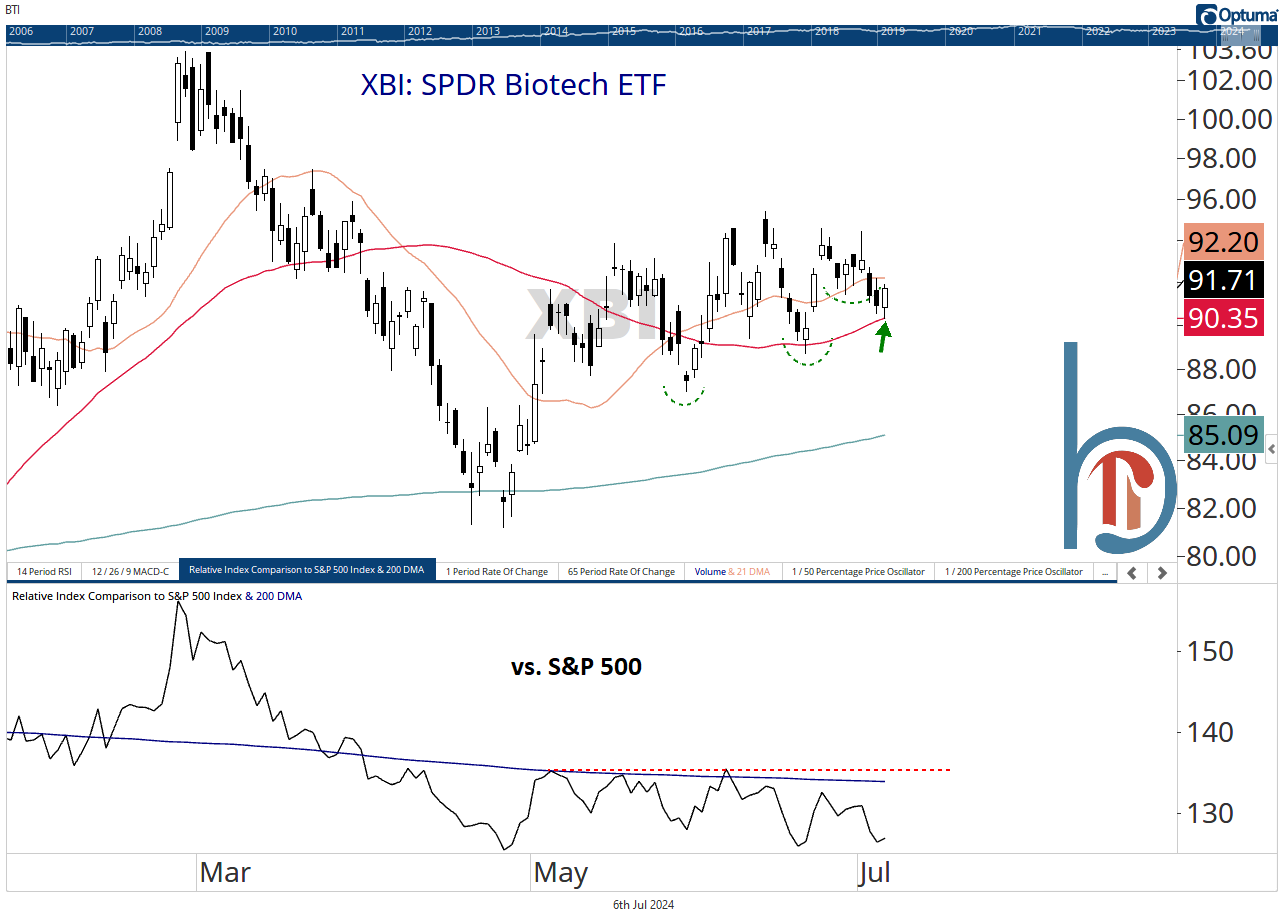
XBI finds support at the 50-DMA on Friday
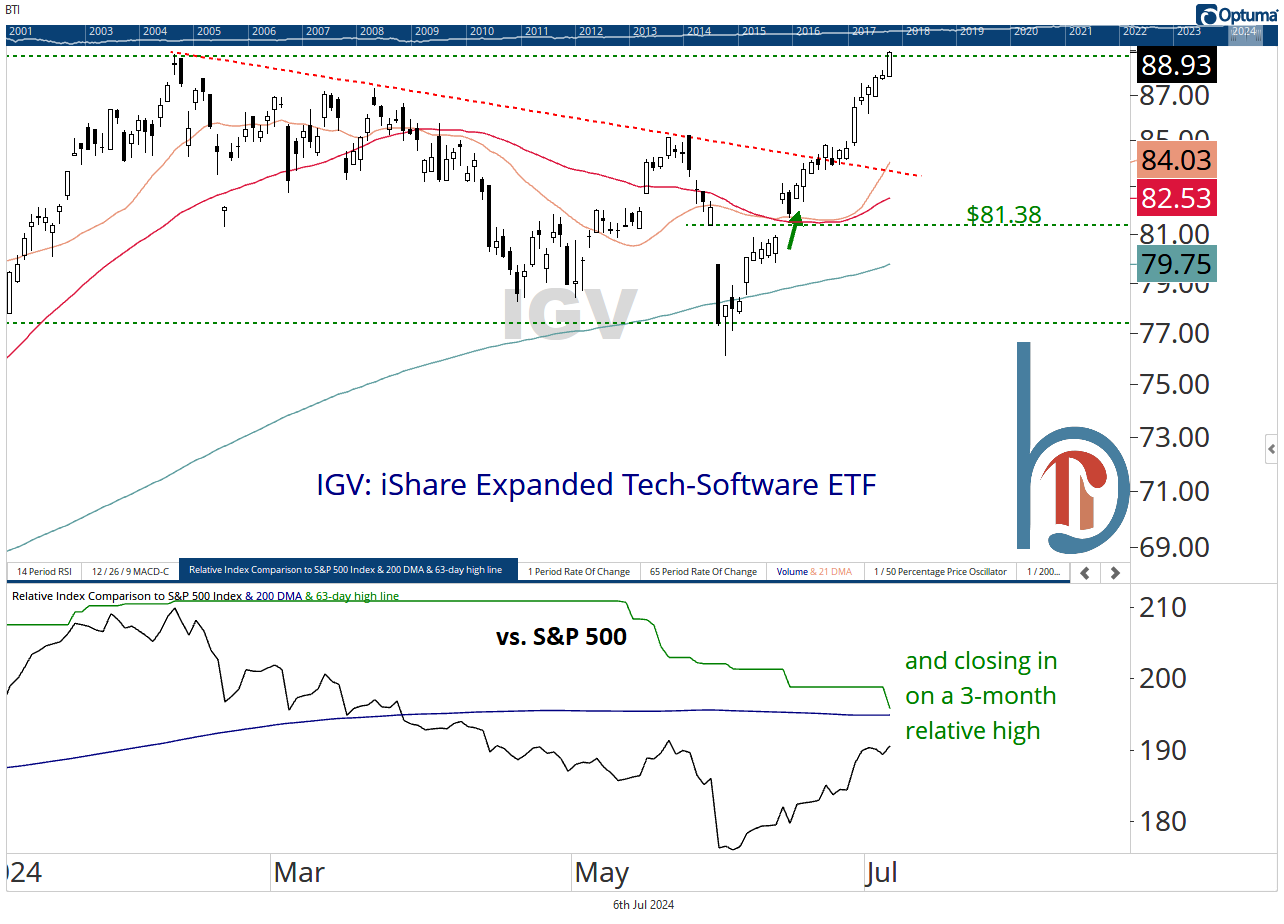
52-week high for software on Friday
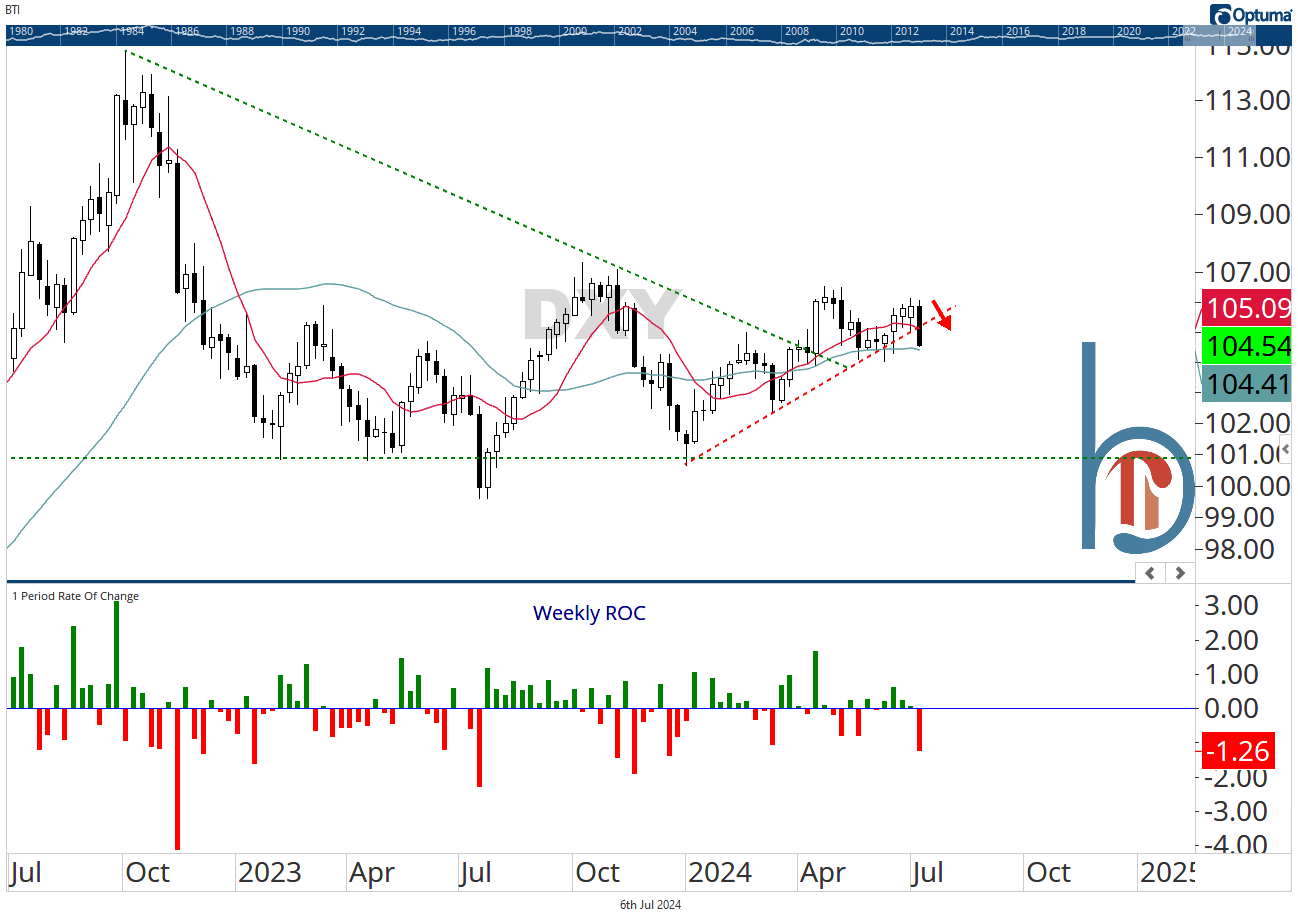
Worst week for the dollar since December (-1.3%)
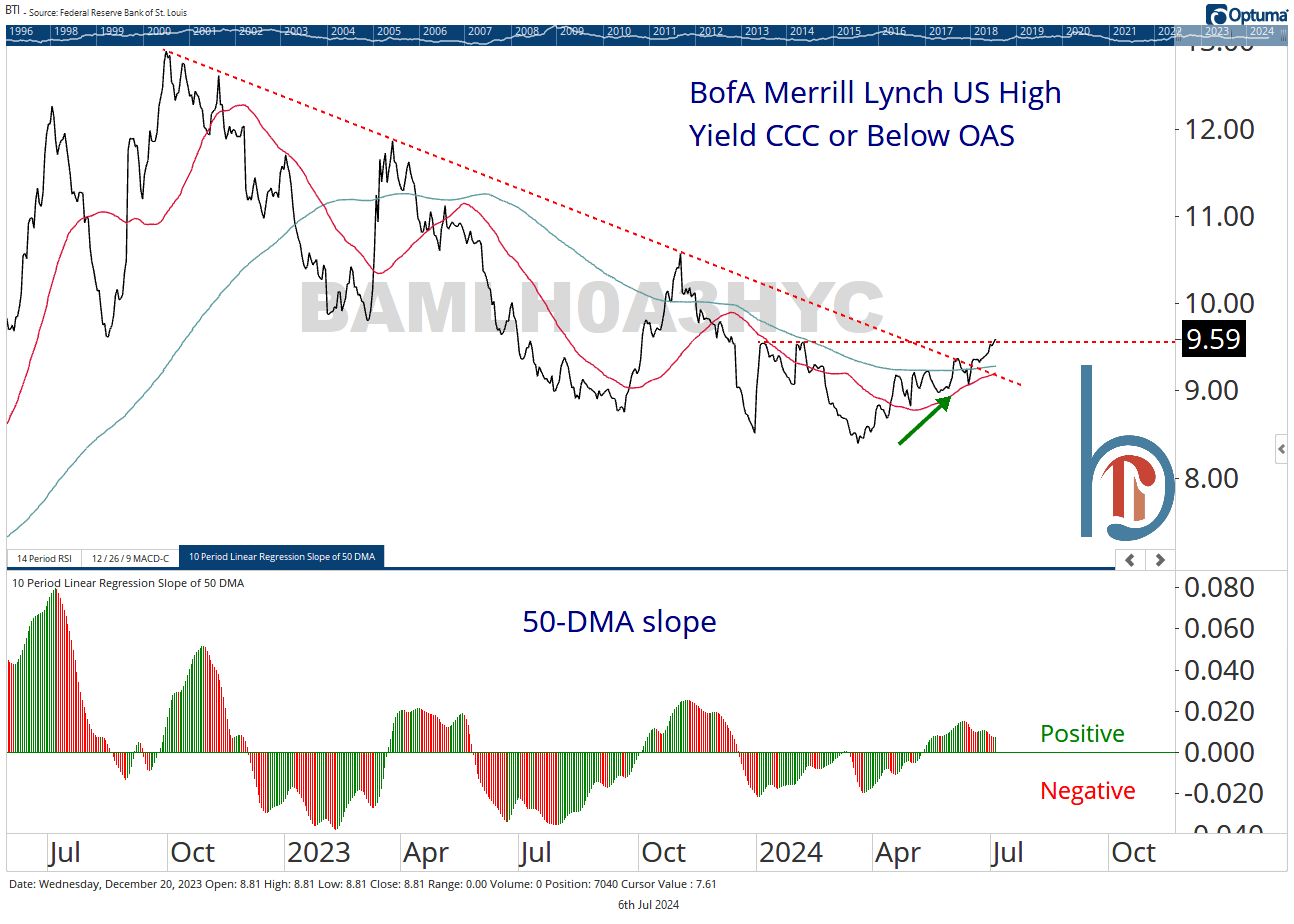
CCC and below spreads at their widest since December
Risk ratios mostly chopping sideways
Thanks so much for reading and have a great week!
Scott
Scott Brown, CMT
Founder, Brown Technical Insights

Essential insights into market trends, technicals, and opportunities
