
Overtime
The case for a recessionary bear


Good morning,
Today’s report started out as a section of the Monday Morning Playbook, but I quickly realized there was too much material to fit into that report.
I want to clarify that the charts that follow aren’t intended to be some doomsday, fear-mongering, end-of-the-world forecast or overly bold prediction. We run portfolios on the charts and relative strength, and I believe they are positioned appropriately for the current environment.
But whether you follow our ETF models or not, I think investors should be aware of just how much the current environment looks like historical market tops. It doesn’t mean it is one, but as we’ll show toward the end, at the very least, investors seem to be underpricing the risk of a recessionary bear market.
If it walks like a duck, and quacks like a duck
YTD leadership is as classic late-cycle as it gets
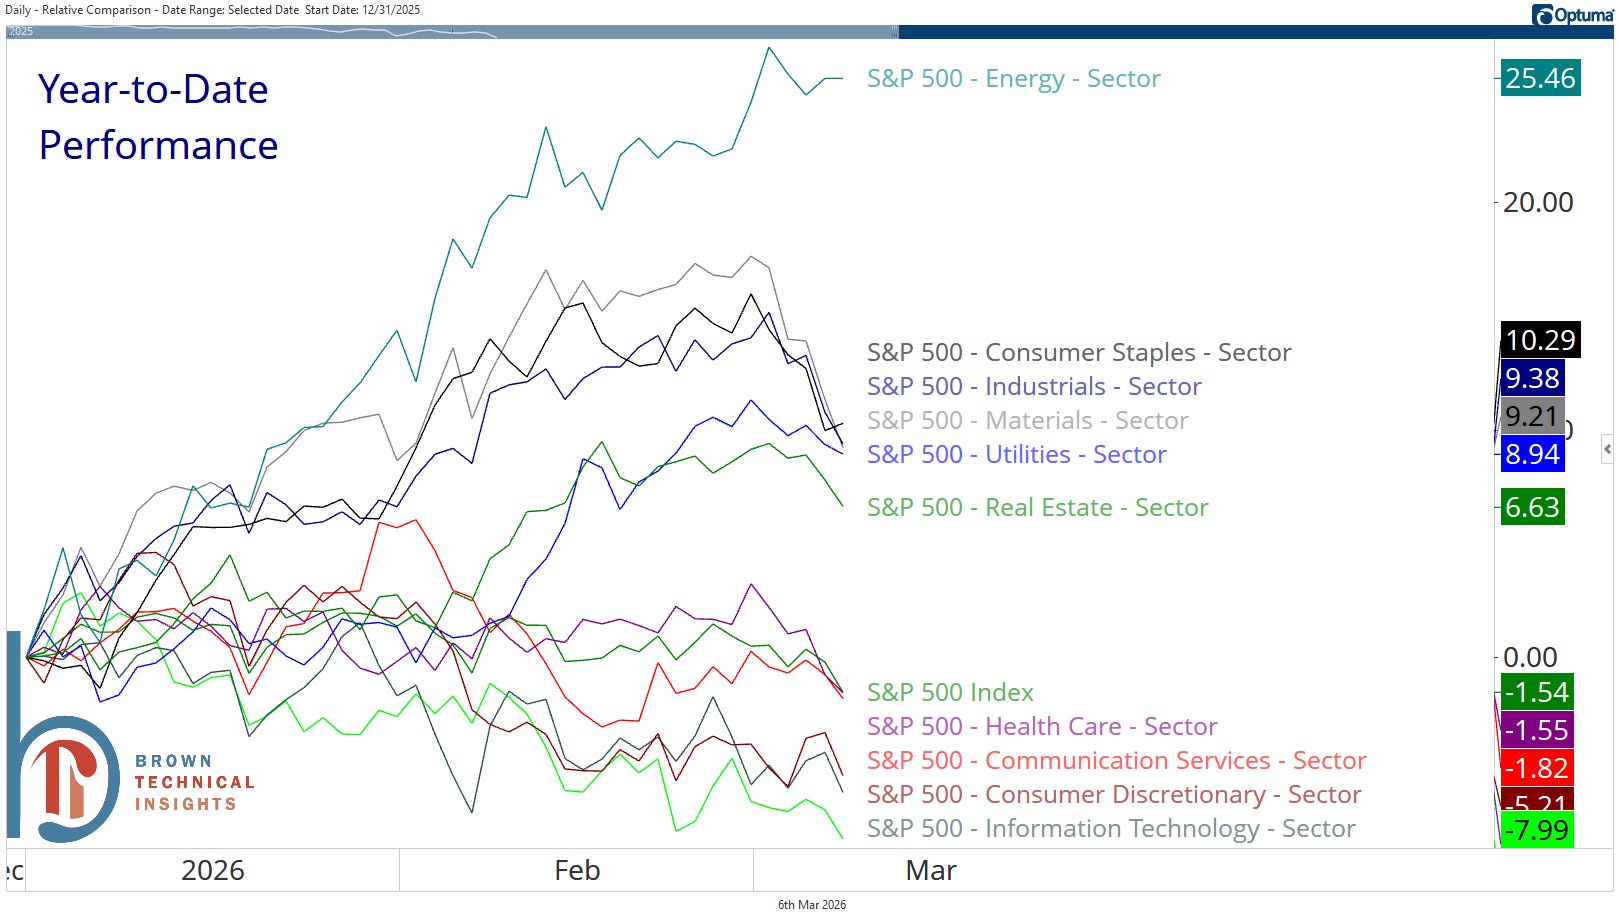
And this really isn’t a YTD story. It’s been going on since the middle of last year 👇
So why is that a concern? See the excerpt from our latest Mailtime publication on February 24:
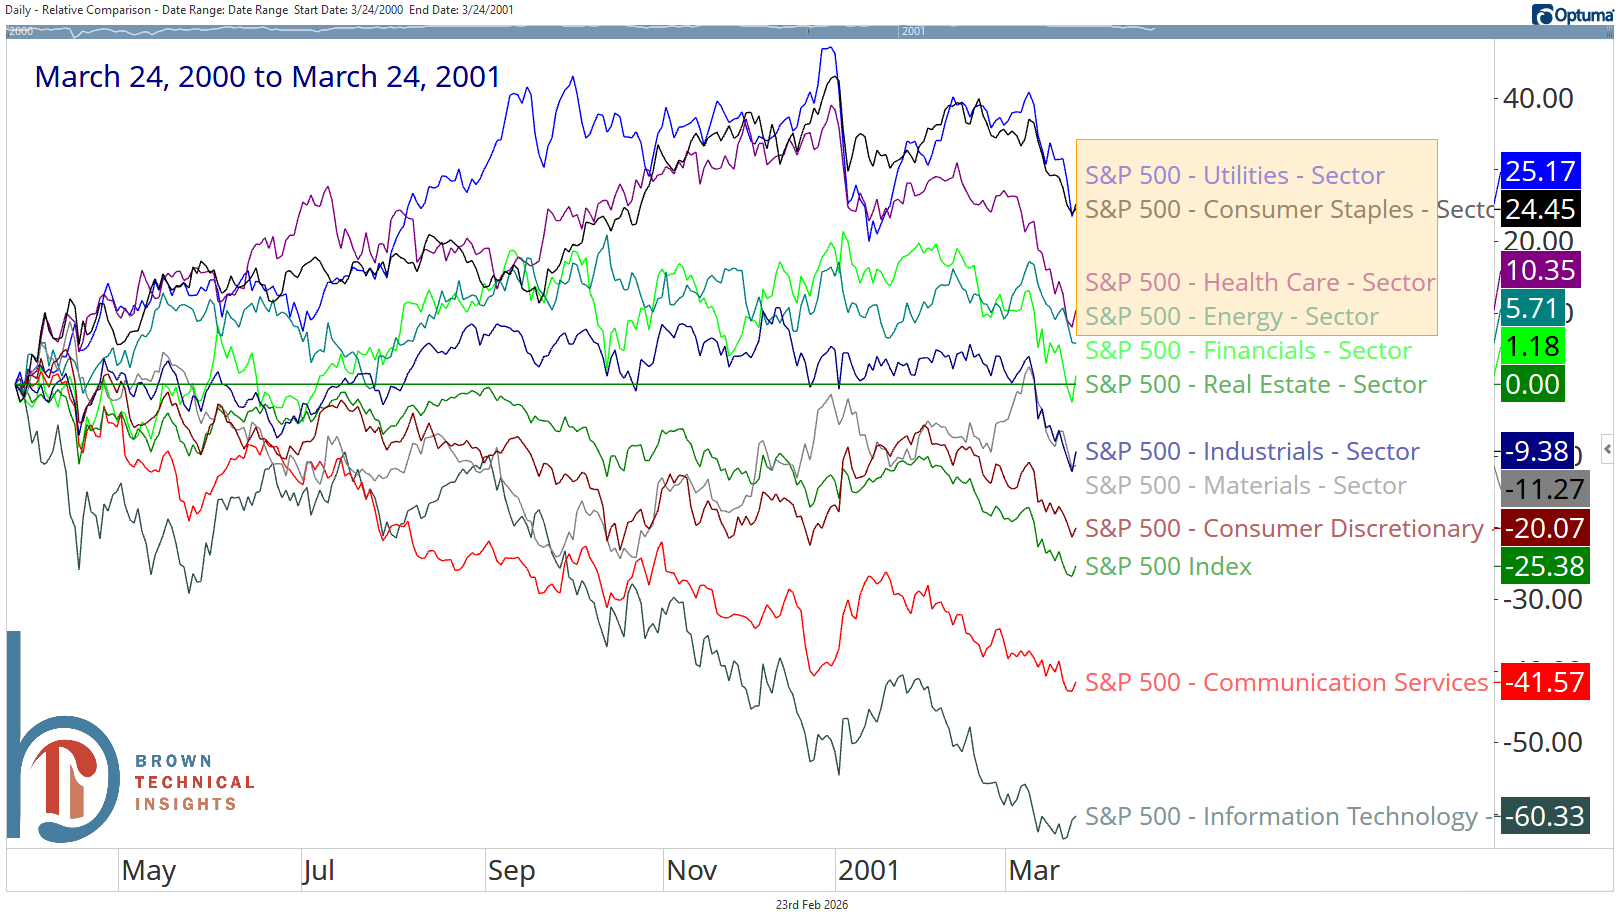
Below are the sector returns for the year ahead of the last three major bear markets. I’m using the dot-com bubble, the GFC, and 2022, and excluding Covid because it came on so suddenly. We also only have S&P 500 GICS sector data back to 1990, so that’s why we’re focusing on more recent history.
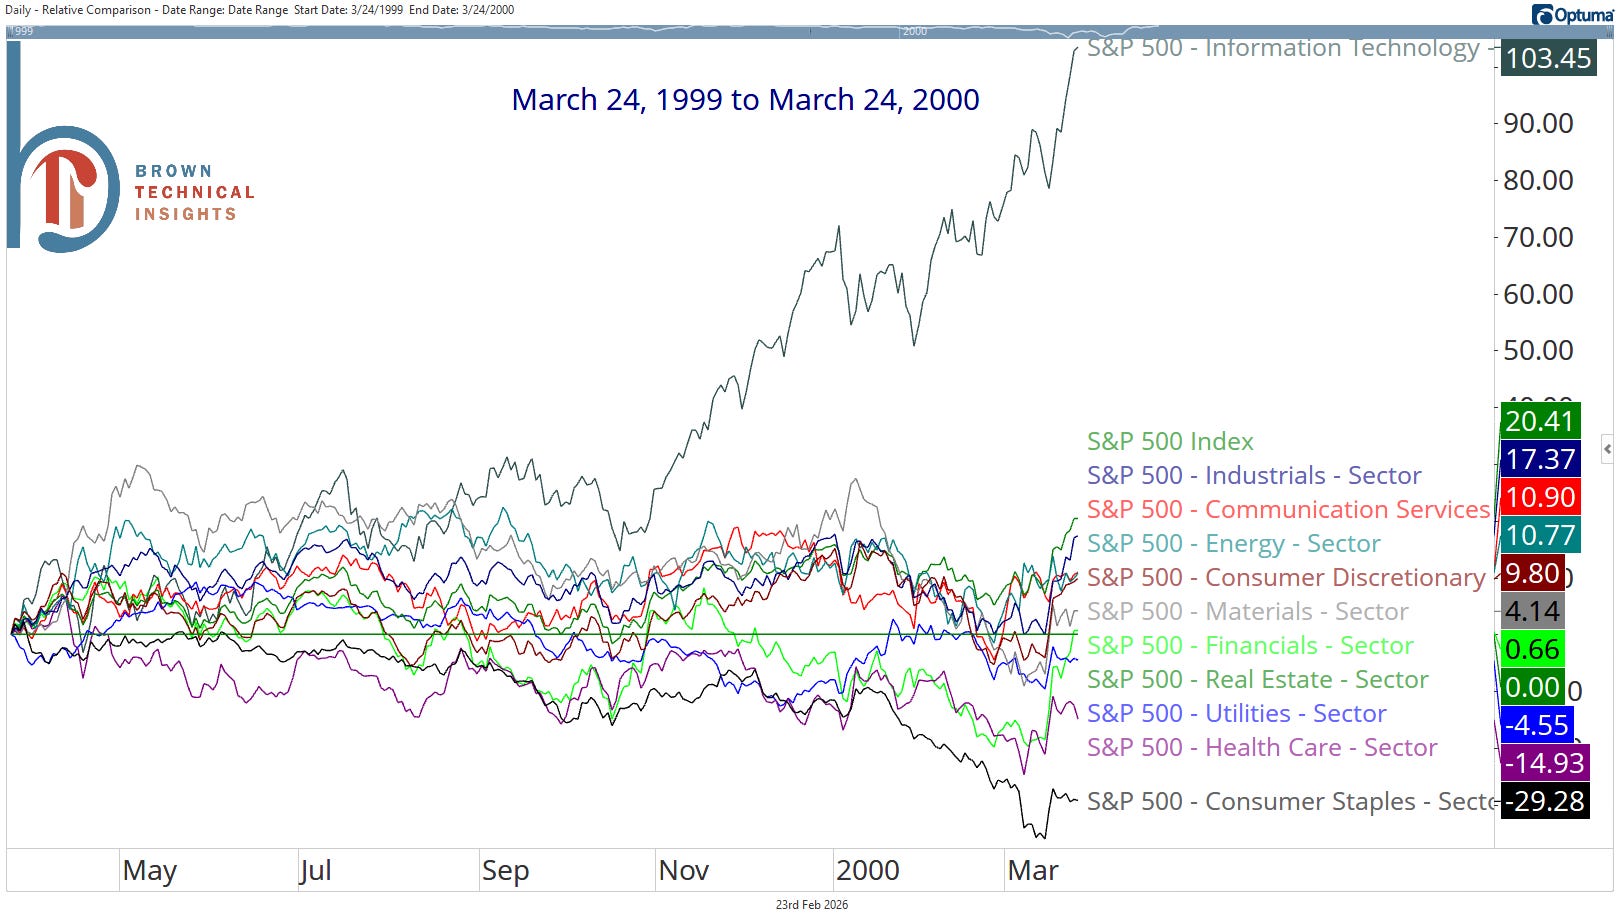
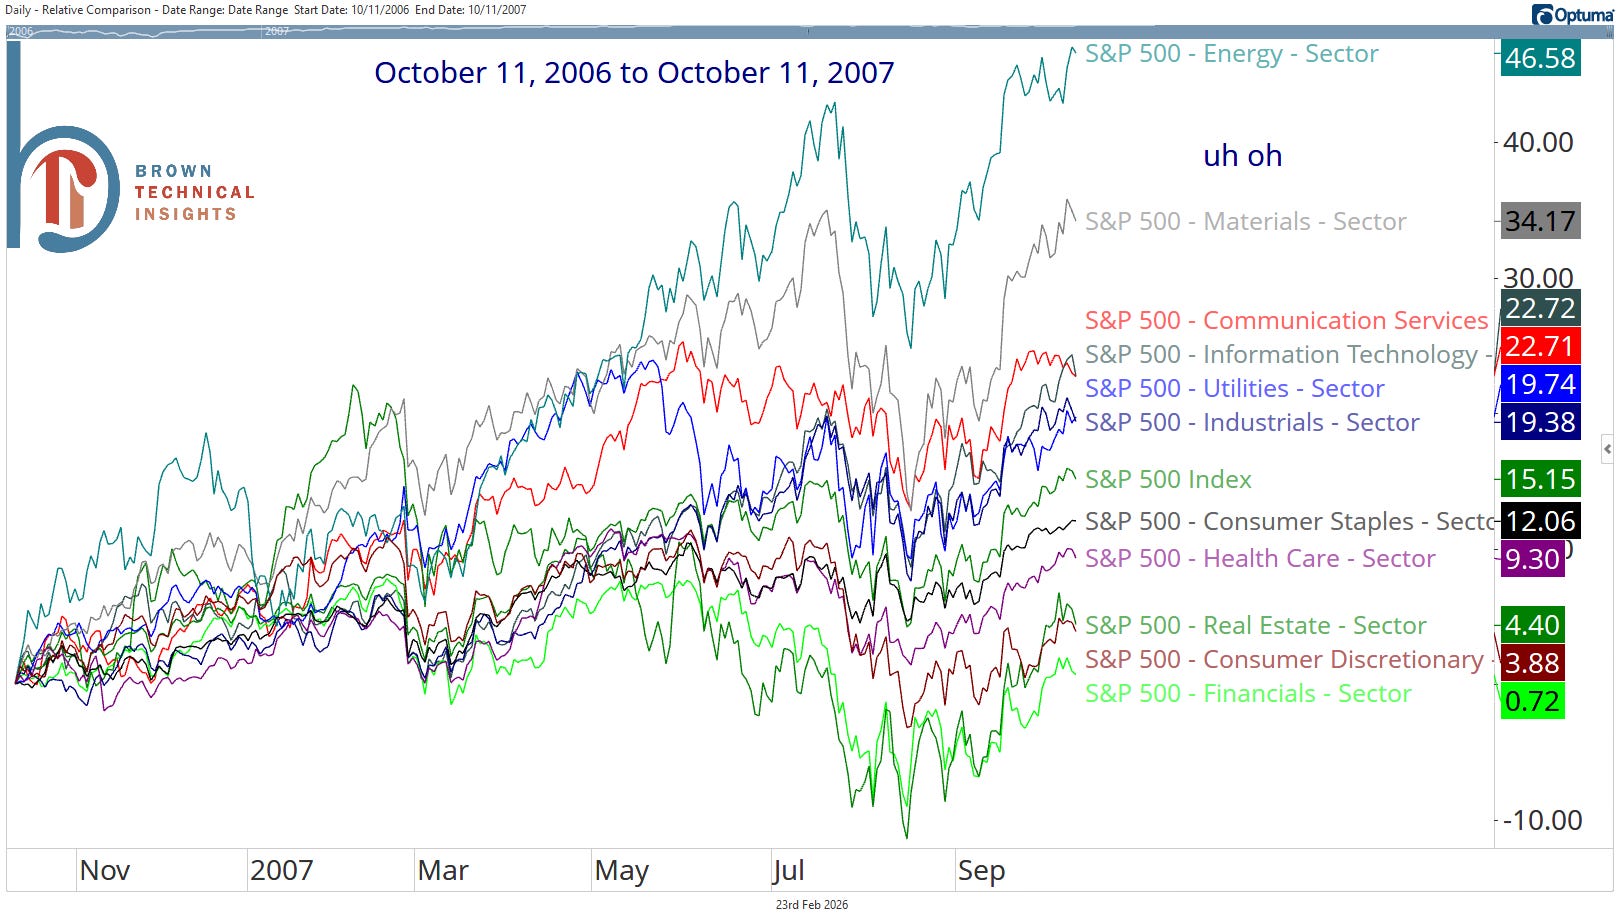
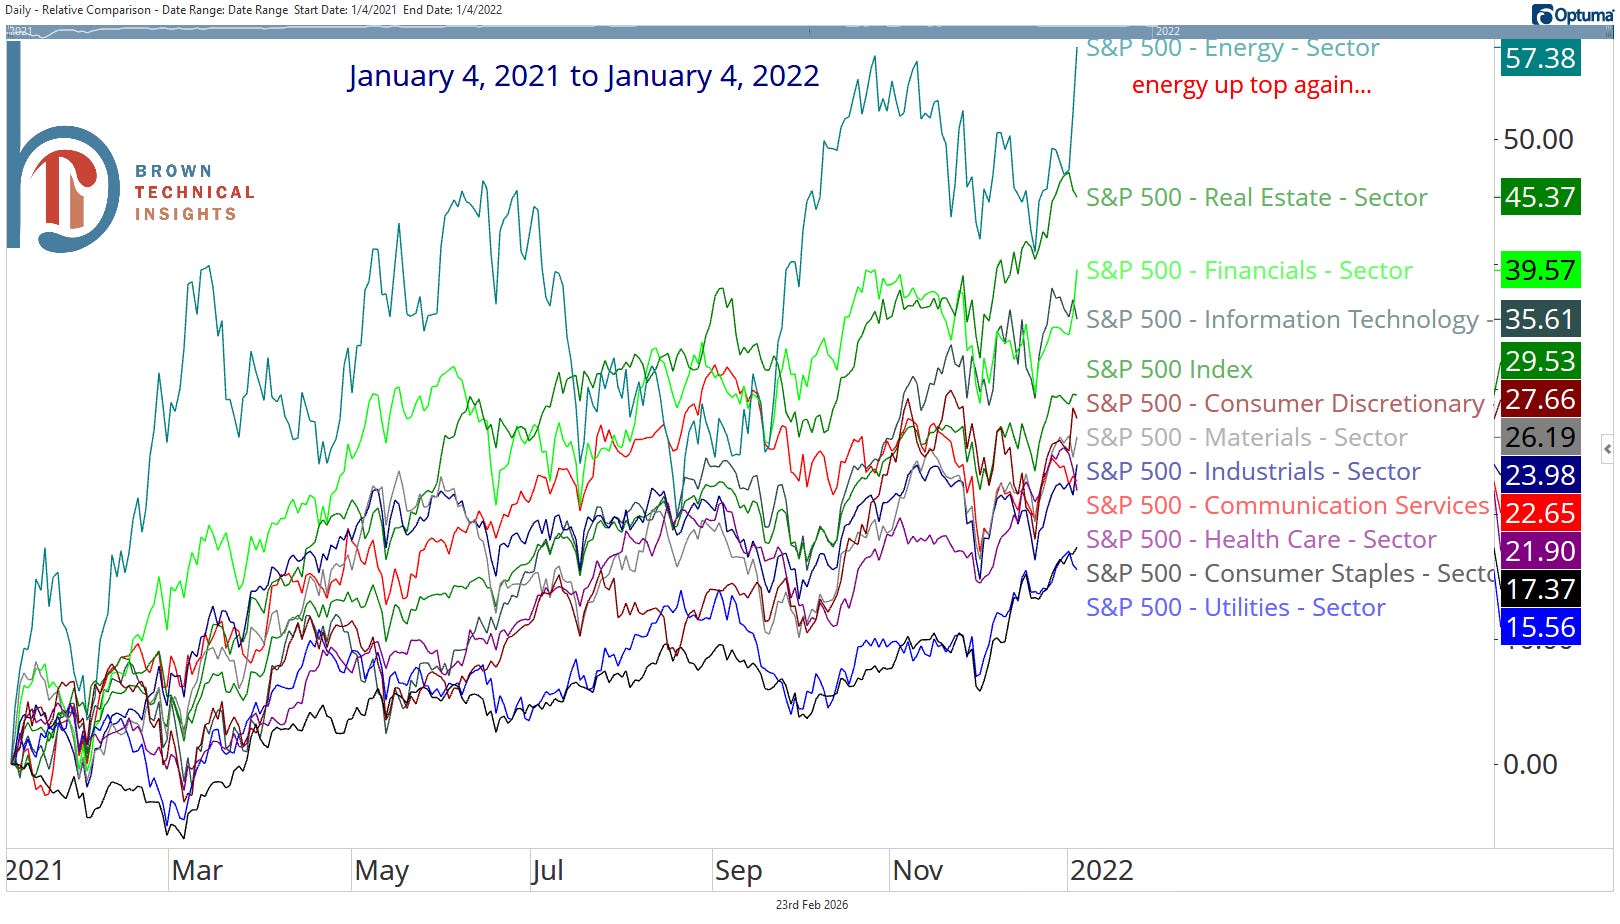
As you can see, in two of three instances, energy led into the market top, with materials right on its heels ahead of the Great Financial Crisis.
The dot-com bubble is perhaps the exception that proves the rule. The issue with the tech bubble was a breadth one, as you can see almost every sector besides tech declining in the six months ahead of the top. However, I would note that in the year following the market top, you saw classic defensive leadership, and energy positive (+5.7%), and in the number 4 spot:
Unfortunately, all of this lines up with what longer-term studies of history and the textbooks will tell us.
Below is Sam Stovall’s S&P Guide to Sector Rotation, courtesy of StockCharts.com.
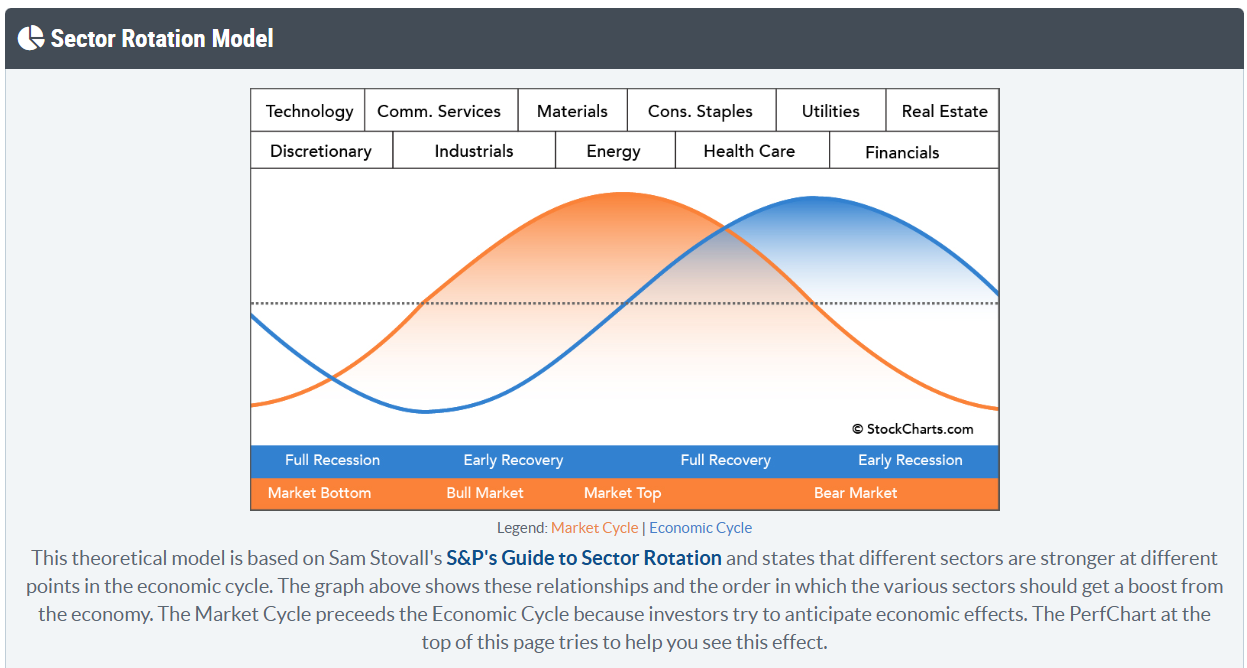
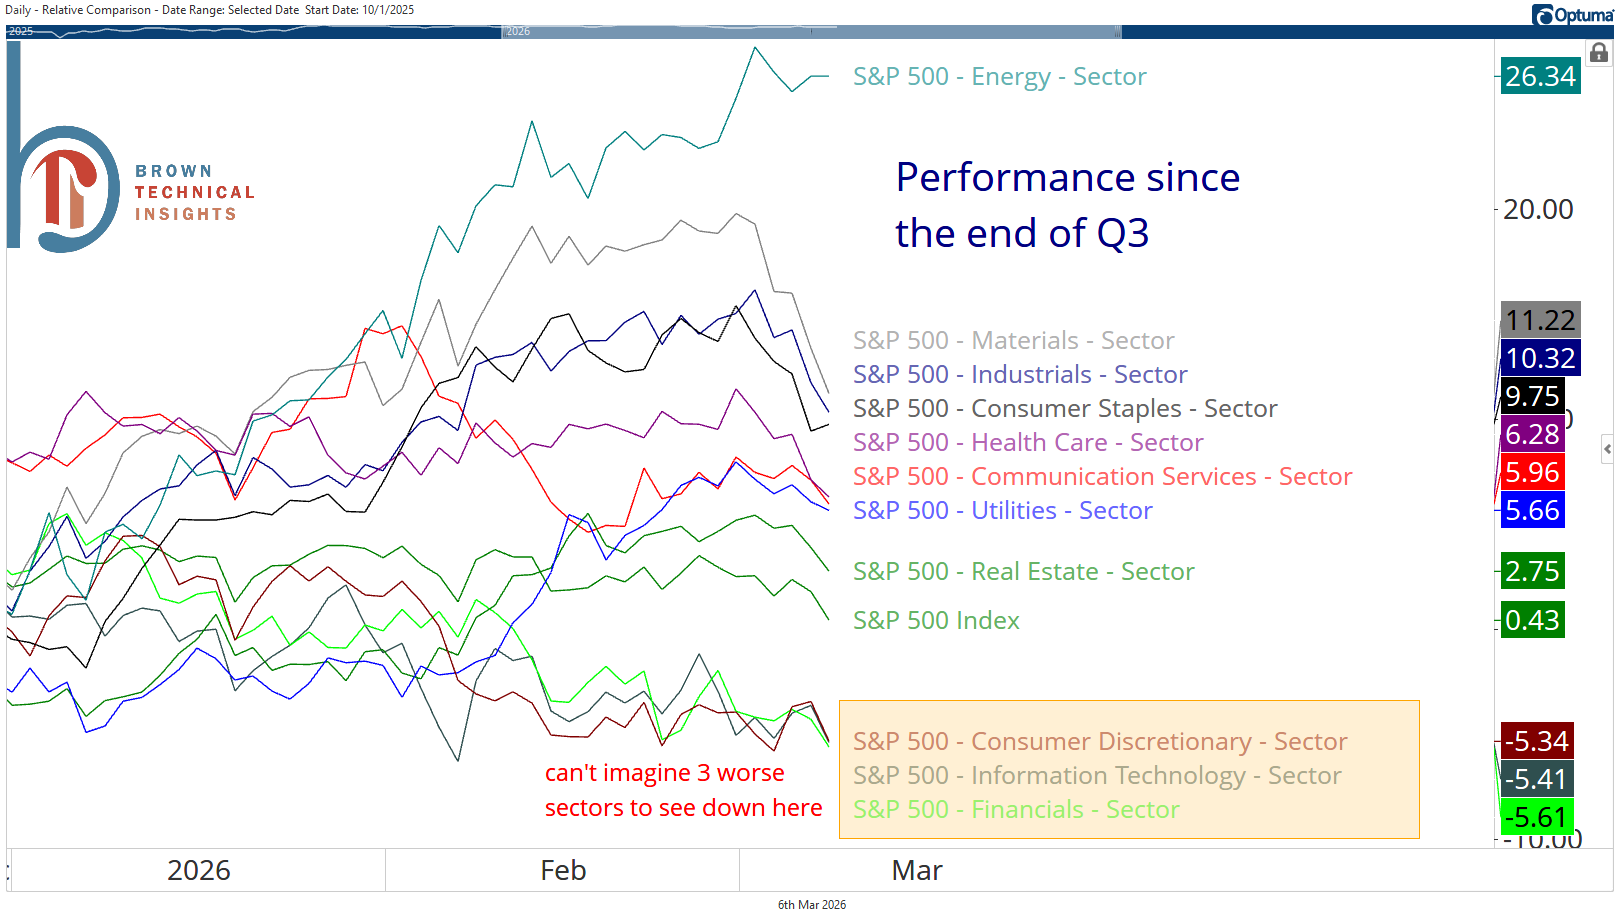
The graph shows industrials, materials, and energy as the last sectors to lead at a market top, then, as the top begins, you see the transition to consumer staples, healthcare, and utilities (all outperforming since the end of Q3).
Energy and materials leadership ahead of a market top makes sense when we look at the graph below from Martin Pring:
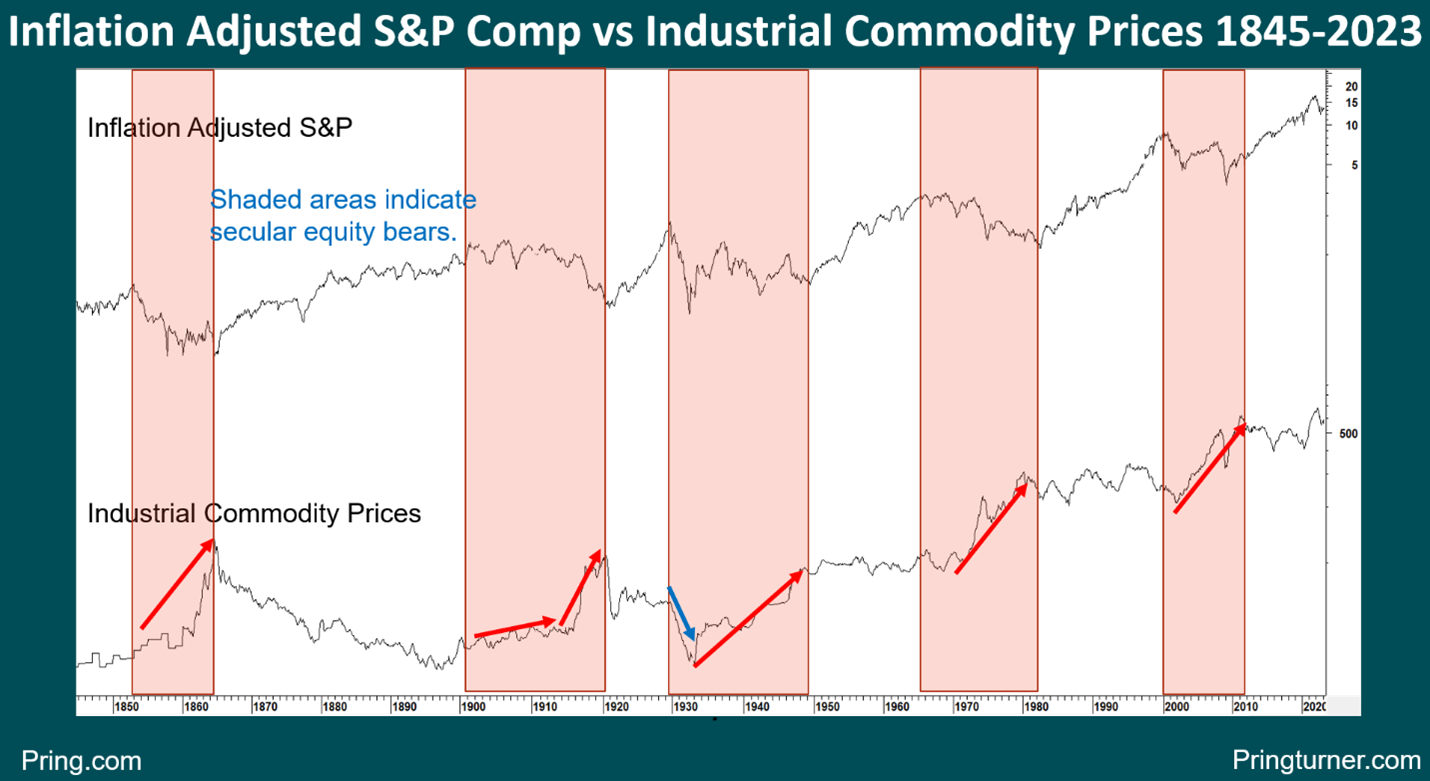
He shows us that nearly all secular bear markets since 1845 have been associated with sharply rising commodity prices.
