
The Deep Dive
Market Breadth


Good morning,
Much has been made of market breadth, specifically the lack of it over the past two months. If you’ve been a regular reader here, I no doubt have featured a number of charts showing less participation on the S&P 500’s latest swing higher.
But is it really as bad as everyone says?
Today we’re going to do a deep dive into market breadth, break down some misleading statistics, and look back at history to see what it all could mean.
Let’s dive in!
*Breadth can be complicated. At the bottom of this report are footnotes with in-depth definitions of each metric
What isn’t market breadth
Pay no attention to stats that begin like this
We’ve all heard a million versions of the following stats this year: Just X stocks have accounted for X% of the S&P 500’s gain this year.
Twenty S&P 500 stocks account for 90% of Wall Street’s gains this year (from the Financial Times, April 8)
These 7 Tech Stocks Command Almost 90% Of The S&P 500’s Gains—Signaling Market Rally May Not Be So Healthy (from Forbes, April 10)
How Big Tech Camouflaged Wall Street’s Crisis (from The New York Times, March 31)
And technically, they are true. As of last Friday’s close, the top 6 stocks (AAPL, MSFT, AMZN, META, GOOGL & GOOG, and TSLA) had contributed 658 basis points (or around 86%) of the S&P 500’s 7.66% YTD return.
So stocks would only be up 1% if it wasn’t for those stocks? Not exactly.
You see, these stats prey on people’s fears because they imply that just a few stocks are holding the market higher, but that really isn’t true.
For instance:
294 of the stocks in the S&P 500 are positive YTD
45 stocks have returned at least 20% YTD
META is the only one of the 6th largest stocks with a Top 10 YTD return
The stats only work because those stocks are up a lot AND they are the top weights in the index. It also isn’t a phenomenon unique to this year. Here is basically the exact same type of article from April 2020. Oops…
But, what’s wrong with the top stocks leading? Isn’t that how they got to be the top stocks? By going up the most? If you are a basketball fan, think of it this way:
Your best players are supposed to score most of the points
At the end of the day, breadth is about determining whether more stocks are trending up or trending down. And while breadth may not be as overwhelmingly strong as we would like to see 6 months off a major low, there may be more positives than negatives out there.
Most breadth measures confirm the choppy trend
Advance-declines lines have rebounded alongside price
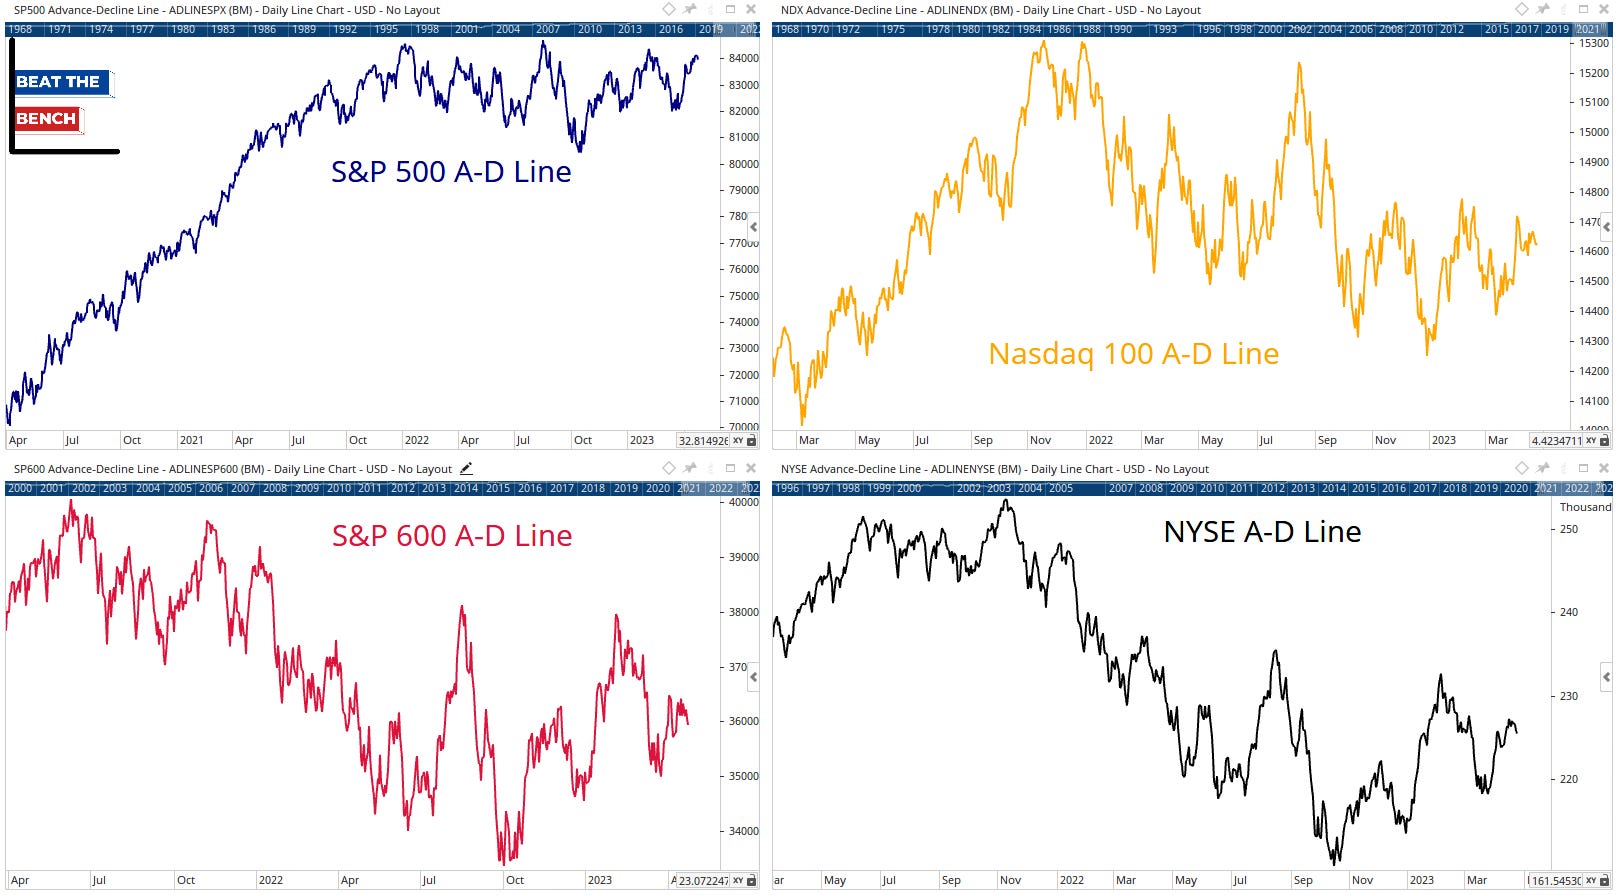
Above are the advance-decline lines1 for the S&P 500, small-cap S&P 600, Nasdaq 100, and entire New York Stock Exchange.
Overall, the action in the A-D lines confirms what is happening in the index prices, a solid rebound since the October lows, but a bit underwhelming recently, with all below their February highs. I would note, that despite the strength coming from the Nasdaq 100 and large growth YTD, the S&P 500’s A-D line is in a far healthier position.
